UNITED STATES
SECURITIES AND EXCHANGE COMMISSION
Washington, D.C. 20549
FORM |
(Mark One)
For the fiscal year ended:
or
For the transition period from __________ to __________
Commission file number:
|
|
|
(Exact name of registrant as specified in its charter) |
||
|
|
|
(State or other jurisdiction of incorporation or organization) |
|
(I.R.S. Employer Identification No.) |
(Address of principal executive offices) (Zip Code)
Registrant’s telephone number, including area code: (
Securities registered pursuant to Section 12(b) of the Act:
Title of each class |
|
Trading Symbol(s) |
|
Name of each exchange on which registered |
|
|
|||
|
|
Securities registered pursuant to Section 12(g) of the Act: None
Indicate by check mark if the registrant is a well-known seasoned issuer, as defined in Rule 405 of the Securities Act.
Yes ☐
Indicate by check mark if the registrant is not required to file reports pursuant to Section 13 or Section 15(d) of the Act.
Yes ☐
Indicate by check mark whether the registrant (1) has filed all reports required to be filed by Section 13 or 15(d) of the Securities Exchange Act of 1934 during the preceding 12 months (or for such shorter period that the registrant was required to file such reports), and (2) has been subject to such filing requirements for the past 90 days.
Indicate by check mark whether the registrant has submitted electronically every Interactive Data File required to be submitted pursuant to Rule 405 of Regulation S-T (§ 232.405 of this chapter) during the preceding 12 months (or for such shorter period that the registrant was required to submit such files).
Indicate by check mark whether the registrant is a large accelerated filer, an accelerated filer, a non-accelerated filer, a smaller reporting company, or an emerging growth company. See the definitions of “large accelerated filer,” “accelerated filer,” “smaller reporting company,” and “emerging growth company” in Rule 12b-2 of the Exchange Act.
Large accelerated filer |
|
☐ |
|
Accelerated filer |
|
☐ |
|
☑ |
|
Smaller reporting company |
|
||
Emerging growth company |
|
|
|
|
|
If an emerging growth company, indicate by check mark if the registrant has elected not to use the extended transition period for complying with any new or revised financial accounting standards provided pursuant to Section 13(a) of the Exchange Act. ☐
Indicate by check mark whether the registrant has filed a report on and attestation to its management’s assessment of the effectiveness of its internal control over financial reporting under Section 404(b) of the Sarbanes-Oxley Act (15 U.S.C. 7262(b)) by the registered public accounting firm that prepared or issued its audit report.
If securities are registered pursuant to Section 12(b) of the Act, indicate by check mark whether the financial statements of the registrant included in the filing reflect the correction of an error to previously issued financial statements. ☐
Indicate by check mark whether any of those error corrections are restatements that required a recovery analysis of incentive-based compensation received by any of the registrant’s executive officers during the relevant recovery period pursuant to §240.10D-1(b). ☐
Indicate by check mark whether the registrant is a shell company (as defined in Rule 12b-2 of the Act). Yes
The aggregate market value of the registrant's Class A common stock, $0.01 par value per share, held by non-affiliates of the registrant as of June 30, 2022, the last business day of the registrant’s most recently completed second fiscal quarter, was $
As of March 23, 2023, the registrant had
DOCUMENTS INCORPORATED BY REFERENCE
Portions of the registrant’s definitive proxy statement for the 2023 Annual Meeting of Stockholders, which will be filed with the U.S. Securities and Exchange Commission within 120 days after December 31, 2022, are incorporated by reference into Part III of this Annual Report on Form 10-K.
TABLE OF CONTENTS
|
|
Page |
3 |
||
PART I |
||
Item 1. |
7 |
|
Item 1A. |
20 |
|
Item 1B. |
39 |
|
Item 2. |
39 |
|
Item 3. |
44 |
|
Item 4. |
44 |
|
Item 5. |
45 |
|
Item 6. |
45 |
|
Item 7. |
Management’s Discussion and Analysis of Financial Condition and Results of Operations |
46 |
Item 7A. |
61 |
|
Item 8. |
62 |
|
Item 9. |
Changes in and Disagreements With Accountants on Accounting and Financial Disclosure |
110 |
Item 9A. |
110 |
|
Item 9B. |
110 |
|
Item 9C. |
Disclosure Regarding Foreign Jurisdictions that Prevent Inspections |
111 |
Item 10. |
112 |
|
Item 11. |
112 |
|
Item 12. |
Security Ownership of Certain Beneficial Owners and Management and Related Stockholder Matters |
112 |
Item 13. |
Certain Relationships and Related Transactions, and Director Independence |
112 |
Item 14. |
112 |
|
Item 15. |
113 |
|
Item 16. |
117 |
|
118 |
||
2
CAUTIONARY NOTE REGARDING FORWARD-LOOKING STATEMENTS
This Annual Report on Form 10-K (this “Annual Report”) contains certain “forward-looking statements” within the meaning of Section 27A of the Securities Act of 1933, as amended (the “Securities Act”), and Section 21E of the Securities Exchange Act of 1934, as amended (the “Exchange Act”). Forward-looking statements include those that express a belief, expectation or intention, as well as those that are not statements of historical fact. Forward-looking statements include information regarding our future plans and goals, as well as our expectations with respect to:
These forward-looking statements may be accompanied by words such as “anticipate,” “believe,” “estimate,” “expect,” “intend,” “may,” “outlook,” “plan,” “potential,” “predict,” “project,” “will,” “should,” “could,” “would,” “likely,” “future,” “budget,” “pursue,” “target,” “seek,” “objective,” or similar expressions that are predictions of or indicate future events or trends that do not relate to historical matters.
The forward-looking statements in this Annual Report speak only as of the date of this Annual Report, or such other date as specified herein. We disclaim any obligation to update these statements unless required by law, and we caution you not to place undue reliance on them. Forward-looking statements are not assurances of future performance and involve risks and uncertainties. We have based these forward-looking statements on our current expectations and assumptions about future events. While our management considers these expectations and assumptions to be reasonable, they are inherently subject to significant business, economic, competitive, regulatory and other risks, contingencies and uncertainties, most of which are difficult to predict and many of which are beyond our control. These risks, contingencies and uncertainties include, but are not limited to, the following:
3
These and other important factors that could affect our operating results and performance are described in (i) Part I, Item 1A “Risk Factors” and in Part II, Item 7 “Management’s Discussion and Analysis of Financial Condition and Results of Operations” of this Annual Report, and elsewhere within this Annual Report, (ii) our other reports and filings we make with the SEC from time to time, and (iii) other announcements we may make from time to time. Should one or more of the risks or uncertainties described in the documents above or in this Annual Report occur, or should underlying assumptions prove incorrect, our actual results, performance, achievements or plans could differ materially from those expressed or implied in any forward-looking statements. All such forward-looking statements in this Annual Report are expressly qualified in their entirety by the cautionary statements in this section.
4
Summary of Principal Risk Factors
Our business is subject to a number of risks and uncertainties. The following is a summary of the principal risk factors that could materially adversely affect our business, financial condition and results of operations. A more complete statement of those risks and uncertainties is set forth in “Risk Factors” in Item 1A of Part I of this Annual Report.
5
6
PART I
ITEM 1. BUSINESS
Unless the context otherwise requires or as is otherwise indicated, references in this Annual Report to the “Company,” “ProFrac,” “we,” “our” and “us,” or like terms, refer to (i) before the completion of the Corporate Reorganization, ProFrac Holdings, LLC, a Texas limited liability company (“ProFrac LLC”), and its consolidated subsidiaries; and (ii) following the completion of the Corporate Reorganization, ProFrac Holding Corp., a Delaware corporation (the “Issuer”), and its consolidated subsidiaries.
When we refer to a “fleet” or a “frac fleet,” we are referring to the pumping units, truck tractors, data trucks, storage tanks, chemical additive and hydration units, blenders and other equipment necessary to perform well stimulation services, including back-up pumping capacity.
Overview and Strategy
We are a technology-focused, vertically integrated energy services company providing well stimulation services, proppants production and other complementary products and services to oil and gas companies engaged in exploration and production (“E&P”) of unconventional oil and natural gas resources throughout the United States. Founded in 2016, ProFrac was built to be the go-to service provider for E&P companies’ most demanding hydraulic fracturing needs. Our business combines a young fleet of modern, technologically advanced pressure pumping equipment with vertically integrated proppant, chemicals and manufacturing, enabling us to deliver premium service quality while maintaining an advantaged cost structure. We believe the technical and operational capabilities of our fleets, as well as our internal frac sand production and equipment manufacturing capabilities uniquely position us to capitalize on the growing demand for well stimulation services to support the ongoing development of American oil and gas reserves. Additionally, we have a focused M&A strategy to acquire high-quality businesses at attractive valuations that increase our scale and expand our technological and supply chain competencies. Since the completion of our IPO, we have completed six acquisitions adding approximately 18.7 million tons of annual sand capacity and 13 frac fleets. These acquisitions provide us with an opportunity to generate attractive returns, when combined with our operational and commercial platform.
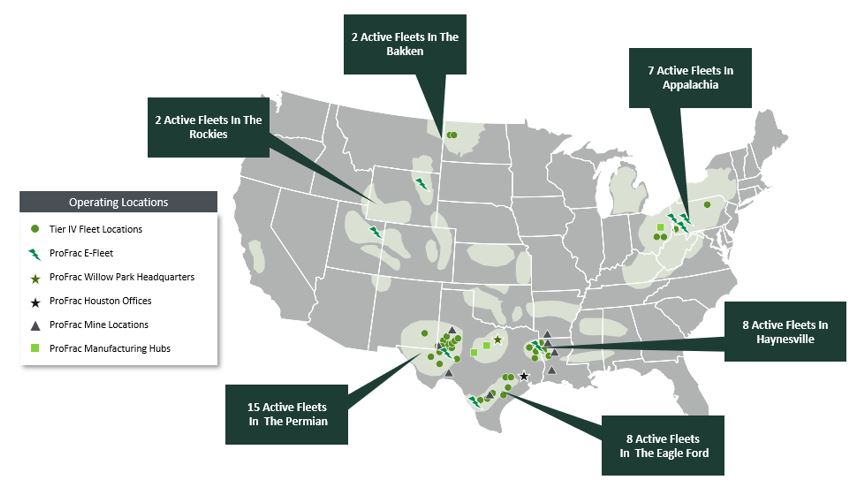
Our operations are focused on the most active unconventional regions in the United States, where we have cultivated deep and longstanding customer relationships with some of those regions’ leading E&P companies. We believe we are among the largest well stimulation services providers in the United States, with 42 active fleets as of January 3, 2023. We operate throughout nearly all major unconventional oil and gas basins in the United States and our scale and geographical footprint provide us with both operating leverage as well as exposure to a diversified customer and commodity mix.
We employ a differentiated business model, focused on vertical integration, technological innovation and actively acquiring assets and businesses that expand our capabilities. In combination with our deep technical expertise, our ability to design and manufacture equipment and internally produce proppant positions us to custom tailor our products and services to meet the needs of our customers. Additionally, we believe we are uniquely positioned as an industry consolidator. ProFrac’s management team has extensive expertise in making strategic acquisitions, as well as a proven ability to rapidly and successfully integrate acquired businesses into our operations.
7
The following map shows our operating locations throughout the United States as of January 3, 2023:
Business Strategies
We are focused on employing new technologies to significantly reduce “greenhouse gas” (“GHG”) emissions and increase efficiency in what has historically been an emissions-intensive component of the unconventional E&P development process. We believe the technical and operational capabilities of our fleets position us to serve our customers’ shifting preferences, which are increasingly favoring the sustainable development of natural resources. We intend to create value for our stakeholders through the following business strategies:
8
Operating Segments
Stimulation Services Segment
ProFrac is one of the largest providers of well stimulation services in the United States. As of January 3, 2023, we had 42 active fleets, with an additional four fleets under construction. Our total fleet includes 20 Tier IV fleets (17 of which are dual fuel or DGB), eight electric fleets and four newbuild electric fleets. Currently, our operations are focused on the Permian Basin, Eagle Ford, Haynesville, Appalachia and the Rockies. With our broad operating footprint, we are able to serve a diversified customer base with balanced exposure to public and private E&P customers that are developing both oil and natural gas reserves.
Our conventional hydraulic fracturing fleets have been designed to handle the most demanding well completions, which are characterized by higher pumping pressures, higher pumping volumes and longer horizontal wellbores. We continue to upgrade and overhaul our fleets with the goal of having all of our conventional fleets similarly equipped with lower-emission Tier IV diesel engines, a process made cheaper by our in-house manufacturing capabilities detailed below. Additionally, we continue to expand our electric frac fleets. This strategy aligns with our environmental focus to minimize our carbon footprint as a part of our goal to have all of our conventional fleets equipped with emissions reduction technology.
9
In addition to our conventional fleets, we are constructing and have acquired electric powered fleets. This technology utilizes electric motors powered by lower-cost, lower-emission power solutions, primarily using on-site generation from natural gas produced and conditioned in the field or compressed natural gas (“CNG”). We believe that this fuel supply can provide our customers with additional tools to meet their emissions and sustainability goals by reducing their reliance on diesel fuel, as well as offer significant fuel cost savings. These fleets are intended to provide our customers a suite of options to satisfy their ESG objectives while maximizing operating efficiency.
Our stimulation services competitors include Halliburton Company, Liberty Energy Inc. and NexTier Oilfield Solutions Inc.
Proppant Segment
In connection with our vertically integrated business model, we own and operate frac sand mines and processing facilities. We are the largest producer of in-basin proppants, with approximately 21 million tons of annual production capacity across eight mines serving the Permian Basin, Eagle Ford and Haynesville markets. Acquiring and integrating sand mines is a critical element of our operating strategy. Since December 2021, we have completed four proppant acquisitions, consisting of six operating mines and one greenfield development which we brought to production in December 2022.
Our mines are strategically located throughout key pressure pumping markets, allowing us to produce proppants in close proximity to the areas in which our fleets operate. We believe that mining our own sand helps to insulate us from market volatility, as ProFrac is able to ensure adequate supply in tight markets, minimizing disruptions to our operations and associated non-productive time, and to bolster fleet profitability through cycles as we aggregate profit margin from the mine to the wellhead. We believe that our scale in proppant production in combination with our logistics expertise supports our ability to deliver best-in-class service quality and cost for our customers. Further, we believe that our concentration of active fleets in the markets in which we operate sand mines provides significant baseload demand that will help us drive utilization of our mines and offer significant opportunities for cost optimization.
Our mining operations currently serve the following markets:
10
Manufacturing Segment
We operate facilities in which we assemble new fleets, refurbish existing fleets, rebuild engines and transmissions, and manufacture many of the components used by our fleets, including pumps, fluid ends, power ends, flow iron and other consumables. These facilities perform substantially all of the maintenance, repair and servicing of our hydraulic fracturing fleets, as well as provide in-house manufacturing capacity that enables cost-advantaged growth and maintenance. Additionally, our internal manufacturing capabilities enable us to upgrade and modernize acquired fleets in a cost-efficient manner.
Vertical integration enables us to realize a lower capital investment and operating expense by capturing the margin of manufacturing and/or maintenance, and by enabling the ongoing improvement of our equipment and processes as part of a continuous research and development cycle. This combination also facilitates our “Acquire, Retire, Replace”™ approach to growing, maintaining and modernizing our fleets, and we believe that it helps us mitigate supply chain constraints that have disrupted competitors’ and customers’ operations in the past. Our in-house manufacturing capabilities also allow us to rapidly implement new technologies in a cost-effective manner.
Our manufacturing capabilities and control over the manufacturing process have allowed us to design and build hydraulic fracturing fleets to uniform specifications intended for deployment in resource basins requiring high levels of pressure, flow rate and sand intensity. We believe the standardized, modular configuration of our equipment provides us with several competitive advantages, including reduced repair and maintenance costs, reduced downtime, reduced inventory costs, reduced complexity in our operations, training efficiencies and the ability to redeploy equipment among operating basins.
2022 Significant Events
Initial Public Offering and Corporate Reorganization
On May 17, 2022, we consummated the initial public offering (“IPO”) of 16,000,000 shares of the Issuer’s Class A common stock, par value $0.01 per share (the “Class A Common Stock”), at a public offering price of $18.00 per share. On June 6, 2022, the underwriters’ over-allotment option was partially exercised, resulting in a sale of an additional 2,228,153 shares of Class A Common Stock at a price of $18.00 per share. The IPO and exercise of the underwriters’ over-allotment option generated combined net proceeds of $301.7 million, after deducting underwriter discounts and commissions and estimated offering costs. In connection with our IPO and the corporate reorganization (see “Note 1. Organization and Description of Business” in the notes to our consolidated financial statements), the Issuer became a holding company.
After giving effect to the corporate reorganization and the IPO, ownership of the issued and outstanding limited liability company interests of ProFrac LLC (the “Units”) was distributed as follows: (i) approximately 27.8% was owned, directly or indirectly, by the Issuer, and (ii) the balance (approximately 72.2%) was owned, together with all of the Issuer’s Class B common stock, par value $0.01 per share (the “Class B Common Stock”) by legacy members.
Information regarding consideration paid in connection with our acquisitions in 2022, discussed below, should be read in conjunction with the further disclosure contained in Note 4 to our consolidated financial statements (see “Note 4. Business Combinations and Asset Acquisition”):
Acquisition of FTS International, Inc.
On March 4, 2022, ProFrac LLC acquired FTS International Inc. (“FTSI”) for a purchase price of approximately $405.7 million, consisting of cash consideration of $332.8 million and certain equity interests in ProFrac LLC of $72.9 million (the “FTSI Acquisition”). Prior to the FTSI Acquisition, FTSI was one of the largest providers of hydraulic fracturing services in North America, with 1.3 million HHP as of December 31, 2021. FTSI averaged 13 active fleets in the fourth quarter of 2021, with operations in the Permian Basin, Eagle Ford Shale, Midcontinent, Haynesville Shale and Uinta Basin.
Consolidation of Flotek Industries, Inc.
Through a series of transactions in the first half of 2022, we entered into a supply agreement with Flotek Industries, Inc. (“Flotek”) to provide full downhole chemistry solutions for 30 of our hydraulic fracturing fleets for a period of ten years starting on April 1, 2022. In exchange for entry into the supply agreement, we received $60.0 million in principal amount of convertible notes, and we received the right to designate up to four out of seven directors to Flotek’s board of directors.
11
Because of our power to appoint directors to the board of directors of Flotek without a direct equity interest in Flotek, we determined that Flotek is a variable interest entity (“VIE”). We further determined that the Company is the primary beneficiary of the VIE, due to our ability to appoint a majority of directors to Flotek’s board of directors. As a result, subsequent to May 17, 2022, the date that Flotek shareholders approved the supply agreement, we have accounted for this transaction as a business combination using the acquisition method of accounting. Accordingly, Flotek’s financial statements have been included in our consolidated financial statements from May 17, 2022.
We believe our investment in and strategic relationship with Flotek demonstrates our commitment to our vertical integration strategy and provides greater control over our supply chain.
Acquisition of SP Silica of Monahans, LLC and SP Silica Sales, LLC
On July 25, 2022, we acquired 100% of the issued and outstanding membership interests of the West Texas subsidiaries of Signal Peak Silica, for a purchase price of $90.0 million in cash (the “Monahans Acquisition”). In connection with the closing of the Monahans Acquisition, we acquired an in-basin frac sand facility and related mining operations in the Permian Basin (the “Monahans Sand Mine”).
Acquisition of U.S. Well Services, Inc.
On November 1, 2022, we acquired U.S. Well Services, Inc. (“USWS”) for a total purchase consideration of $479.1 million, consisting of cash consideration of $195.9 million, issuance of 12.9 million shares of Class A Common Stock valued at $282.0 million, and issuance of Class A Common Stock warrants valued at $1.1 million (the “USWS Acquisition”).
Prior to the USWS Acquisition, USWS was a technology-driven oilfield service company focused on electric-powered pressure pumping services in the United States. The USWS fleets consist mostly of all-electric, mobile pressure pumping equipment and other auxiliary heavy equipment to perform stimulation services. The USWS Clean Fleet® electric fleets replace the traditional engines, transmissions, and radiators used in conventional diesel fleets with electric motors.
Acquisition of Monarch Silica, LLC
On December 23, 2022, we completed the acquisition of the Eagle Ford sand mining operations of Monarch Silica, LLC, and related real estate property, for total purchase consideration of $175 million, consisting of cash consideration of $87.5 million and a secured note payable to the seller, Monarch Capital Holdings, LLC, for the remaining $87.5 million. A portion of the consideration is subject to certain customary post-closing adjustments.
Acquisition of REV Energy Holdings, LLC
On December 30, 2022, we acquired REV Energy Holdings, LLC (“REV”), a privately owned pressure pumping service provider with operations in the Rocky Mountains and Eagle Ford Shale. REV operates three premium frac fleets totaling 204,500 HHP. This acquisition expanded ProFrac’s presence in the Rocky Mountains and Eagle Ford Shale.
We acquired REV for a total purchase consideration of $140.0 million, consisting of (i) a number of shares of Class B Common Stock and Units, valued at $70.0 million, (ii) a secured note payable to BCKW LLC (REV sellers’ representative), with a principal amount of $39.0 million, (iii) approximately $5.5 million in debt assumption, and (iv) cash consideration of $25.5 million. A portion of the total purchase consideration is subject to certain customary post-closing adjustments. The agreement pursuant to which we acquired REV provides for up to $20.0 million of earn-out payments to the sellers if certain EBITDA-based performance targets are achieved during 2023.
Recent Developments
Potential Redemption by Related Parties
See the discussion in Item 9B of this Annual Report.
Acquisition of Producers Service Holdings LLC
On January 3, 2023, we acquired 100% of the issued and outstanding membership interest of Producers Service Holdings LLC (“Producers”), a Delaware limited liability company, an employee-owned pressure pumping services provider serving Appalachia and the Mid-Continent, for approximately $35.0 million of total transaction value, of which approximately half was payable in shares of Class A Common Stock, with the remainder consisting of cash and debt assumption. A portion of the cash consideration is subject to certain customary post-closing adjustments. Through this transaction, we have added three fleets, of which two are currently active, totaling 200,000 HHP as well as a 50,000 square foot manufacturing facility located near Zanesville, OH, through which we plan to expand our manufacturing footprint to support Northeast operations.
12
Acquisition of Performance Proppants
On February 24, 2023, we acquired 100% of the issued and outstanding membership interests in (i) Performance Proppants, LLC, a Texas limited liability company, (ii) Red River Land Holdings, LLC, a Louisiana limited liability company, (iii) Performance Royalty, LLC, a Louisiana limited liability company, (iv) Performance Proppants International, LLC, a Louisiana limited liability company, and (v) Sunny Point Aggregates, LLC, a Louisiana limited liability company (together, “Performance Proppants”) for an aggregate purchase price of $475.0 million, consisting of (x) $469.0 million in cash and (y) a number of shares of Class A Common Stock equal to $6.0 million. A portion of the cash consideration is subject to certain customary post-closing adjustments. Performance Proppants is a frac sand provider in the Haynesville basin.
ESG focus
We are committed to sustainable operations and recognize the importance of ESG principles. As part of our ESG focus, we have established an internal ESG committee with the goal of producing a corporate sustainability report to document our ESG efforts in greater detail.
Customers
Our customers consist primarily of E&P companies in the continental United States. For the year ended December 31, 2022, no individual customer represented more than 10% of our consolidated revenues. For the year ended December 31, 2021, our top three customers individually represented 15%, 10%, and 7% of our consolidated revenues. For the year ended December 31, 2020, our top three customers individually represented 16%, 11%, and 10% of our consolidated revenues. The loss of any of our largest customers could have a material adverse effect on our results of operations.
Seasonality
Historically, our operations have been subject to seasonal factors, and our historical financial results reflect seasonal variations. For example, we have observed a slowdown or pause by our customers around the holiday season in the fourth quarter, some of which may be related to our customers’ annual capital spending budgets. Additionally, our operating results may decline during periods of inclement weather conditions.
Human Capital Management
Our employees are a critical asset and are key to our innovative culture and overall success. We are focused on building upon our high-performance culture by attracting, engaging, developing, retaining and rewarding top talent. We strive to enhance the economic and social well-being of our employees. We are committed to providing a welcoming, inclusive environment for our workforce, with training and career development opportunities to enable employees to thrive and achieve their career goals.
As of December 31, 2022, we employed 3,664 people, none of whom are represented by labor unions or subject to collective bargaining agreements.
Health and Safety. The health, safety, and well-being of our employees is of utmost importance to us. We are an industry leader with a proven track record in safety with a Total Reportable Incident Rate of 0.59 for the year ended December 31, 2022, including our manufacturing division, as compared to the industry average of 0.70, according to the International Association of Oil & Gas Producers.
Employee Welfare and Development. We provide employees the option to participate in health and welfare plans, including medical, dental, life, accidental death and dismemberment and short-term and long-term disability insurance plans. We also offer a number of health and wellness programs, including telemedicine, health screens and fitness reimbursement as well as access to the Employee Assistance Program, which provides employees and their family members access to professional providers to help navigate challenging life events 24 hours a day, 365 days a year.
In response to COVID-19, we adopted enhanced safety measures and practices to protect employee health and safety and continue to follow guidelines from the Centers for Disease Control to protect our employees and minimize the risk of business disruption.
Intellectual Property
USWS has been granted 96 patents worldwide, 60 of which are U.S. patents. These begin to expire in late 2032. USWS has an additional 247 patent applications pending worldwide, 51 of which are U.S. patent applications. Many of these patents were filed in an effort to protect USWS electric fleet technology from being duplicated by competitors. We also use proprietary technology to support our preventative maintenance program and prolong equipment useful life. Although in the aggregate, our trademarks and patents are important to us, we do not regard any single trademark, patent, or group of related trademarks or patents as critical or essential to our business as a whole.
13
Operating Risks and Insurance
Our operations are subject to hazards inherent in the energy services industry, such as accidents, blowouts, explosions, fires and spills and releases that can cause personal injury or loss of life, damage or destruction of property, equipment, natural resources and the environment and suspension of operations.
In addition, claims for loss of oil and natural gas production and damage to formations can occur in the oilfield services industry. If a serious accident were to occur at a location where our equipment and services are being used, it could result in our being named as a defendant in lawsuits asserting large claims.
Because our business involves the transportation of heavy equipment and materials, we may also experience traffic accidents which may result in spills, property damage and personal injury.
Despite what we view as our strong safety record and our efforts to maintain safety standards, we from time to time have suffered accidents in the past and anticipate that we could experience accidents in the future. In addition to the property damage, personal injury and other losses from these accidents, the frequency and severity of these incidents affect our operating costs and insurability and our relationships with customers, employees, regulatory agencies and other parties. Any significant increase in the frequency or severity of these incidents, or the general level of compensation awards, could adversely affect the cost of, or our ability to obtain, workers’ compensation and other forms of insurance, and could have other material adverse effects on our financial condition and results of operations.
We maintain commercial general liability, workers’ compensation, business auto, commercial property, excess liability, and directors and officers insurance policies providing coverage of risks and amounts that we believe to be customary in our industry. Further, we have pollution legal liability coverage for our business entities, which would cover, among other things, third party liability and costs of clean-up relating to environmental contamination on our premises, while our equipment is in transit and while on our customers’ job site. With respect to our hydraulic fracturing operations, coverage would be available under our pollution legal liability policy for any surface environmental clean-up and liability to third parties arising from any surface contamination. We also have certain specific coverage for some of our business segments, including for our hydraulic fracturing services.
Although we maintain insurance coverage of types and amounts that we believe to be customary in the industry, we are not fully insured against all risks, either because insurance is not available or because of the high premium costs relative to perceived risk. Further, insurance rates have in the past been subject to wide fluctuation and changes in coverage could result in less coverage, increases in cost or higher deductibles and retention. Liabilities for which we are not insured, or which exceed the policy limits of our applicable insurance, could have a material adverse effect on our business and financial condition.
Environmental and Occupational Health and Safety Regulations
Our operations are subject to stringent laws and regulations governing the discharge of materials into the environment or otherwise relating to environmental protection, compliance, and occupational health and safety. Numerous federal, state, and local governmental agencies issue regulations that often require difficult and costly compliance measures that could carry substantial administrative, civil, and criminal penalties and may result in injunctive obligations for non-compliance. States have the option of adopting more stringent environmental standards and regulations than are implemented on the federal level. These laws and regulations may, for example, restrict the types, quantities and concentrations of various substances that can be stored, transported, disposed of or released into the environment; limit or prohibit construction or drilling activities on certain lands lying within wilderness, wetlands, ecologically or seismically sensitive areas and other protected areas; or require action to prevent, control, or remediate pollution from current or former operations. Also, these laws and regulations often require permits, authorizations, or licenses that impose operational restrictions and reporting obligations. Moreover, it is not uncommon for neighboring landowners and other third parties to file claims for personal injury and property damage allegedly caused by the release of hazardous substances, hydrocarbons or other waste products into the environment. Changes in environmental, health and safety laws and regulations occur frequently, and any changes that result in more stringent and costly requirements could materially adversely affect our operations and financial position. For example, following political and administrative changes, it is possible that there may be greater environmental, health and safety restrictions, particularly with regards to hydraulic fracturing, permitting, and greenhouse gas (“GHG”) emissions that may affect our operations. We have not experienced any material adverse effect from compliance with current requirements; however, we cannot guarantee this will always be the case.
Below is an overview of some of the more significant environmental, health and safety requirements with which we must comply. Our customers’ operations are subject to similar laws and regulations. Any material adverse effect of these laws and regulations on our customers’ operations and financial position may also have an indirect material adverse effect on our operations and financial position.
14
Waste Handling. We handle, transport, store and dispose of wastes that are subject to the Resource Conservation and Recovery Act (“RCRA”) and comparable state laws and regulations, which affect our activities by imposing requirements regarding the generation, transportation, treatment, storage, disposal and cleanup of hazardous and non-hazardous wastes. With federal approval, the individual states administer some or all of the provisions of the RCRA, sometimes in conjunction with their own, more stringent requirements. Although certain petroleum production wastes are exempt from regulation as hazardous wastes under the RCRA, such wastes may constitute “solid wastes” that are subject to the less stringent requirements of non-hazardous waste provisions.
Administrative, civil and criminal penalties can be imposed for failure to comply with waste handling requirements. Moreover, the EPA or state or local governments may adopt more stringent requirements for the handling of non-hazardous wastes or re-categorize some non-hazardous wastes as “special waste” or hazardous wastes in the future. Indeed, legislation has been proposed from time to time in the U.S. Congress to re-categorize certain oil and natural gas exploration, development and production wastes as hazardous wastes. Several environmental organizations have also at times petitioned the EPA to modify existing regulations to re-categorize certain oil and natural gas exploration, development and production wastes as hazardous. Any such changes in these laws and regulations could have a material adverse effect on our capital expenditures and operating expenses. Although we do not believe the current costs of managing our wastes, as presently classified, to be significant, any legislative or regulatory reclassification of oil and natural gas exploration and production (“E&P”) wastes could increase our costs to manage and dispose of such wastes.
Remediation of Hazardous Substances. The Comprehensive Environmental Response, Compensation and Liability Act (“CERCLA” or “Superfund”) and analogous state laws generally impose liability without regard to fault or legality of the original conduct, on classes of persons who are considered to be responsible for the release of a hazardous substance into the environment. These persons can include the current owner (or lessee) or operator of a contaminated facility, a former owner (or lessee) or operator of the facility at the time of contamination, and those persons that disposed or arranged for the disposal of the hazardous substance at the facility. Liability for the costs of removing or remediating previously disposed wastes or contamination, damages to natural resources, and the costs of conducting certain health studies, among other things, is strict and joint and several. In the course of our operations, we use materials that, if released, could be subject to regulation under CERCLA and comparable state laws. Therefore, governmental agencies or third parties may seek to hold us responsible under CERCLA and comparable state statutes for all or part of the costs to clean up sites at which such hazardous substances have been released. Such liability could require us to engage in expensive litigation to defend the claims, and to allocate our proportionate share of liability, if any. Further, we may need to make significant expenditures to investigate and remediate such contamination or attain and maintain compliance with such laws, which could have a material adverse effect on our results of operations, competitive position or financial condition.
NORM. In the course of our operations, some of our equipment may be exposed to naturally occurring radioactive materials (“NORM”) associated with oil and gas deposits and, accordingly, may result in the generation of wastes and other materials containing NORM. NORM exhibiting levels of radiation in excess of established state standards are subject to special handling and disposal requirements, and any storage vessels, piping and work area affected by NORM may be subject to remediation or restoration requirements.
Some of our operations involve equipment containing regulated radioactive materials that require federal and/or state permits, reporting, testing and proper management practices. Any releases from that equipment may result in liability and/or an obligation to complete remediation and restoration.
Water Discharges. The Clean Water Act (“CWA”), Safe Drinking Water Act (“SDWA”), Oil Pollution Act (“OPA”) and analogous state laws and regulations impose restrictions and strict controls regarding the unauthorized discharge of pollutants, including produced waters and other oil and gas wastes, into regulated waters. The discharge of pollutants into regulated waters is prohibited, except in accordance with the terms of a permit issued by the EPA or the state. Federal and state laws and regulations may also regulate the discharge of stormwater or discharge to groundwater, often necessitating additional permits and design criteria. The discharge of dredge and fill material into regulated waters, including wetlands, is also prohibited, unless authorized by a permit issued by the U.S. Army Corps of Engineers (the “Corps”). The scope of these regulated waters has been subject to controversy in recent years, culminating in the issuance of a revised definition of “waters of the United States” by EPA in December 2022, which exerts federal jurisdiction under the CWA over traditional navigable waters, the territorial seas, interstate waters, as well as upstream water resources that significantly affect those waters. Additionally, many states have similar requirements that apply to state waters where federal jurisdiction ends, and as a result, under most circumstances, discharges of pollutants reaching any permanent waterbodies will likely be regulated.
15
Noncompliance with the CWA, SDWA, OPA, or other laws or regulations relating to water discharges may result in substantial administrative, civil and criminal penalties, as well as injunctive obligations, for us or our customers. The process for obtaining or renewing permits also has the potential to delay operations. Additionally, spill prevention, control and countermeasure plan requirements require appropriate containment berms and similar structures to help prevent the contamination of regulated waters.
Air Emissions. The Clean Air Act (“CAA”) and comparable state laws and regulations, regulate emissions of various air pollutants through the issuance of permits and the imposition of other emissions control requirements. The EPA has developed, and continues to develop, stringent regulations governing emissions of air pollutants from specified sources. New facilities may be required to obtain permits and meet more stringent design criteria before work can begin, and existing facilities may be required to obtain additional permits and incur capital costs in order to remain in compliance. For example, the EPA has established emission control requirements for crude oil and natural gas production and processing operations and established criteria for aggregating multiple small surface sites into a single source for air quality permitting purposes, which could cause small facilities, on an aggregate basis, to be deemed a major source subject to more stringent air permitting processes and requirements. These and other laws and regulations may increase the costs of compliance for some facilities where we operate. Obtaining or renewing permits also has the potential to delay the development of oil and natural gas projects.
Climate Change. Climate change continues to attract considerable public and scientific attention. As a result, numerous proposals have been made and are likely to continue to be made at the international, national, regional and state levels of government to monitor and limit emissions of carbon dioxide, methane and other GHGs. These efforts have included consideration of cap-and-trade programs, carbon taxes, GHG reporting and tracking programs and regulations that directly limit GHG emissions from certain sources.
In the United States, no comprehensive climate change legislation has been implemented at the federal level. However, President Biden has highlighted addressing climate change as a priority of his administration and has issued several executive orders addressing climate change. Moreover, following the U.S. Supreme Court finding that GHG emissions constitute a pollutant under the CAA, the EPA has adopted regulations that, among other things, establish construction and operating permit reviews for GHG emissions from certain large stationary sources, require the monitoring and annual reporting of GHG emissions from certain petroleum and natural gas system sources in the United States, and together with the DOT, set GHG emissions and fuel economy standards for vehicles in the United States. The regulation of methane from oil and gas facilities has been subject to uncertainty in recent years. The EPA previously had promulgated the New Source Performance Standards (“NSPS”), imposing limitations on methane emissions from sources in the oil and gas sector. Subsequently, in September 2020, the Trump Administration rescinded those methane standards and removed the transmission and storage segments from the oil and gas source category under the CAA’s NSPS. However, in June 2021, President Biden signed a resolution passed by the U.S. Congress under the Congressional Review Act nullifying the September 2020 rule, effectively reinstating the prior standards. In November 2021, as required by President Biden’s executive order, the EPA proposed new regulations to expand NSPS requirements for oil and gas sector sources and establish comprehensive standards of performance and emission guidelines for methane and volatile organic compound emissions from existing operations in the oil and gas sector, including the exploration and production, transmission, processing, and storage segments. The EPA published its proposed rule in November 2022 to update, strengthen and expand its November 2021 proposal by reducing emissions of methane and other air pollutants from both new and existing oil and gas operations. The EPA held a public hearing in January 2023 and the comment period closed in February 2023. Once finalized, the regulations are likely to be subject to legal challenge and will also need to be incorporated into the individual state’s implementation plans, which will need to be approved by the EPA in individual rulemakings that could also be subject to legal challenge. The reinstatement of direct regulation of methane emission for new sources and the promulgation of requirements for existing oil and gas customers could result in increased costs for our customers and consequently adversely affect demand for our services.
16
Separately, various states and groups of states have adopted or are considering adopting legislation, regulation or other regulatory initiatives that are focused on such areas as GHG cap and trade programs, carbon taxes, reporting and tracking programs, and restriction of GHG emissions. For example, several states, including Pennsylvania and New Mexico, have proposed or adopted regulations restricting the emission of methane from E&P activities. At the international level, the United Nations-sponsored “Paris Agreement” requires member states to submit non-binding, individually-determined reduction goals known as Nationally Determined Contributions every five years after 2020. President Biden has recommitted the United States to the Paris Agreement and, in April 2021, announced a goal of reducing the United States’ emissions by 50-52% below 2005 levels by 2030. In November 2021, President Biden released “The Long-Term Strategy of the United States: Pathways to Net-Zero Greenhouse Gas Emissions by 2050,” which, among other things, explains that the U.S. and EU are co-leading the “Global Methane Pledge” that aims to cut global methane pollution at least 30% by 2030 relative to 2020 levels. Further, in 2022, the Biden Administration signed the Inflation Reduction Act (“IRA”) that committed to spending approximately $375 billion over a decade, primarily on promoting “clean energy,” in the form of incentives for solar and wind power and electric vehicles. However, the bill calls for new oil and gas leasing on federal lands and in federal waters. In addition, for the first time ever, the IRA imposes a fee on methane emissions from certain facilities, including certain oil and gas facilities but provides for a conditional exemption from the fee if facilities are subject to and are in compliance with EPA methane regulations that are (1) in effect nationwide, and (2) will “result in equivalent or greater emissions reductions as would be achieved” if EPA’s November 2021 proposed rule (“New Source Performance Standards and Emissions Guidelines for Existing Sources from the Oil and Gas Sector”) were finalized as proposed. The full impacts of these orders, pledges, agreements, and any further legislation or regulation promulgated to fulfill the United States’ commitments under these initiatives cannot be predicted at this time.
Governmental, scientific, and public concern over the threat of climate change arising from GHG emissions has resulted in increasing political risks in the United States, including climate change related pledges made by certain candidates now in public office. On January 27, 2021, President Biden issued an executive order that calls for substantial action on climate change, including, among other things, the increased use of zero-emission vehicles by the federal government, the elimination of subsidies provided to the fossil fuel industry, and increased emphasis on climate-related risks across government agencies and economic sectors. The Biden Administration has previously also issued orders suspending the issuance of new leases pending a study, of oil and gas development on federal lands. In addition, in November 2022, the BLM issued a proposed rule to reduce the waste of natural gas from venting, flaring and leaks during oil and gas production activities on federal and American Indian leases. For more information, see our regulatory disclosure below titled “Regulation of Hydraulic Fracturing and Related Activities.” As a result, we cannot predict the full impact of these developments or whether the Biden Administration may pursue further restrictions. Other actions that could be pursued by the Biden Administration may include the imposition of more restrictive requirements for the establishment of pipeline infrastructure or the permitting of LNG export facilities, as well as more restrictive GHG emission limitations for oil and gas facilities.
Additionally, in March 2022, the SEC proposed new rules relating to the disclosure of a range of climate-related risks. At this time, we cannot predict the costs of implementation or any potential adverse impacts resulting from the rule. To the extent this rule is finalized as proposed, we or our customers could incur increased costs related to the assessment and disclosure of climate-related risks. In addition, enhanced climate disclosure requirements could accelerate the trend of certain stakeholders and lenders restricting or seeking more stringent conditions with respect to their investments in certain carbon intensive sectors.
The adoption and implementation of new or more stringent international, federal or state legislation, regulations or other regulatory initiatives that impose more stringent standards for GHG emissions from the oil and natural gas sector or otherwise restrict the areas in which this sector may produce oil and natural gas or generate the GHG emissions could result in increased costs of compliance or costs of consuming, and thereby reduce demand for oil and natural gas, which could reduce demand for our services. Additionally, political, litigation and financial risks may result in our customers restricting or canceling production activities, incurring liability for infrastructure damages as a result of climatic changes, or impairing their ability to continue to operate in an economic manner, which also could reduce the demand for our services. One or more of these developments could have a material adverse effect on our business, financial condition and results of operation.
17
Endangered and Threatened Species. Environmental laws such as the Endangered Species Act (“ESA”) and analogous state laws may impact exploration, development and production activities in areas where we operate. The ESA provides broad protection for species of fish, wildlife and plants that are listed as threatened or endangered. Similar protections are offered to migratory birds under the Migratory Bird Treaty Act (“MBTA”) and various state analogs. The U.S. Fish & Wildlife Service (“FWS”) may identify previously unidentified endangered or threatened species or may designate critical habitat and suitable habitat areas that it believes are necessary for survival of a threatened or endangered species. For example, the dunes sagebrush lizard, which is found only in the active and semi-stable shinnery oak dunes of southeastern New Mexico and adjacent portions of Texas (including areas where our customers operate), was a candidate species for listing under the ESA by the FWS for many years. As a result of a recent settlement with the environmental groups, the FWS, in July 2020, acted on a petition to list the dunes sagebrush lizard finding sufficient information to warrant a formal one-year review to consider listing the species. While the listing review is ongoing, FWS has also developed a conservation agreement that would implement certain protective practices for the species and authorize incidental taking of the species resulting from certain covered activities, including exploration and development of oil and gas fields. The conservation agreement is known as a CCAA. We have joined the CCAA in an effort to mitigate potential impacts on our business of a listing of the dunes sagebrush lizard by the FWS. On February 8, 2022, the FWS issued a notice in the Federal Register requesting comments on a draft amendment to the CCAA. Comments were due on March 11, 2022. At this time the draft amendment is still pending.
On November 25, 2022, the FWS announced that the Northern distinct population segments (“DPS”) of the lesser prairie-chicken meets the definition of a threatened species and that the Southern DPS of the lesser prairie-chicken meets the definition of an endangered species. Therefore, FWS listed them as such and finalized a rule under the ESA, which became effective January 24, 2023. Separately, on July 1, 2021, a lawsuit was filed by conservation groups to overturn a 2019 FWS decision listing the eastern hell bender salamander under the ESA. In October 2021, the Biden administration published two rules that reversed changes made by the Trump administration, namely to the definition of “habitat” and a policy that made it easier to exclude territory from critical habitat. On March 23, 2022, the FWS proposed a rule to redesignate the northern long-eared bat from a threatened species to an endangered species under ESA, and to remove its species-specific rule that excluded most development activities from the ESA’s prohibition on taking listed species. The effective date of the redesignation is March 31, 2023. To the extent any protections are implemented or increased for these or any other species or habitat, it could cause us or our customers to incur additional costs or become subject to operating restrictions or operating bans in the affected areas.
Regulation of Hydraulic Fracturing and Related Activities. Our hydraulic fracturing operations are a significant component of our business. Hydraulic fracturing is an important and common practice that is used to stimulate production of hydrocarbons, particularly natural gas, from tight formations, including shales. The process, which involves the injection of water, sand and chemicals under pressure into formations to fracture the surrounding rock and stimulate production, is typically regulated by state oil and natural gas commissions. Currently, hydraulic fracturing is generally exempt from federal regulation under the Safe Drinking Water Act Underground Injection Control (the “SDWA UIC”) program and is typically regulated by state oil and gas commissions or similar agencies. However, certain federal agencies have increased scrutiny and regulation. For example, in late 2016, the EPA released a final report on the potential impacts of hydraulic fracturing on drinking water resources, concluding that “water cycle” activities associated with hydraulic fracturing may impact drinking water resources under certain limited circumstances. To date, the EPA has taken no further action in response to the 2016 report. Additionally, the EPA has asserted regulatory authority pursuant to the SDWA UIC program over hydraulic fracturing activities involving the use of diesel fuel in the fracturing fluid and issued guidance for such activities. The EPA also previously issued a series of rules under the CAA that establish new emission control requirements for certain oil and natural gas production and natural gas processing operations and associated equipment. The U.S. Bureau of Land Management (the “BLM”) also finalized rules to impose new or more stringent standards for performing hydraulic fracturing on federal and American Indian lands. While this regulation was subsequently rescinded in December 2017, which rescission was upheld by the District Court of Northern California, litigation is ongoing. Additionally, the Biden Administration may seek to revisit these regulations. Separately, the Biden Administration may also pursue further restriction of hydraulic fracturing and other oil and gas development on federal lands. For example, on January 27, 2021, President Biden issued an executive order that, among other things, called for the elimination of fossil fuel subsidies from federal budget requests beginning in 2022 and suspended the issuance of new leases for oil and gas development on federal lands to the extent permitted by law and called for a review of existing leasing and permitting practices for such activities on federal lands (the order clarifies that it does not restrict such operations on tribal lands that the federal government merely holds in trust). In addition, in November 2022, the BLM issued a proposed rule to reduce the waste of natural gas from venting, flaring and leaks during oil and gas production activities on federal and American Indian leases.
18
In response to President Biden’s executive order, the Department of Interior issued a report recommending various changes to the federal leasing program, though many such changes would require Congressional action. However, legal challenges to this suspension are ongoing, and the District Court for the Western District of Louisiana has issued a preliminary injunction against the implementation of this suspension while such challenges are pending. The Biden Administration has appealed the injunction, but is complying with the injunction during the appeals process. Separately, the state of Louisiana, among other states, have challenged the Biden Administration’s use of the social cost of carbon in its decision-making, including federal leasing decisions, resulting in an injunction from the Western District of Louisiana preventing the Biden Administration’s use of the social cost of carbon. In response, the Biden Administration again halted leasing activities. However, the Fifth Circuit Court of Appeals has overturned the lower court’s decision, and the plaintiff states sought review by the Supreme Court, which declined to vacate the Fifth Circuit’s order. On April 15, 2022, the Department of the Interior announced that it would again resume leasing on federal lands, though with significant changes to the program, including an 80% reduction in the number of acres nominated and the first-ever increase in onshore royalties, to 18.7% from 12.5%. Separately, there has been a significant reduction in the number of approvals of applications for permits to drill on federal lands in 2022. However, in 2022, the IRA conditioned issuance of wind and solar rights-of-way on new oil and gas lease sales on federal land. There remains a significant uncertainty and increased regulatory risks and costs relating to onshore oil and gas exploration and production activities. These issues could result in decreased activity on federal land, adversely impacting demand for our services.
As a result, we cannot predict the final scope of regulations or restrictions that may apply to oil and gas operations on federal lands, nor the outcome of pending litigation. Although the executive order does not apply to existing operations under valid leases, ProFrac cannot guarantee that further action will not be taken to curtail oil and gas development on federal lands. Any restrictions for new or existing production activities on federal land could adversely impact our customer’s operations and consequently reduce demand for our services. The increase in royalties associated with leasing on federal lands, and any future increases that may occur, may adversely impact exploration and production activities on federal lands and reduce demand for our services. Further, legislation to amend the SDWA to repeal the exemption for hydraulic fracturing (except when diesel fuels are used) from the definition of “underground injection” and require federal permitting and regulatory control of hydraulic fracturing, as well as legislative proposals to require disclosure of the chemical constituents of the fluids used in the fracturing process, have previously been proposed in Congress. Several states and local jurisdictions in which we or our customers operate also have adopted or are considering adopting regulations that could restrict or prohibit hydraulic fracturing in certain circumstances, impose more stringent operating standards and/or require the disclosure of the composition of hydraulic fracturing fluids.
Federal and state governments have also investigated whether the disposal of produced water into underground injection wells has caused increased seismic activity in certain areas. In response to concerns regarding induced seismicity, regulators in some states have imposed, or are considering imposing, additional requirements in the permitting of produced water disposal wells or otherwise to assess any relationship between seismicity and the use of such wells. For example, Oklahoma has issued rules for wastewater disposal wells that impose permitting and operating restrictions and reporting requirements on disposal wells in proximity to faults and also, from time to time, has implemented plans directing certain wells where seismic incidents have occurred to restrict or suspend disposal well operations. In particular, the Oklahoma Corporation Commission’s well completion seismicity guidelines for operators in the South Central Oklahoma Oil Province (“SCOOP”) and the Sooner Trend (oil field), Anadarko (basin) and Canadian and Kingfisher (countries) (“STACK”) require hydraulic fracturing operations to be suspended following earthquakes of certain magnitudes in the vicinity. In addition, the Oklahoma Corporation Commission’s Oil and Gas Conservation Division has previously issued an order limiting future increases in the volume of oil and natural gas wastewater injected into the ground in an effort to reduce the number of earthquakes in the state. The Texas Railroad Commission has adopted similar rules.
If new laws or regulations that significantly restrict hydraulic fracturing and related activities are adopted, such laws could make it more difficult or costly to perform fracturing to stimulate production from tight formations. In addition, if hydraulic fracturing is further regulated at the federal or state level, fracturing activities could become subject to additional permitting and financial assurance requirements, more stringent construction specifications, increased monitoring, reporting and record keeping obligations, plugging and abandonment requirements and also to attendant permitting delays and potential increases in costs. Such legislative changes could cause us to incur substantial compliance costs, and compliance or the consequences of any failure to comply could have a material adverse effect on our financial condition and results of operations.
19
OSHA Matters. The Occupational Safety and Health Act (“OSHA”) and comparable state statutes regulate the protection of the health and safety of workers. In addition, the OSHA hazard communication standard requires that information be maintained about hazardous materials used or produced in operations and that this information be provided to employees, state and local government authorities and the public. In March 2016, the U.S. Occupational Safety and Health Administration issued a final rule to impose stricter standards for worker exposure to silica; our sand mining operations are subject to this rule and, moreover, the rule went into effect on June 23, 2021 for hydraulic fracturing activities. As a result, we or our customers may be required to incur additional costs associated with compliance with these standards, which costs may be material.
Mining Activities. Our sand mining operations are subject to the oversight of the U.S. Mine Safety and Health Administration (“MSHA”), which is the primary regulatory agency with jurisdiction over the commercial silica industry. MSHA regulates quarries, surface mines, underground mines, and the industrial mineral processing facilities associated with quarries and mines. In June 2022, the MSHA launched a new enforcement initiative to better protect miners in the United States from health hazards resulting from repeated overexposure to respirable crystalline silica. MSHA administers and enforces the provisions of the Federal Mine Safety and Health Act of 1977 (“FMSHA”), as amended by the Mine Improvement and New Emergency Response Act of 2006. FMSHA imposes stringent health and safety standards on numerous aspects of our operations inclusive of mineral extraction and processing operations, transportation and transloading of silica and delivery of silica sand to well sites. These standards include, among others, the training of personnel, operating procedures, operating and safety equipment, and other matters. As part of MSHA’s oversight, its representatives must perform at least two unannounced inspections annually for each surface mining facility in its jurisdiction.
Availability of Information
Our website is located at http://www.pfholdingscorp.com. Our Annual Report on Form 10-K, Quarterly Reports on Form 10-Q, Current Reports on Form 8-K and other reports and filings with the SEC are available free of charge on our website as soon as reasonably practicable after the reports are filed with or furnished to the SEC. Information contained on our website is not incorporated into this Annual Report or on our other filings with the SEC. Our filings are also available in hard copy, free of charge, by contacting us at 333 Shops Boulevard, Suite 301, Willow Park, Texas 76087, Attention: Investor Relations, telephone: (254) 776-3722. The SEC also maintains a website (www.sec.gov) that contains reports, proxy and information statements and other information regarding issuers that file electronically with the SEC. Additionally, we make available free of charge on our website:
Item 1A. Risk Factors.
We face various risks and uncertainties in the industry in which we operate and in the course of our business. Investors in our securities should carefully consider the following risk factors and all of the other information set forth or incorporated into this Annual Report. Additional risks and uncertainties not currently known to us, or that we currently deem immaterial, may also adversely affect our business, financial condition, results of operations, or cash flows.
Risks Related to our Growth Strategy
To achieve our growth and vertical integration objectives, our management relies on a rapid succession of strategic acquisitions, investments and procurement arrangements the pace and scope of which may have the potential to adversely affect the day-to-day operation of our business, and our cash flows, financial condition and results of operations.
Since the beginning of 2022, before the May 17th closing of our initial public offering and the start of trading of our Class A Common Stock on the Nasdaq Global Select Market (“Nasdaq”), we have aggressively pursued our growth and vertical integration strategies through a series of acquisitions, investments and procurement arrangements that increased our total assets from $664.6 million at December 31, 2021, to $2.9 billion at the end of fiscal year 2022. As explained in greater detail under Item 1 (Business) above, these acquisitions, investments and transactions include:
20
In addition, in December 2022 we also announced our agreements to acquire Producers and Performance Proppants for approximately $35.0 million and $475.0 million, respectively, in total consideration value. Both transactions are now closed.
For a company of our size and resources, the pace and volume of the deal-making activity described above may create risks and uncertainties that can have a material adverse effect on the daily conduct of our business, and negatively impact our cash flows, financial condition and results of operations. For example, we are exposed to the risk that the day-to-day management, oversight, and operation of our business and our financial results may be adversely affected by:
In addition, because the historical utilization rates of any acquired assets may be lower than ours in recent periods, our utilization ratio could decrease during the course of an initial integration period. Accordingly, there can be no assurance the utilization for acquired assets will align with the utilization of our existing fleet or on our anticipated timeline or at all.
We have incurred and will continue to incur substantial indebtedness to finance acquisitions. We have also issued equity and may issue additional equity, or convertible securities in connection with such acquisitions. Debt service requirements could represent a significant burden on our results of operations and financial condition, and the issuance of additional equity or convertible securities could be dilutive to our existing shareholders.
Our growth and vertical integration objectives require substantial capital that we may be unable to obtain, or may only obtain at a cost or under terms that adversely affect our cash flows, financial condition and results of operations.
We have historically financed capital expenditures primarily with cash generated by operations, equipment and vendor financing, and borrowings under our credit facilities and other debt financing. As of the date of this annual report, however, the continued reliability of our traditional sources of funding has to be questioned. Any further disruptions or continuing volatility in the global financial markets (including as a result of a potential U.S. government default) may lead to additional increases in interest rates, or to a contraction in credit availability that could impair our ability to finance our operations and acquisitions. In the event our capital expenditure requirements at any time are greater than the amounts then available to us, we may not be able to obtain funding from such alternative sources of capital, and may be required to curtail or eliminate contemplated activities. Even if we can obtain capital from alternative sources, the terms of such fundings may not be favorable to us. In particular, the terms of any debt financing may include covenants that significantly restrict our operations. Our inability to grow as planned may reduce our chances of maintaining and improving profitability.
We may have difficulty managing growth in our business, which could adversely affect our financial condition and results of operations.
Growth in accordance with our business strategy, if achieved, could place a significant strain on our financial, operational and management resources. As we expand the scope of our activities and our geographic coverage through both organic growth and acquisitions, there will be additional demands on our financial, legal, accounting, technical, operational and management resources. The failure to continue to upgrade our technical, administrative, operating and financial control systems or the occurrence of unexpected expansion difficulties, including the failure to recruit and retain experienced managers and other professionals, could have a material adverse effect on our business, liquidity positions, financial condition, results of operations and prospects and our ability to successfully or timely execute our business strategy.
We may experience difficulties in integrating acquired assets into our business and in realizing the expected benefits of an acquisition.
The success of an acquisition, if achieved, will depend in part on our ability to realize anticipated business opportunities and benefits from combining the acquired assets with our business in an effective and efficient manner. The integration process could take longer than anticipated and could result in the loss of key employees, the disruption of each company’s ongoing businesses, tax costs or inefficiencies or inconsistencies in standards, controls, information technology systems, procedures and policies, any of which could adversely affect our ability to maintain relationships with customers, employees or third parties or our ability to achieve the anticipated benefits, and could harm our financial performance. If we are unable to successfully or timely integrate acquired assets with our business, we may incur unanticipated liabilities and be unable to realize the anticipated benefits, and our business, results of operations and financial condition could be materially and adversely affected.
21
Our indebtedness and liquidity needs could restrict our operations and make us more vulnerable to adverse economic conditions.
Our existing and future indebtedness, whether incurred in connection with acquisitions, operations or otherwise, and limited access to liquidity may adversely affect our operations and limit our growth, and we may have difficulty making debt service payments on such indebtedness as payments become due. Our level of indebtedness may affect our operations in several ways, including:
In addition, any failure to comply with the financial or other debt covenants could result in an event of default, which could result in some or all of our indebtedness becoming immediately due and payable. That occurrence would substantially and adversely affect our ability to continue operating our business and would severely and adversely affect our cash flows and financial condition and results.
We may not be able to generate sufficient cash flow to service all of our obligations, including our obligations under our credit and other financing facilities.
Our ability to make payments on and to upsize our current facilities, refinance any of our outstanding indebtedness, and obtain additional financing, and to fund planned capital expenditures, strategic transactions and expansion efforts will depend on our ability to generate cash in the future. This, to a certain extent, is subject to general economic, financial, competitive, legislative, regulatory and other factors that are beyond our control.
Our business may not be able to generate sufficient cash flows from operations, and there is no assurance that future borrowings will be available to us in amounts sufficient to enable us to make payments due on our indebtedness and to fund our other liquidity needs. If this is the case, we will need to refinance all or a portion of our indebtedness on or before maturity, and we cannot assure that we will be able to refinance any of our indebtedness in a timely manner, on commercially reasonable terms, or at all. We may need to implement one or more alternatives, such as reducing or delaying planned expenses and capital expenditures, selling assets, restructuring debt, or obtaining additional equity or debt financing. These financing strategies may not be executed on satisfactory terms, if at all. Our ability to upsize our current facilities, refinance our indebtedness or obtain additional financing, and to do so on commercially reasonable terms, will depend on, among other things, our financial condition at the time, restrictions in agreements governing our indebtedness, and other factors, including the condition of the financial markets and the markets in which we will compete.
If we do not generate sufficient cash flows from operations, and additional borrowings, refinancings or proceeds of asset sales are not available to us, we may not have sufficient cash to enable us to meet all of our obligations.
Risks Related to our Business
Our business and financial performance depends on the level of capital spending by oil and gas companies operating within the areas we service.
Demand for our services depends on the level of capital expenditures in the United States by companies in the oil and natural gas industry. A prolonged reduction in oil and gas prices would generally depress the level of oil and natural gas exploration, development, production, and well completion activity and would result in a corresponding decline in the demand for the hydraulic fracturing services that we provide. For example, the significant decline in oil and natural gas prices that followed the outset of the COVID pandemic in 2020 caused a reduction in our customers’ spending and associated drilling and completion activities, all of which had an adverse effect on our revenue. While oil and natural gas prices have since increased, should prices decline again, similar declines in our customers’ spending would have an adverse effect on our revenue.
Numerous factors beyond our control affect our customers’ decisions regarding their level of exploration and production activity at any given time and, therefore, have an impact on the level of demand for our services at such time, including:
22
These factors, together with the historical tendency of oil and gas companies to increase production in response to price increases, which typically leads to overproduction and a collapse in prices, have often contributed to the volatility of the energy markets and the cyclical nature of the energy business. Accordingly, it would be unwise for anyone to expect the recent recovery of the sector to be of unlimited duration, or to disregard the likelihood (even certainty) of turbulent times in the foreseeable future.
Our business depends upon our ability to obtain specialized equipment, parts and key raw materials from third-party suppliers, and we may be vulnerable to delayed deliveries and future price increases.
While we operate a vertically integrated business, each of our segments relies on specialized equipment, parts and raw materials supplied by third parties and affiliates. At times during the commodity price cycle, there is a high demand for hydraulic fracturing and other oilfield services and extended lead times to obtain equipment and raw materials needed to provide stimulation services. Similarly, our manufacturing business relies on a limited number of suppliers for major equipment to build our new electric-powered hydraulic fracturing fleets utilizing Clean Fleet® technology.
Should our current suppliers be unable or unwilling to provide the necessary equipment, parts or raw materials or otherwise fail to deliver the products timely and in the quantities required, any resulting delays in the provision of our services, or in the time needed to upgrade our fleet, could have a material adverse effect on our business, financial condition, results of operations and cash flows.
In addition, future price increases for the equipment, parts and raw materials we purchase from others could negatively impact our ability to update or expand our existing fleets, to timely repair equipment in our existing fleets or meet the demands of our customers.
Our reliance upon a few large customers may adversely affect our revenue and operating results.
The majority of our revenue is generated from the provision of hydraulic fracturing services to a discrete number of recurring customers. During the fiscal years ended on December 31, 2022, 2021 and 2020, our top ten customers represented, respectively, 35%, 63% and 70% of our consolidated revenues. Similarly, USWS, our recently acquired company, reported that for its fiscal years ended on December 31, 2021 and 2020, each of three and five customers, respectively, accounted for greater than 10.0% of its total consolidated revenues.
It is likely that we will depend on a relatively small number of customers for a significant portion of our revenue in the future. If a major customer fails to pay us, cash flow from operations would be impacted and our operating results and financial condition could be harmed. Additionally, if we were to lose any material customer, we may not be able to redeploy our equipment at similar utilization or pricing levels and such loss could have an adverse effect on our business until the equipment is redeployed at similar utilization or pricing levels.
Oil and natural gas companies’ operations using hydraulic fracturing are substantially dependent on the availability of water. Restrictions on the ability to obtain water for E&P activities and the disposal of flowback and produced water may impact their operations and have a corresponding adverse effect on our business, results of operations and financial condition.
Water is an essential component of shale oil and natural gas production during both the drilling and hydraulic fracturing processes. Our oil and natural gas producing customers’ access to water to be used in these processes may be adversely affected due to reasons such as periods of extended drought, privatization, third party competition for water in localized areas or the implementation of local or state governmental programs to monitor or restrict the beneficial use of water subject to their jurisdiction for hydraulic fracturing to assure adequate local water supplies. The occurrence of these or similar developments may result in limitations being placed on allocations of water due to needs by third party businesses with more senior contractual or permitting rights to the water. Our customers’ inability to locate or contractually acquire and sustain the receipt of sufficient amounts of water could adversely impact their E&P operations and have a corresponding adverse effect on our business, results of operations and financial condition.
23
Moreover, the imposition of new environmental regulations and other regulatory initiatives could include increased restrictions on our producing customers’ ability to dispose of flowback and produced water generated by hydraulic fracturing or other fluids resulting from E&P activities. Applicable laws impose restrictions and strict controls regarding the discharge of pollutants into waters of the United States and require that permits or other approvals be obtained to discharge pollutants to such waters. Additionally, regulations implemented under both federal and state laws prohibit the discharge of produced water and sand, drilling fluids, drill cuttings and certain other substances related to the natural gas and oil industry into coastal waters. These laws provide for civil, criminal and administrative penalties for any unauthorized discharges of pollutants and unauthorized discharges of reportable quantities of oil and hazardous substances. Compliance with current and future environmental regulations and permit requirements governing the withdrawal, storage and use of surface water or groundwater necessary for hydraulic fracturing of wells and any inability to secure transportation and access to disposal wells with sufficient capacity to accept all of our flowback and produced water on economic terms may increase our customers’ operating costs and could result in restrictions, delays, or cancellations of our customers’ operations, the extent of which cannot be predicted.
Our operations are subject to unforeseen interruptions and hazards inherent in the oil and natural gas industry, for which we may not be adequately insured, and which could cause us to lose customers and substantial revenue.
Our operations are exposed to the risks inherent to our industry, such as equipment defects, vehicle accidents, fires, explosions, blowouts, surface cratering, uncontrollable flows of gas or well fluids, pipe or pipeline failures, abnormally pressured formations and various environmental hazards, such as oil spills and releases of, and exposure to, hazardous substances (including fracturing fluids, and chemical additives). In addition, our operations are exposed to potential natural disasters, such as blizzards, tornadoes, storms, floods, other adverse weather conditions and earthquakes. The occurrence of any of these events could result in substantial losses to us due to injury or loss of life, severe damage to or destruction of property, natural resources and equipment, pollution or other environmental damage, clean-up responsibilities, regulatory investigations and penalties or other damage resulting in curtailment or suspension of our operations. The cost of managing such risks may be significant. The frequency and severity of such incidents will affect operating costs, insurability and relationships with customers, employees and regulators.
Our insurance may not be adequate to cover all losses or liabilities we may suffer. Furthermore, we may be unable to maintain or obtain insurance of the type and amount we desire at reasonable rates. As a result of market conditions, premiums and deductibles for certain of our insurance policies have increased and could escalate further. In addition, sub-limits have been imposed for certain risks. In some instances, certain insurance could become unavailable or available only for reduced amounts of coverage. If we were to incur a significant liability for which we are not fully insured, it could have a material adverse effect on our business, results of operations and financial condition. In addition, we may not be able to secure additional insurance or bonding that might be required by new governmental regulations. This may cause us to restrict our operations, which might severely impact our financial position.
Since hydraulic fracturing activities are part of our operations, they are covered by our insurance against claims made for bodily injury, property damage and clean-up costs stemming from a sudden and accidental pollution event. However, we may not have coverage if we are unaware of the pollution event and unable to report the “occurrence” to our insurance company within the time frame required under our insurance policy. In addition, these policies do not provide coverage for all liabilities, and the insurance coverage may not be adequate to cover claims that may arise, or we may not be able to maintain adequate insurance at rates we consider reasonable. A loss not fully covered by insurance could have a material adverse effect on our financial position, results of operations and cash flows.
We rely on a few key employees whose absence or loss could adversely affect our business.
Many key responsibilities within our business have been assigned to a small number of employees. The loss of their services could adversely affect our business. In particular, the loss of the services of one or more members of our executive team, including our Chief Executive Officer, Executive Chairman, Chief Operating Officer, Chief Legal Officer and Chief Financial Officer, could disrupt our operations. We do not maintain “key person” life insurance policies on any of our employees. As a result, we are not insured against any losses resulting from the death of our key employees.
24
Inaccuracies in our estimates of mineral reserves and resource deposits, or deficiencies in our title to those deposits, could result in our inability to mine the deposits or require us to pay higher than expected costs.
We base our mineral reserve and resource estimates on engineering, economic and geological data assembled and analyzed by our mining engineers, which are reviewed periodically by outside firms. However, commercial silica reserve estimates are necessarily imprecise and depend to some extent on statistical inferences drawn from available drilling data, which may prove unreliable. There are numerous uncertainties inherent in estimating quantities and qualities of commercial silica reserves and non-reserve commercial silica deposits and costs to mine recoverable reserves, many of which are beyond our control and any of which could cause actual results to differ materially from our expectations. These uncertainties include:
In addition, title to, and the area of, mineral properties and water rights may also be disputed. Mineral properties sometimes contain claims or transfer histories that examiners cannot verify. A successful claim that we do not have title to one or more of our properties or lack appropriate water rights could cause us to lose any rights to explore, develop and extract any minerals on that property, without compensation for our prior expenditures relating to such property. Any inaccuracy in our estimates related to our mineral reserves and non-reserve mineral deposits, or our title to such deposits, could result in our inability to mine the deposits or require us to pay higher than expected costs.
Additionally, a portion of our Alpine reserves are located on approximately 630 acres that we lease pursuant to a lease that terminates in 2052 and requires that we commence production from the leased premises by January 1, 2032. If we do not commence mining activities by January 1, 2032, our lease of this property would terminate and we would lose our interest in these reserves.
We may be subject to claims for personal injury and property damage, which could materially adversely affect our financial condition and results of operations.
We operate with most of our customers under master service agreements (“MSAs”). We endeavor to allocate potential liabilities and risks between the parties in the MSAs. Generally, under our MSAs, including those relating to our hydraulic fracturing services, we assume responsibility for, including control and removal of, pollution or contamination which originates above surface and originates from our equipment or services. Our customer typically assumes responsibility for, including control and removal of, all other pollution or contamination which may occur during operations, including that which may result from seepage or any other uncontrolled flow of drilling fluids occurring below grade. We may have liability in such cases to the extent we were found to be grossly negligent or having committed willful acts. Generally, our customers also agree to indemnify us against claims arising from their employees’ personal injury or death to the extent that, in the case of our hydraulic fracturing operations, their employees are injured or their properties are damaged by such operations, unless resulting from our gross negligence or willful misconduct. Similarly, we generally agree to indemnify our customers for liabilities arising from personal injury to or death of any of our employees, unless resulting from gross negligence or willful misconduct of the customer. In addition, our customers generally agree to indemnify us for loss or destruction of customer-owned property or equipment and in turn, we agree to indemnify our customers for loss or destruction of property or equipment we own. This reciprocal or mirrored indemnity and risk allocation model is known as knock for knock indemnity and is common in oilfield services agreements. Losses due to catastrophic events, such as blowouts, are generally the responsibility of the customer. However, despite this general allocation of risk, we might not succeed in enforcing such contractual allocation, might incur an unforeseen liability falling outside the scope of such allocation or may be required to enter into an MSA with terms that vary from the above allocations of risk. Litigation arising from a catastrophic occurrence at a location where our equipment and services are being used may result in ProFrac being named as a defendant in lawsuits asserting large claims. As a result, we may incur substantial losses which could materially and adversely affect our financial condition and results of operation.
If we are unable to fully protect our intellectual property rights, we may suffer a loss in our competitive advantage or market share.
If we are not able to protect our patents or maintain the confidentiality of our trade secrets, or if our competitors are able to replicate our technology or services, our competitive advantage would be diminished. We also cannot ensure that any patents we currently own or may obtain in the future would provide us with any significant commercial benefit or would allow us to prevent our competitors from employing comparable technologies or processes.
25
If we fail to respond to our customers’ growing demand for environmentally sensitive equipment, our business will be adversely affected.
As our customers have become more focused on the reductions of their emissions footprint, we have introduced products and services (such as our electric-powered hydraulic fracturing fleets) to meet their needs. However, as of December 31, 2022, only 22.0% of our pumps rely on electric frac or Tier IV DGB technology (which we consider to be the most environmentally friendly currently available technologies used in our industry). In addition to being less attractive to customers, the legacy portion of our fleet is less efficient, and often requires additional maintenance and capital expenditures to be kept in good operating condition and may, therefore, be subject to longer or more frequent periods of unavailability.
If we fail to upgrade and replace our fleet with the higher efficiency and more environmentally friendly equipment the industry increasingly demands, our competitive position will deteriorate, which may have a material adverse effect on our financial position, results of operations and cash flows.
Our financial results may be materially adversely affected by the inclusion of Flotek’s financial statements in our consolidated financial statements, and we do not have the benefit of Flotek’s cash or liquidity.
Due to our determination that Flotek is a variable interest entity of which ProFrac is the primary beneficiary, Flotek’s financial statements have been included in our consolidated financial statements from May 17, 2022. Consequently, our financial results may be materially adversely affected if Flotek reports poor or worsened financial results. Any delays in Flotek’s reporting of its financial results or material inaccuracies in Flotek’s financial statements could negatively impact ProFrac’s ability to timely or accurately report its financial results. In addition, we do not have the ability to access or deploy Flotek’s cash or liquidity in our operations, which may limit our ability to mitigate the impact of the inclusion of Flotek’s financial statements in our consolidated financial statements.
Risks Related to Environmental and Regulatory Matters
Our operations and the operations of our customers are subject to environmental, health and safety laws and regulations, and future compliance, claims, and liabilities relating to such matters may have a material adverse effect on our results of operations, financial position or cash flows.
The nature of our operations and those of our customers, including our pressure pumping operations and the handling, transporting and disposing of a variety of fluids and substances, including hydraulic fracturing fluids and other regulated substances, air emissions, and wastewater, stormwater, and groundwater discharges exposes us and our customers to some risk of environmental liability, including the release of pollutants from oil and natural gas wells and associated equipment to the environment. We are also subject to laws and regulations associated with sand mining and equipment manufacturing operations, including the processing, and the related storage, handling, transportation and disposal of raw materials, products and wastes. The cost of compliance with these laws can be significant.
Under these laws and regulations, we may become liable for penalties, damages or costs of remediation or other corrective measures.
Failure to properly handle, transport or dispose of these materials or otherwise conduct our operations in accordance with these and other environmental, health and safety laws, permits, and authorizations could expose us to substantial liability for administrative, civil and criminal penalties, cleanup and site restoration costs and liability associated with releases of such materials, damages to natural resources and other damages, as well as potentially impair our ability to conduct our operations. Such liability is commonly on a strict, joint and several liability basis, without regard to fault or negligence. Liability may be imposed as a result of our conduct that was lawful at the time it occurred or the conduct of, or conditions caused by, prior operators or other third parties. Governmental agencies, citizen organizations, neighboring landowners and other third parties may file claims against us for personal injury or property damage allegedly caused by the release of pollutants into the environment. Costs associated with defending against these claims and any actual liabilities could impact our profitability.
Changes in laws or government regulations could increase our costs of doing business.
Environmental, health and safety laws and regulations are constantly evolving, and they may change in the future and become more stringent. Current and future claims and liabilities may have a material adverse effect on us because of potential adverse outcomes, defense costs, diversion of management resources, unavailability of insurance coverage and other factors. The ultimate costs of these liabilities are difficult to determine and may exceed any reserves we may have established. If existing environmental, health and safety requirements or enforcement policies change, we may be required to make significant unanticipated capital and operating expenditures.
26
New and existing regulatory disclosure requirements may implicate our trade secrets and cause us competitive harm if such trade secrets become public.
Many states in which we operate require the disclosure of some or all the chemicals used in our pressure pumping operations. Certain aspects of one or more of these chemicals may be considered proprietary by us or our chemical suppliers. Disclosure of our proprietary chemical information to third parties or to the public, even if inadvertent, could diminish the value of our trade secrets or those of our chemical suppliers and could result in competitive harm to us, which could have an adverse impact on our business, financial condition, prospects and results of operations.
Supply chain issues, moratoriums, and increased regulatory requirements on our suppliers may impact the cost and availability of raw materials necessary to our operations.
Our business could be affected by moratoriums or increased regulation of other companies in the supply chain, such as sand mining by our proppant suppliers, or our chemical suppliers, which could limit our access to supplies and increase the costs of raw materials. At this time, it is not possible to estimate how these various restrictions could affect our ongoing operations.
Our operations, and those of our customers, are subject to a series of risks arising from climate change, which ultimately may result in increased GHG regulation, decreased demand for fossil fuels, and fewer oil and gas permits and licenses, all of which may affect our operations and profitability.
Climate change continues to attract considerable public and scientific attention. As a result, numerous proposals have been made and are likely to continue to be made at the international, national, regional and state levels of government to monitor and limit emissions of carbon dioxide, methane and other GHGs. These efforts have included significant public investment in zero-carbon energy production and storage, consideration of cap-and-trade programs, carbon taxes, GHG reporting and tracking programs and regulations that directly limit GHG emissions from certain sources. The risk of these continued efforts to drive down carbon emissions may result in reduced business opportunities and profitability.
As a result of increased attention to combating climate change, various governmental and non-governmental groups have pledged to achieve reductions to GHG emissions. One recent development in this area, the 2022 IRA, discussed above, involves significant investment over the next 10 years into solar and wind energy production and battery storage infrastructure in an effort to reduce U.S. GHGs to about 40 percent lower than 2005 levels by 2030. Such significant public investment in non-fossil fuel energy production may reduce demand for traditional fossil fuel electricity production which could negatively impact prices of natural gas and profitability of our operations.
The regulation of methane from oil and gas facilities stands to become more restrictive under the current federal administration. The EPA already imposes limitations on methane emissions from new sources in the oil and gas sector through NSPS and the EPA’s November 2022 proposed rule seeks to further reduce emissions of methane and other air pollutants from both new and existing oil and gas operations. Such regulation of methane emission for new sources and the promulgation of further requirements for existing oil and gas customers could result in increased operational costs and adversely affect demand for our services. The complete impacts of these pledges, investments, agreements, and the legislation or regulation promulgated to fulfill the United States’ commitments to reduce GHG emissions, cannot be predicted at this time. Additionally, we cannot predict any future reductions and restrictions beyond what is currently proposed.
Litigation risks are also increasing as a number of entities have sought to bring suit against various oil and natural gas companies in state or federal court, alleging among other things, that such companies created public nuisances by producing fuels that contributed to climate change or alleging that the companies have been aware of the adverse effects of climate change for some time but defrauded their investors or customers by failing to adequately disclose those impacts.
There are also increasing financial risks for fossil fuel producers as shareholders currently invested in fossil-fuel energy companies may elect in the future to shift some or all of their investments into non-fossil fuel related sectors. Institutional lenders who provide financing to fossil fuel energy companies also have become more attentive to sustainable lending practices and some of them may elect not to provide funding for fossil fuel energy companies. There is also a risk that financial institutions will be required to adopt policies that have the effect of reducing the funding provided to the fossil fuel sector. In 2021, President Biden signed an executive order calling for the development of a “climate finance plan” and, separately, the Federal Reserve announced that it had joined the Network for Greening the Financial System, a consortium of financial regulators focused on addressing climate-related risks in the financial sector. Limitation of investments in and financing for fossil fuel energy companies could result in the restriction, delay or cancellation of drilling programs or development or production activities. Enhanced climate disclosure requirements could accelerate the trend of certain stakeholders and lenders restricting or seeking more stringent conditions with respect to their investments in certain carbon intensive sectors.
27
Additionally, political, litigation and financial risks may result in our customers restricting or canceling production activities, incurring liability for infrastructure damages as a result of climatic changes, or impairing their ability to continue to operate in an economic manner, which also could reduce the demand for our services. One or more of these developments could have a material adverse effect on our business, financial condition and results of operation.
Finally, many scientists have concluded that increasing concentrations of GHG in the atmosphere may produce climate changes that have significant physical effects, such as increased frequency and severity of storms, droughts, and floods and other climate events that could have an adverse effect on our customers’ operations.
Federal, state, and local legislative and regulatory initiatives relating to hydraulic fracturing, as well as governmental reviews and investment practices for such activities, may serve to limit future oil and natural gas E&P activities and could have a material adverse effect on our results of operations and business.
Various federal, state and local legislative and regulatory initiatives have been, or could be undertaken which could result in additional requirements or restrictions being imposed on hydraulic fracturing operations. As discussed above, hydraulic fracturing is generally exempt from federal regulation under the SDWA UIC program and is typically regulated by state oil and gas commissions or similar agencies. However, certain federal agencies have increased scrutiny and regulation. Increased federal regulation of fracking operations would likely lead to increased compliance costs and a higher probability of enforcement actions and litigation.
Many states and local governments have also adopted regulations that impose more stringent permitting, disclosure, disposal and well-construction requirements on hydraulic fracturing operations, including states where we or our customers operate, such as Texas, Colorado and North Dakota. States could also elect to place prohibitions on hydraulic fracturing, as several states have already done. In addition, some states have adopted broader sets of requirements related to oil and gas development more generally that could impact hydraulic fracturing activities. Separately, state and federal regulatory agencies have at times focused on a possible connection between hydraulic fracturing related activities, including the underground injection of wastewater into disposal wells, and the increased occurrence of seismic activity. Regulators in some states have imposed, or are considering imposing, additional requirements in the permitting of produced water disposal wells or otherwise to assess any relationship between seismicity and the use of such wells. To the extent any new regulations are adopted to restrict hydraulic fracturing activities or the disposal of fluids associated with such activities, it may adversely affect our customers and, as a result, demand for our services.
Increased regulation and attention given to the hydraulic fracturing process could lead to greater opposition to, and litigation concerning, oil and natural gas production activities using hydraulic fracturing techniques. Additional legislation or regulation could also lead to operational delays for our customers or increased operating costs in the production of oil and natural gas, including from the developing shale plays, or could make it more difficult for us and our customers to perform hydraulic fracturing. The adoption of any additional laws or regulations regarding hydraulic fracturing or further restrictions on the availability of capital for hydraulic fracturing could potentially cause a decrease in the completion of new oil and natural gas wells and an associated decrease in demand for our services and increased compliance costs and time. Such a decrease could have a material adverse effect on our liquidity, consolidated results of operations, and consolidated financial condition. Moreover, as discussed above, the increased competitiveness and investment into non-fossil fuel energy sources (such as wind, solar, geothermal, hydrogen, tidal, battery storage technologies, and biofuels) or increased focus on reducing the use of combustion engines in transportation (such as governmental mandates that ban the sale of new gasoline-powered automobiles) could reduce demand for hydrocarbon fuels and our services, which would lead to a reduction in our revenues.
Oilfield anti-indemnity provisions enacted by many states may restrict or prohibit a party’s indemnification of us.
We typically enter into agreements with our customers governing the provision of our services, which usually include certain indemnification provisions for losses resulting from operations. Such agreements may require each party to indemnify the other against certain claims regardless of the negligence or other fault of the indemnified party; however, many states place limitations on contractual indemnity agreements, particularly agreements that indemnify a party against the consequences of its own negligence. Furthermore, certain states, including Louisiana, New Mexico, Texas, and Wyoming, have enacted statutes generally referred to as “oilfield anti-indemnity acts” expressly prohibiting certain indemnity agreements contained in or related to oilfield services agreements. Such oilfield anti-indemnity acts may restrict or void a party’s indemnification of us, which could have a material adverse effect on our business, financial condition, prospects, and results of operations.
Conservation measures, commercial development and technological advances could reduce demand for oil and natural gas and our services.
Fuel conservation measures, alternative fuel requirements, increasing consumer demand for alternatives to oil and natural gas, technological advances in fuel economy and energy generation devices could reduce demand for oil and natural gas, resulting in reduced demand for oilfield services. For example, the US Consumer Product Safety Commission has raised concerns about the potential for certain indoor gas appliances to emit harmful quantities of certain air pollutants. The impact
28
of the changing demand for oil and natural gas services and products, and proposed laws and regulations, may have a material adverse effect on our business, financial condition, results of operations and cash flows.
The commercial development of economically viable non-fossil fuel energy sources and related products (such as electric vehicles, wind, solar, geothermal, tidal, fuel cells and biofuels) could have a similar effect. In addition, certain U.S. federal income tax deductions currently available with respect to oil and natural gas exploration and development, including the allowance of percentage depletion for oil and natural gas properties, may be eliminated by proposed legislation. Any future decreases in the rate at which oil and natural gas reserves are discovered or developed, whether due to the passage of legislation, increased governmental regulation leading to limitations, or prohibitions on exploration and drilling activity, including hydraulic fracturing, or other factors, could have a material adverse effect on our business and financial condition, even in a stronger oil and natural gas price environment.
Additional restrictions on drilling activities intended to protect certain species of wildlife may adversely affect our ability to conduct completion activities.
In the United States, the ESA restricts activities that may affect endangered or threatened species or their habitats and similar protections are offered to migratory birds under the MBTA. To the extent species that are listed under the ESA or similar state laws, or are protected under the MBTA, inhabit the areas where we or our customers operate, our operations and the operations of our customers could be adversely impacted. Moreover, drilling activities may be delayed, restricted or precluded in protected habitat areas or during certain seasons, such as breeding and nesting seasons. The listing of new species under the ESA in the areas where our customers operate similarly has the potential to adversely impact our operations and demand for our services as a result of restrictions on oil and gas activities.
Similarly, the designation of previously unidentified endangered or threatened species could cause our operations to become subject to operating restrictions or bans, and limit future development activity in affected areas. Changes to existing rules could increase the portion of our customers’ operating areas that could be designated as critical habitat. Such new species designations or more restrictive rules could materially restrict use of or access to federal, state and private lands.
Risks related to our Corporate Structure and our Class A Common Stock
The Issuer is a holding company and its only material asset is its equity interest in ProFrac LLC; accordingly the Issuer is entirely dependent upon distributions from ProFrac LLC to meet its obligations, including the payment of taxes and covering its corporate and other overhead expenses.
The Issuer, ProFrac Holding Corp., is a holding company that has no material assets other than its equity interest in ProFrac LLC and, accordingly, has no independent means of generating revenue. To the extent ProFrac LLC has available cash, it is required to make (i) generally pro rata distributions to the holders of Units, including the Issuer, in an amount at least sufficient to allow the Issuer to pay its taxes (and those of its wholly owned subsidiaries) and to make payments under the Tax Receivable Agreement and any subsequent tax receivable agreement that it may enter into in connection with future acquisitions and (ii) non-pro rata payments to the Issuer to reimburse it for its corporate and other overhead expenses. If the Issuer needs funds, and ProFrac LLC or its subsidiaries are unable to provide such funds, or are restricted from doing so by applicable law or regulation or by the terms of any current or future financing arrangements, there is no assurance that the Issuer will be able to secure funds from other sources.
ProFrac Holding Corp.’s ability to make tax payments and payments under the Tax Receivable Agreement will be dependent on the ability of ProFrac LLC to make distributions to ProFrac Holding Corp. in an amount sufficient to cover ProFrac Holding Corp.’s tax obligations (and those of its wholly owned subsidiaries) and obligations under the Tax Receivable Agreement. This ability, in turn, may depend on the ability of ProFrac LLC’s subsidiaries to make distributions to it. We intend that such distributions from ProFrac LLC and its subsidiaries be funded with cash from operations or from future borrowings. The ability of ProFrac LLC, its subsidiaries and other entities in which it directly or indirectly holds an equity interest to make distributions is subject to, among other things, (i) the applicable provisions of Texas law (or other applicable jurisdiction) that may limit the amount of funds available for distribution and (ii) restrictions in relevant debt instruments issued by ProFrac LLC or its subsidiaries and other entities in which it directly or indirectly holds an equity interest. To the extent that ProFrac Holding Corp. is unable to make payments under the Tax Receivable Agreement for any reason, such payments will be deferred and will accrue interest until paid.
29
Conflicts of interest could arise between us, on the one hand, and Dan Wilks and Farris Wilks and entities owned by or affiliated with them (collectively, the “Wilks Parties”), on the other hand, concerning among other things, business transactions, competitive business activities or business opportunities.
Conflicts of interest could arise between us, on the one hand, and the Wilks Parties, on the other hand, concerning among other things, business transactions, competitive business activities or business opportunities. The Wilks Parties operate in the energy and oilfield services industries. In the normal course of business, we have engaged in transactions with some of these companies. Furthermore, the Wilks Parties now, and in the future may, directly or indirectly, compete with us for investment or business opportunities.
The Wilks Parties are not restricted from owning assets or engaging in businesses that compete directly or indirectly with us and do not have any duty to refrain from engaging, directly or indirectly, in the same or similar business activities or lines of business as us, including those business activities or lines of business deemed to be competing with us, or doing business with any of our clients, customers or vendors.
The Wilks Parties may become aware, from time to time, of certain business opportunities (such as acquisition opportunities) and may direct such opportunities to other businesses in which they have invested, in which case we may not become aware of or otherwise have the ability to pursue such opportunities. In addition, the Wilks Parties may dispose of their interests in energy or other oilfield services companies or other assets in the future, without any obligation to offer us the opportunity to purchase any of those interests or assets.
In any of these matters, the interests of Dan Wilks, Farris Wilks and their affiliates and other business owned by or affiliated with them may differ or conflict with the interests of our other shareholders. Any actual or perceived conflicts of interest with respect to the foregoing could have an adverse impact on the trading price of our Class A Common Stock.
The requirements of being a public company, including compliance with the reporting requirements of the Exchange Act and the requirements of the Sarbanes-Oxley Act of 2002 (“Sarbanes-Oxley”), may strain our resources, increase our costs and distract management, and we may be unable to comply with these requirements in a timely or cost-effective manner.
As a public company, we are required to comply with laws, regulations and requirements, including certain corporate governance provisions of Sarbanes-Oxley, and regulations of the Securities and Exchange Commission (“SEC”) and the requirements of Nasdaq. Complying with these statutes, regulations and requirements has and will continue to occupy a significant amount of time of our board of directors and management and significantly increase our costs and expenses. We are required to:
Section 404 of Sarbanes-Oxley requires that, upon satisfaction of certain conditions, our management assess the effectiveness of our internal control over financial reporting, and our independent registered public accounting firm issue an attestation report on those internal controls. Compliance with these provisions is onerous, and there is no assurance that we will be in a position to meet these legal requirements when they become applicable to us, or that we or our independent registered public accounting firm will not identify material weaknesses in our internal control over financial reporting. If we fail to comply with the requirements of Section 404 or if we or our independent registered public accounting firm identify and report such material weaknesses, the accuracy and timeliness of the filing of our annual and quarterly reports may be materially adversely affected and could cause investors to lose confidence in our reported financial information, which could have a negative effect on the price of our Class A Common Stock. In addition, a material weakness in the effectiveness of our internal control over financial reporting could result in an increased chance of fraud and the loss of customers, reduce our ability to obtain financing and require additional expenditures to comply with these requirements, each of which could have a material adverse effect on our business, results of operations and financial condition.
30
Our stock price may be volatile, which could lead to losses by investors.
The market price of our Class A Common Stock could vary significantly as a result of a number of factors, some of which are beyond ProFrac’s control. For example, since we consummated our IPO, the closing sales price of our Class A Common Stock has fluctuated from a high of $25.72 per share on November 22, 2022, to a low of $11.04 per share on March 23, 2023.
The following is a non-exhaustive list of factors that could affect our stock price:
The stock markets in general have experienced extreme volatility that has often been unrelated to the operating performance of particular companies. These broad market fluctuations may adversely affect the trading price of our Class A Common Stock. Securities class action litigation has often been instituted against companies following periods of volatility in the overall market and in the market price of a company’s securities. Such litigation, if instituted against us, could result in very substantial costs, divert our management’s attention and resources and materially harm our business, operating results and financial condition.
The current market price of our securities may not be indicative of future market prices or intrinsic value, and we may not be able to sustain or increase the value of an investment in our securities. Investors in our securities may experience a decrease, which could be substantial, in the value of their securities, including decreases unrelated to our operating performance, financial results or prospects. Your only opportunity to achieve a return on your investment in our securities may be if the market price of our securities appreciates and you sell your securities at a profit. The market price for our securities may never exceed, and may fall below, the price that you paid for such securities. You could lose all or part of your investment in us as a result.
The Wilks Parties have the ability to direct the voting of a majority of our voting stock, and their interests may conflict with those of our other stockholders.
As of December 31, 2022, the Wilks Parties controlled approximately 81.1% of our total voting power. As a result, the Wilks Parties are able to control matters requiring stockholder approval, including the election of directors, changes to our organizational documents and significant corporate transactions. This concentration of ownership makes it unlikely that any other holder or group of holders of our Class A Common Stock will be able to affect the way we are managed or the direction of our business. The interests of the Wilks Parties with respect to matters potentially or actually involving or affecting us, such as future acquisitions, financings and other corporate opportunities and attempts to acquire us, may conflict with the interests of our other stockholders.
For example, the Wilks Parties may have different tax and other positions from us, especially in light of the Tax Receivable Agreement, that could influence their decisions regarding whether and when to support the disposition of assets, the incurrence or refinancing of new or existing indebtedness, or the termination of the Tax Receivable Agreement and acceleration of our obligations thereunder. In addition, the determination of future tax reporting positions, the structuring of future transactions and the handling of any challenge by any taxing authority to our tax reporting positions may take into consideration tax or other considerations of the Wilks Parties which may differ from the considerations of us or our other stockholders.
31
Furthermore, in connection with our IPO, ProFrac entered into a Stockholders’ Agreement, dated as of May 17, 2022, with certain of the Wilks Parties (as amended on January 13, 2023, the “ProFrac Stockholders’ Agreement”), which addresses the right to designate nominees for election to the ProFrac board of directors. The existence of significant stockholders may have the effect of deterring hostile takeovers, delaying or preventing changes in control or changes in management, or limiting the ability of ProFrac’s other stockholders to approve transactions that they may deem to be in the best interests of ProFrac. Moreover, the Wilks Parties’ concentration of stock ownership may adversely affect the trading price of ProFrac Class A Common Stock to the extent investors perceive a disadvantage in owning stock of a company with significant stockholders.
A significant reduction by the Wilks Parties of their ownership interests in ProFrac could adversely affect us.
We believe that the Wilks Parties’ substantial ownership interest in ProFrac provides them with an economic incentive to assist us to be successful. However, the Wilks Parties may elect at any time to sell all or a substantial portion of or otherwise reduce their ownership interest in us. If the Wilks Parties sell all or a substantial portion of their ownership interests in us, they may have less incentive to assist in our success. Such actions could adversely affect our ability to successfully implement our business strategies which could adversely affect our cash flows or results of operations. See the discussion in Item 9B of this Annual Report for additional information.
Our certificate of incorporation and bylaws, as well as Delaware law, contain provisions that could discourage acquisition bids or merger proposals, which may adversely affect the market price of our Class A Common Stock and could deprive our investors of the opportunity to receive a premium for their shares.
Our certificate of incorporation authorizes our board of directors to, without stockholder approval, issue preferred stock in one or more series, and to fix the rights and preferences of each series. If our board of directors elects to issue preferred stock, it could be more difficult for a third party to acquire us. In addition, some provisions of our certificate of incorporation and bylaws could make it more difficult for a third party to acquire control of us, even if the change of control would be beneficial to our stockholders. Some of these provisions include, for example, the following:
In addition, certain change of control events will have the effect of accelerating the payments due under the Tax Receivable Agreement, which could be substantial and accordingly serve as a disincentive to a potential acquirer of the Company.
32
Our certificate of incorporation designates the Court of Chancery of the State of Delaware as the sole and exclusive forum for certain types of actions and proceedings that may be initiated by our stockholders, which could limit our stockholders’ ability to obtain a favorable judicial forum for disputes with us or our directors, officers, employees or agents.
Our certificate of incorporation provides that, unless we consent in writing to the selection of an alternative forum, the Court of Chancery of the State of Delaware, or, if such court does not have subject matter jurisdiction thereof, the federal district court of the State of Delaware, will, to the fullest extent permitted by applicable law, be the sole and exclusive forum for (i) any derivative action, suit or proceeding brought on our behalf, (ii) any action, suit or proceeding asserting a claim of breach of a fiduciary duty owed by any of our current or former directors, officers, employees or stockholders to us or our stockholders, (iii) any action, suit or proceeding asserting a claim arising pursuant to any provision of the Delaware General Corporation Law (the “DGCL”), our certificate of incorporation or our bylaws or as to which the DGCL confers jurisdiction on the Court of Chancery of the State of Delaware, or (iv) any action, suit or proceeding asserting a claim governed by the internal affairs doctrine, in each such case subject to such Court of Chancery having personal jurisdiction over the indispensable parties named as defendants therein. Investors in shares of our capital stock are bound by these provisions which may limit a stockholder’s ability to bring a claim in a judicial forum that it finds favorable for disputes with us or our directors, officers, employees or stockholders, which may discourage such lawsuits against us and such persons. However, these choice of forum limitations do not apply to suits brought to enforce a duty or liability created by the Securities Act or the Exchange Act.
Our amended and restated certificate of incorporation also provides that the federal district courts of the United States will be the exclusive forum for any complaint asserting a cause of action under the Securities Act. Section 22 of the Securities Act creates concurrent jurisdiction for federal and state courts over all suits brought to enforce any duty or liability created by the Securities Act or the rules and regulations thereunder. Accordingly, there is uncertainty as to whether a court would enforce this forum provision providing for exclusive jurisdiction of federal district courts with respect to suits brought to enforce any duty or liability created by the Securities Act. If a court were to find these provisions of our certificate of incorporation inapplicable to, or unenforceable in respect of, one or more of the specified types of actions or proceedings, we may incur additional costs associated with resolving such matters in other jurisdictions, which could adversely affect our business, financial condition or results of operations.
We do not presently anticipate paying cash dividends on our Class A Common Stock and our existing debt agreements place restrictions on our ability to do so. Consequently, your only opportunity to achieve a return on your shares of Class A Common Stock is if the price of our Class A Common Stock appreciates.
While we look forward to the opportunity to pay dividends in the future, we do not presently anticipate paying any cash dividends on our Class A Common Stock in the foreseeable future. In addition, our existing debt agreements place, and we expect our future debt agreements will place, restrictions on our ability to pay cash dividends. Consequently, unless we revise our dividend policy and are released of the provisions in our loan agreements that restrict the payment of dividends, your only opportunity to achieve a return on your investment in us will be if you sell your Class A Common Stock at a price greater than the price that you paid for it. There is no guarantee that the price of our Class A Common Stock that will prevail in the market will ever exceed the amount that you paid for it.
The price of our Class A Common Stock may decline as a result of the large number of shares available for sale.
As of March 23, 2023, we had 54,702,269 shares of our Class A Common Stock outstanding, approximately 2,542,708 shares of Class A Common Stock remained available for issuance under our long-term incentive plan, and the Wilks Parties owned 97,447,865 shares of our Class B Common Stock which are freely convertible into Class A Common Stock on a one-for-one basis, all of which we are required to register for resale upon their demand. As described in Part II, Item 9B “Other Information,” of this Annual Report, certain holders of Units, including the Wilks Parties, have recently had discussions with us about a potential redemption of all of their Units, which would result in the issuance of shares of Class A Common Stock equal to the number of Units requested to be redeemed.
The fact that many or all of these unissued shares may become issued and available for resale on very short notice may adversely affect the price at which our Class A Common Stock trades. In addition, we may issue in the future additional shares of our Class A Common Stock, or securities convertible into Class A Common Stock, which may further adversely affect the trading price of our shares and dilute existing shareholders.
33
ProFrac Holding Corp. is required to make payments under the Tax Receivable Agreement for certain tax benefits that it may claim, and the amounts of such payments could be significant.
We are party to the Tax Receivable Agreement with the TRA Holders. This agreement generally provides for the payment by ProFrac to the TRA Holders of 85% of the net cash savings, if any, in U.S. federal, state and local income tax and franchise tax (computed using simplifying assumptions to address the impact of state and local taxes) that ProFrac actually realizes (or is deemed to realize in certain circumstances) in periods after our IPO as a result of certain increases in tax basis available to ProFrac as a result of acquisitions of Units in connection with the IPO or pursuant to the exercise of the Redemption Right or the Call Right (as such terms are defined in the ProFrac LLC Agreement and certain benefits attributable to imputed interest. We will retain the benefit of the remaining 15% of any actual net cash tax savings.
The term of the Tax Receivable Agreement will continue until all tax benefits that are subject to the Tax Receivable Agreement have been utilized or expired, unless we experience a change of control (as defined in the Tax Receivable Agreement, which includes certain mergers, asset sales, or other forms of business combinations) or the Tax Receivable Agreement otherwise terminates early (at our election or as a result of our breach or the commencement of bankruptcy or similar proceedings by or against us) and ProFrac makes the termination payments specified in the Tax Receivable Agreement in connection with such change of control or other early termination. In the event that the Tax Receivable Agreement is not terminated, the payments under the Tax Receivable Agreement are anticipated to commence in 2023 and to continue for 15 years after the date of the last redemption of the Units.
The payment obligations under the Tax Receivable Agreement are our obligations and not obligations of ProFrac LLC, and we expect that the payments required to be made under the Tax Receivable Agreement will be substantial. Estimating the amount and timing of payments that may become due under the Tax Receivable Agreement is by its nature imprecise. For purposes of the Tax Receivable Agreement, net cash tax savings generally are calculated by comparing our actual tax liability (determined by using the actual applicable U.S. federal income tax rate and an assumed combined state and local income and franchise tax rate) to the amount we would have been required to pay had we not been able to utilize any of the tax benefits subject to the Tax Receivable Agreement. The actual increases in tax basis covered by the Tax Receivable Agreement, as well as the amount and timing of any payments under the Tax Receivable Agreement, will vary depending on a number of factors, including the timing of any redemption of Units, the price of our Class A Common Stock at the time of each redemption, the extent to which such redemptions are taxable transactions, the amount of the redeeming Unit Holder’s tax basis in its Units at the time of the relevant redemption, the depreciation and amortization periods that apply to the increase in tax basis, the amount and timing of taxable income we generate in the future, the U.S. federal income tax rates then applicable, and the portion of our payments under the Tax Receivable Agreement that constitute imputed interest or give rise to depreciable or amortizable tax basis. Any distributions made by ProFrac LLC to ProFrac in order to enable us to make payments under the Tax Receivable Agreement, as well as any corresponding pro rata distributions made to the Unit Holders, could have an adverse impact on our liquidity.
The payments under the Tax Receivable Agreement are not conditioned upon a TRA Holder having a continued ownership interest in ProFrac or ProFrac LLC. For more information, see the section “Tax Receivable Agreement.”
In certain cases, payments under the Tax Receivable Agreement may be accelerated and/or significantly exceed the actual benefits, if any, we realize in respect of the tax attributes subject to the Tax Receivable Agreement.
If we experience a change of control (as defined under the Tax Receivable Agreement, which includes certain mergers, asset sales and other forms of business combinations) or the Tax Receivable Agreement otherwise terminates early (at our election or as a result of our breach or the commencement of bankruptcy or similar proceedings by or against us), our obligations under the Tax Receivable Agreement would accelerate and we would be required to make an immediate payment equal to the present value of the anticipated future payments to be made by it under the Tax Receivable Agreement (determined by applying a discount rate equal to (i) the greater of (A) 0.25% and (B) the 180-Day Average Secured Overnight Financing Rate (“SOFR”), plus (ii) 150 basis points) and such payment is expected to be substantial. The calculation of anticipated future payments will be based upon certain assumptions and deemed events set forth in the Tax Receivable Agreement, including (i) that we have sufficient taxable income to fully utilize the tax benefits covered by the Tax Receivable Agreement, and (ii) that any Units (other than those held by ProFrac) outstanding on the termination date are deemed to be redeemed on the termination date. Any early termination payment may be made significantly in advance of, and may materially exceed, the actual realization, if any, of the future tax benefits to which the termination payment relates.
If we experience a change of control (as defined under the Tax Receivable Agreement) or the Tax Receivable Agreement otherwise terminates early, our obligations under the Tax Receivable Agreement could have a substantial negative impact on our liquidity and could have the effect of delaying, deferring or preventing certain mergers, asset sales, or other forms of business combinations or changes of control. For example, if we were to experience a change of control or the Tax Receivable Agreement had otherwise been terminated at December 31, 2022, the estimated termination payments could range up to more than $475 million. The foregoing amount is merely an estimate and the actual payment could differ materially. There can be no assurance that we will be able to satisfy our obligations under the Tax Receivable Agreement.
34
In the event that payment obligations under the Tax Receivable Agreement are accelerated in connection with certain mergers, other forms of business combinations or other changes of control, the consideration payable to holders of our Class A Common Stock could be substantially reduced.
If we experience a change of control (as defined under the Tax Receivable Agreement, which includes certain mergers, asset sales and other forms of business combinations), we would be obligated to make a substantial immediate lump-sum payment, and such payment may be significantly in advance of, and may materially exceed, the actual realization, if any, of the future tax benefits to which the payment relates. As a result of this payment obligation, holders of our Class A Common Stock could receive substantially less consideration in connection with a change of control transaction than they would receive in the absence of such obligation. Further, any payment obligations under the Tax Receivable Agreement are not conditioned upon the TRA Holders’ having a continued interest in ProFrac or ProFrac LLC. Accordingly, the TRA Holders’ interests may conflict with those of the holders of our Class A Common Stock.
We will not be reimbursed for any payments made under the Tax Receivable Agreement in the event that any tax benefits are subsequently disallowed.
Payments under the Tax Receivable Agreement will be based on the tax reporting positions that we will determine. The U.S. Internal Revenue Service (“IRS”) or another taxing authority may challenge all or part of the tax basis increases covered by the Tax Receivable Agreement, as well as other related tax positions we take, and a court could sustain such challenge. The TRA Holders will not reimburse us for any payments previously made under the Tax Receivable Agreement if any tax benefits that have given rise to payments under the Tax Receivable Agreement are subsequently disallowed, except that excess payments made to any TRA Holder will be netted against future payments that would otherwise be made to such TRA Holder, if any, after our determination of such excess (which determination may be made a number of years following the initial payment and after future payments have been made). As a result, in such circumstances, we could make payments that are greater than our actual cash tax savings, if any, and we may not be able to recoup those payments, which could materially adversely affect our liquidity.
If ProFrac LLC were to become a publicly traded partnership taxable as a corporation for U.S. federal income tax purposes, ProFrac and ProFrac LLC might be subject to potentially significant tax inefficiencies, and we would not be able to recover payments previously made by ProFrac under the Tax Receivable Agreement even if the corresponding tax benefits were subsequently determined to have been unavailable due to such status.
We intend to continue to operate such that ProFrac LLC does not become a publicly traded partnership taxable as a corporation for U.S. federal income tax purposes. A “publicly traded partnership” is a partnership the interests of which are traded on an established securities market or are readily tradable on a secondary market or the substantial equivalent thereof. Under certain circumstances, redemptions of Units pursuant to the Redemption Right (or acquisitions of Units pursuant to the Call Right) or other transfers of Units could cause ProFrac LLC to be treated as a publicly traded partnership. Applicable U.S. Treasury regulations provide for certain safe harbors from treatment as a publicly traded partnership, and we intend to operate such that redemptions or other transfers of Units qualify for one or more such safe harbors. For example, we intend to limit the number of unitholders of ProFrac LLC, and the ProFrac LLC Agreement entered into in connection with the closing of our IPO, provides for limitations on the ability of unitholders of ProFrac LLC to transfer their Units and will provide ProFrac, as the managing member of ProFrac LLC, with the right to impose restrictions (in addition to those already in place) on the ability of unitholders of ProFrac LLC to redeem their Units pursuant to the Redemption Right to the extent ProFrac believes it is necessary to ensure that ProFrac LLC will continue to be treated as a partnership for U.S. federal income tax purposes.
If ProFrac LLC were to become a publicly traded partnership taxable as a corporation for U.S. federal income tax purposes, significant tax inefficiencies might result for ProFrac and for ProFrac LLC, including as a result of our inability to file a consolidated U.S. federal income tax return with ProFrac LLC. In addition, we might not be able to realize tax benefits covered under the Tax Receivable Agreement, and we would not be able to recover any payments previously made by us under the Tax Receivable Agreement, even if the corresponding tax benefits (including any claimed increase in the tax basis of ProFrac LLC’s assets) were subsequently determined to have been unavailable.
We may issue preferred stock whose terms could adversely affect the voting power or value of our Class A Common Stock.
Our certificate of incorporation authorizes us to issue, without the approval of our stockholders, one or more classes or series of preferred stock having the designations, preferences, limitations and relative rights, including preferences over our Class A Common Stock respecting dividends and distributions, that our board of directors may determine. The terms of one or more classes or series of preferred stock could adversely impact the voting power or value of our Class A Common Stock. For example, we might grant holders of preferred stock the right to elect some number of our directors in all events or on the happening of specified events or the right to veto specified transactions. Similarly, the repurchase or redemption rights or liquidation preferences we might assign to holders of preferred stock could affect the residual value of our Class A Common Stock.
35
If we were deemed to be an investment company under the Investment Company Act of 1940, as amended (the “1940 Act”), applicable restrictions could make it impractical for us to continue our business as contemplated and could have a material adverse effect on our business, financial condition and results of operations.
Under Sections 3(a)(1)(A) and (C) of the 1940 Act, a company generally will be deemed to be an “investment company” for purposes of the 1940 Act if (i) it is, or holds itself out as being, engaged primarily, or proposes to engage primarily, in the business of investing, reinvesting or trading in securities or (ii) it engages, or proposes to engage, in the business of investing, reinvesting, owning, holding or trading in securities and it owns or proposes to acquire investment securities having a value exceeding 40% of the value of its total assets (exclusive of U.S. government securities and cash items) on an unconsolidated basis. We do not believe that we are an “investment company,” as such term is defined in either of those sections of the 1940 Act.
As the sole managing member of ProFrac LLC, the Issuer controls and operates ProFrac LLC. On that basis, we believe that the Issuer’s interest in ProFrac LLC is not an “investment security” as that term is used in the 1940 Act. However, if the Issuer were to cease participation in the management of ProFrac LLC, its interest in ProFrac LLC could be deemed to be an “investment security” for purposes of the 1940 Act.
Although the Issuer and ProFrac LLC intend to continue to conduct their operations so that the Issuer will not be deemed an investment company, if the Issuer were to be deemed an investment company, restrictions imposed by the 1940 Act, including limitations on our capital structure and our ability to transact with affiliates, would make it impractical for us to continue our business as contemplated and would have a material adverse effect on our business, financial condition and results of operations.
We are a “controlled company” within the meaning of the Nasdaq rules and, as a result, qualify for and intend to rely on exemptions from certain corporate governance requirements.
Because the Wilks Parties beneficially own 30,805,107 shares of our Class A Common Stock and 97,447,865 Units (and an equal number of shares of Class B Common Stock), representing approximately 81.1% of the voting power of ProFrac as of December 31, 2022, we are a controlled company under Sarbanes-Oxley and rules of Nasdaq. Additionally, the Wilks Parties are currently, and we expect that they will continue to be, deemed a group for purposes of certain rules and regulations of the SEC as a result of the ProFrac Stockholders’ Agreement. Under the Nasdaq rules, a company of which more than 50% of the voting power is held by another person or group of persons acting together is a controlled company and may elect not to comply with certain Nasdaq corporate governance requirements, including the requirements that:
These requirements will not apply to us as long as we remain a controlled company. We currently intend to continue to utilize some or all of these exemptions. Accordingly, you may not have the same protections afforded to stockholders of companies that are subject to all of the corporate governance requirements of Nasdaq.
General Risk Factors
Our business could be adversely affected by a decline in general economic conditions or a weakening of the broader energy industry, and inflation may adversely affect our financial position and operating results.
A prolonged economic slowdown or recession, adverse events relating to the energy industry, or regional, national or global economic conditions and factors, particularly a slowdown in the E&P industry, could negatively impact our operations and therefore adversely affect our results. The risks associated with our business are more acute during periods of economic slowdown and recession because such periods may be accompanied by decreased exploration and development spending by our customers, decreased demand for oil and natural gas, and decreased prices for oil and natural gas.
Inflationary factors, such as increases in the labor costs, material costs, and overhead costs, may also adversely affect our financial position and operating results.
36
Developments related to the ongoing war between Russia and Ukraine could adversely affect our business, financial condition and results of operations.
Russia is one of the main players in the global oil markets. Accordingly, any events that can impair or enhance its ability to compete in such markets are likely to have an impact on the industry in which we operate, the business decisions of our customers, and the level of demand for our services. Since the beginning of the war, sanctions imposed by Ukraine’s allies that seek to limit Russia’s ability to profit from oil and gas exports, and certain of the retaliatory measures taken by Russia in response (such as the ban on sales to certain countries), have created conditions resulting in an increased demand for our services. There is no assurance that such conditions will continue to exist, and even if they do, that we will continue to be able to benefit from them.
We may be adversely affected by disputes regarding intellectual property rights of third parties.
Third parties from time to time may initiate litigation against us by asserting that the conduct of our business infringes, misappropriates or otherwise violates intellectual property rights. If we are sued for infringement and lose, we could be required to pay substantial damages and/or be enjoined from using or selling the infringing products or technology. Any legal proceeding concerning intellectual property could be protracted and costly regardless of the merits of any claim and is inherently unpredictable and could have a material adverse effect on our financial condition, regardless of its outcome.
If we were to discover that our technologies or products infringe valid intellectual property rights of third parties, we may need to obtain licenses from these parties or substantially re-engineer our products to avoid infringement. We may not be able to obtain the necessary licenses on acceptable terms, or at all, or be able to re-engineer our products successfully. If our inability to obtain required licenses for our technologies or products prevents us from selling our products, that could adversely impact our financial condition and results of operations.
We face significant competition that may cause a loss of market share.
The oilfield services industry is highly competitive and has relatively few barriers to entry. The principal competitive factors impacting sales of our services are price, reputation and technical expertise, equipment and service quality and health and safety standards. Numerous factors could cause us to lose our competitive position, including the nature of the markets we compete in, and the often-times price-based nature of the competition we face.
The market for hydraulic fracturing services is fragmented and includes, not only numerous small companies capable of competing effectively in our markets on a local basis, but also several large companies that possess substantially greater financial and other resources than we do. Our larger competitors’ greater resources could allow them to compete more effectively than we can. For instance, our larger competitors may offer services at below-market prices or bundle ancillary services at no additional cost to customers. We compete with large national and multi-national companies that have longer operating histories, greater financial, technical and other resources and greater name recognition than we do. Several of our competitors provide a broader array of services and have a stronger presence in more geographic markets.
Some jobs are awarded on a bid basis, which further increases competition based on price. Pricing is often the primary factor in determining which qualified contractor is awarded a job, and we have had in the past to lower our prices to remain competitive. For example, because of a combination of the increased competition which began during the second half of 2018 and 2019 and the decreased demand for our services in 2020 due to the COVID-19 pandemic, we had to lower our prices to remain competitive, which contributed to a 35% decrease in revenues from stimulation services for fiscal year 2020 (as compared to 2019). Although our industry and results of operations have seen a strong recovery since those times, the vitality characteristic of the energy business makes it impossible for us to rule out potential adverse changes in the competitive landscape that may force us, once again, to lower our prices, which would adversely affect our results of operations. In addition, we may lose market share or be unable to maintain or increase prices for our present services or to acquire additional business opportunities, which could also have a material adverse effect on our business, financial condition, results of operations and cash flows.
Our wealthier competitors may be able to respond more quickly to new or emerging technologies and services and changes in customer requirements. The amount of equipment available may exceed demand, which could result in active price competition. In addition, depressed commodity prices lower demand for hydraulic fracturing equipment, which results in excess equipment and lower utilization rates. In addition, some E&P companies have commenced completing their wells using their own hydraulic fracturing equipment and personnel. Any increase in the development and utilization of in-house fracturing capabilities by our customers could decrease the demand for our services and have a material adverse impact on our business.
37
If we are unable to employ a sufficient number of skilled and qualified workers, our capacity and profitability could be diminished and our growth potential could be impaired.
The delivery of our services requires skilled and qualified workers with specialized skills and experience who can perform physically demanding work. As a result of the volatility of the oilfield services industry and the demanding nature of the work, workers may choose to pursue employment in fields that offer a more desirable work environment at wage rates that are competitive. Our ability to be productive and profitable will depend upon our ability to employ and retain skilled workers. In addition, our ability to expand our operations depends in part on our ability to increase the size of our skilled labor force. The demand for skilled workers is high, and the supply is limited. As a result, competition for experienced oilfield service personnel is intense, and we face significant challenges in competing for crews and management with large and well-established competitors. A significant increase in the wages paid by competing employers could result in a reduction of our skilled labor force, increases in the wage rates that we must pay, or both. If either of these events were to occur, our capacity and profitability could be diminished and our growth potential could be impaired.
A negative shift in investor sentiment of the oil and gas industry has had and could in the future have adverse effects on our operations and ability to raise capital.
Certain segments of the investor community have developed negative sentiment towards investing in our industry. For example, certain sovereign wealth funds, pension funds, university endowments and family foundations, have stated policies to disinvest in the oil and gas sector based on their social and environmental considerations. Certain other stakeholders have also pressured commercial and investment banks and other lenders and investors to stop financing oil and gas production and related infrastructure projects, which adversely affects our customers. Such developments could result in downward pressure on the stock prices of oilfield service companies, including ours. This may also potentially result in a reduction of available capital funding for potential transactions, impacting our future financial results.
Negative public perception can lead to additional regulatory burdens and reduced business opportunities for us.
Negative public perception regarding our industry may lead to increased regulatory scrutiny, which may, in turn, lead to new state and federal safety and environmental laws, regulations, guidelines or enforcement interpretations. Additionally, environmental and other advocacy groups may oppose our customers’ operations through organized protests, attempts to block or sabotage our customers’ operations, intervene in regulatory or administrative proceedings involving our customers’ assets, or file lawsuits or other actions designed to prevent, disrupt or delay the development or operation of our customers’ assets. These actions may increase our costs of compliance and reduce our customers’ production levels over time which, as a result, may reduce demand for our services. Moreover, governmental authorities exercise considerable discretion in the timing and scope of permit issuance and the public may engage in the permitting process, including through intervention in the courts. Negative public perception could cause the permits that our customers require to conduct their operations to be withheld, delayed or burdened by requirements that restrict our customers’ ability to profitably conduct their businesses, which would also reduce demand for our services. Ultimately, this could make it more difficult to secure funding for our operations.
In addition, organizations that provide information to investors on corporate governance and related matters have developed ratings processes for evaluating companies on their approach to ESG matters. Such ratings are used by some investors to inform their investment and voting decisions. Unfavorable ESG ratings and recent activism directed at shifting funding away from companies with fossil fuel-related assets could lead to increased negative investor sentiment toward us and our industry and to the diversion of investment to other industries, which could have a negative impact on the price of our Class A Common Stock and our or our customers’ access to and cost of capital. Also, institutional lenders may decide not to provide funding for fossil fuel energy companies based on climate change-related concerns, which could affect our or our customers’ access to capital for potential growth projects.
38
We are subject to cyber security risks. A cyber incident could occur and result in information theft, data corruption, operational disruption and/or financial loss.
The oil and natural gas industry has become increasingly dependent on digital technologies to conduct certain processing activities. For example, we depend on digital technologies to perform many of our services and process and record operational and accounting data. At the same time, cyber incidents, including deliberate attacks or unintentional events, have increased. The U.S. government has issued public warnings that indicate that energy assets might be specific targets of cyber security threats. Our technologies, systems and networks, and those of our vendors, suppliers and other business partners, may become the target of cyberattacks or information security breaches that could result in the unauthorized release, gathering, monitoring, misuse, loss or destruction of proprietary and other information, or other disruption of our business operations. In addition, certain cyber incidents, such as surveillance, may remain undetected for an extended period. Our systems and insurance coverage for protecting against cyber security risks may not be sufficient. As cyber incidents continue to evolve, we may be required to expend additional resources to continue to modify or enhance our protective measures or to investigate and remediate any vulnerability to cyber incidents. Our insurance coverage for cyberattacks may not be sufficient to cover all the losses we may experience as a result of such cyberattacks.
Item 1B. Unresolved Staff Comments.
None.
Item 2. Properties
Our Non-Mining Properties
We lease office space for our corporate headquarters located at 333 Shops Boulevard, Suite 301, Willow Park, Texas 76087. We currently own or lease the following additional principal properties:
Location |
|
Size |
|
Leased or owned |
|
Purpose |
|
Segment |
Willow Park, TX |
|
8,244 sq ft |
|
Leased |
|
Corporate |
|
- |
Smithfield, PA |
|
47,800 sq ft |
|
Leased |
|
Field Operations |
|
Stimulation services |
Asherton, TX |
|
48,797 sq ft |
|
Leased |
|
Sales Office |
|
Stimulation services |
Odessa, TX |
|
50,634 sq ft |
|
Leased |
|
Field Operations |
|
Stimulation services |
Odessa, TX |
|
61,540 sq ft |
|
Leased |
|
Field Operations |
|
Stimulation services |
Elk City, OK |
|
42,330 sq ft |
|
Leased |
|
Field Operations |
|
Stimulation services |
Washington County, PA |
|
41,660 sq ft |
|
Leased |
|
Field Operations |
|
Stimulation services |
Pleasanton, TX |
|
62,950 sq ft |
|
Leased |
|
Field Operations |
|
Stimulation services |
Longview, TX |
|
36,000 sq ft |
|
Leased |
|
Field Operations |
|
Stimulation services |
Vernal, UT |
|
18,827 sq ft |
|
Leased |
|
Field Operations |
|
Stimulation services |
Aledo, TX |
|
94,050 sq ft |
|
Leased |
|
Manufacturing |
|
Manufacturing |
Hobbs, NM |
|
12,000 sq ft |
|
Leased |
|
Field Operations |
|
Stimulation services |
Ozona, TX |
|
21,292 sq ft |
|
Leased |
|
Field Operations |
|
Stimulation services |
Marshall, TX |
|
21,800 sq ft |
|
Leased |
|
Field Operations |
|
Stimulation services |
Pleasanton, TX |
|
421,443 sq ft |
|
Leased |
|
Field Operations |
|
Stimulation services |
El Reno, OK |
|
507,202 sq ft |
|
Leased |
|
Field Operations |
|
Stimulation services |
Fort Worth, TX |
|
109,823 sq ft |
|
Leased |
|
Manufacturing |
|
Manufacturing |
Fort Worth, TX |
|
79,346 sq ft |
|
Leased |
|
Manufacturing |
|
Manufacturing |
Fort Worth, TX |
|
11,193 sq ft |
|
Leased |
|
Manufacturing |
|
Manufacturing |
Fort Worth, TX |
|
89,522 sq ft |
|
Leased |
|
Manufacturing |
|
Manufacturing |
Fort Worth, TX |
|
22,604 sq ft |
|
Leased |
|
Corporate Office |
|
- |
Houston, TX |
|
19,865 sq ft |
|
Leased |
|
Corporate Office |
|
- |
Jane Lew, WV |
|
70,500 sq ft |
|
Leased |
|
Field Operations |
|
Stimulation services |
Gillette, WY |
|
139,580 sq ft |
|
Leased |
|
Field Operations |
|
Stimulation services |
Vernal, UT |
|
13,188 sq ft |
|
Leased |
|
Field Operations |
|
Stimulation services |
San Angelo, TX |
|
18,200 sq ft |
|
Leased |
|
Field Operations |
|
Stimulation services |
Cisco, TX |
|
377,186 sq ft |
|
Owned |
|
Field Operations |
|
Stimulation services |
Denver, CO |
|
4,286 sq ft |
|
Leased |
|
Corporate Office |
|
- |
Dickinson, ND |
|
226,222 sq ft |
|
Leased |
|
Field Operations |
|
Stimulation services |
Hennessy, OK |
|
435,600 sq ft |
|
Leased |
|
Field Operations |
|
Stimulation services |
Zanesville, OH |
|
652,566 sq ft |
|
Owned |
|
Manufacturing |
|
Manufacturing |
Bossier City, LA |
|
3,400 sq ft |
|
Leased |
|
Corporate Office |
|
- |
39
Our Mining Properties
As of December 31, 2022, our mining activities in all mining properties described in Item 1301(a) of Regulation S-K included four sites operated by us (Kermit, Lamesa, Monahans and Monarch) and four sites which we had contracted to acquire and, therefore, it was “probable” (as the term is used in the regulations) that we would operate or have an economic interest in (Hat Creek, River Ridge, Sunny Point and Merryville). As of December 31, 2022, we did not have any individually material mining properties.
The map below shows the locations of our mining operations referred to above:
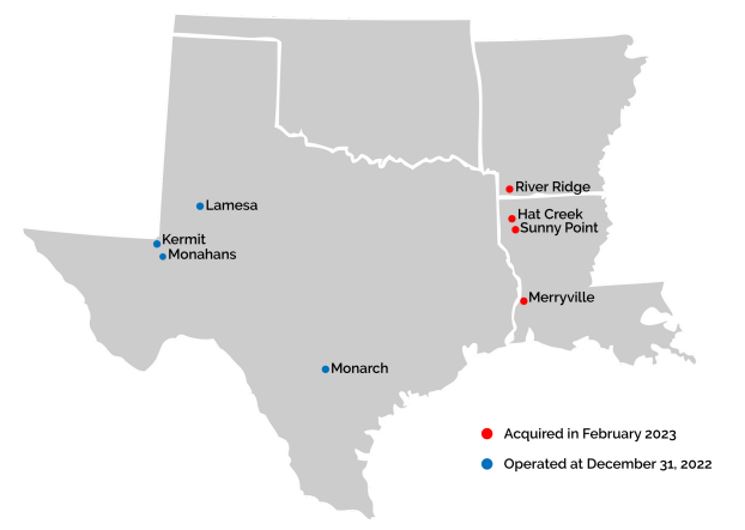
Summary Overview of Our Mining and Processing Facilities
The following table sets forth certain information about the mining properties required to be included in our mining operations as of December 31, 2022 pursuant to Item 1303(a) of Regulation S-K:
Mine |
Location |
Size |
Owned/Leased |
Operator |
Stage |
Kermit |
Winkler County, Texas |
641 acres |
Owned
|
Alpine Silica, LLC |
Production |
Kermit |
Winkler County, Texas |
630 acres |
Leased |
Alpine Silica, LLC |
Production |
Lamesa |
Dawson County, Texas |
6,700 acres |
Owned |
Alpine Silica, LLC |
Production |
Monahans |
Ector and Ward Counties, Texas |
2,723 acres |
Leased |
Alpine Silica, LLC |
Production |
Monarch |
Bexar County, Texas |
735.0 acres |
Owned |
Alpine Silica, LLC |
Production |
Hat Creek |
Bossier and Caddo Parishes, Louisiana |
706.2 acres |
Leased |
Performance Proppants, LLC |
Production |
River Ridge |
Miller and Lafayette Counties, Arkansas |
2,000 acres |
Owned |
Performance Proppants, LLC |
Production |
Sunny Point |
Bossier and Caddo Parishes, Louisiana |
843 acres |
Leased |
Performance Proppants, LLC |
Production |
Merryville |
Beauregard Parish, Louisiana |
1,200 acres |
Leased |
Performance Proppants, LLC |
Production |
40
Our aggregate annual production of frac sand in thousands of product tons for the fiscal years ended on December 31, 2022, 2021 and 2020 was 2,153, 1,646, and 737, respectively.
The following provides an overview of our operations in mining properties:
Kermit Sand Mine, Winkler County, TX
We operate a sand mine and processing facility located in Winkler County, Texas, strategically located in the Permian Basin that we refer to as our “Kermit Sand Mine.” The Kermit Sand Mine is a surface sand mine and a production stage property located on Farm-to-Market Road (“FM”) 1218 approximately 14 miles north of Kermit, Texas and approximately 58 miles west of the Midland-Odessa area. Our Kermit Sand Mine facility features two wash plants and a dry plant with two rotary dryers that clean and classify the sand. The Kermit Sand Mine facility was built in 2017 and produces 40/70 and 100 mesh sand. Additional onsite facilities include a scale house, office, shop, quality laboratory and onsite housing for up to 40 employees. Approximately 70 employees are located at the Kermit Sand Mine to facilitate the processing and storage of the proppant products. The plant does not crush the material but cleans and classifies the sand. Once the product is appropriately processed, it is stored in one of eight storage silos until it is transported by truck to its destination.
Our Kermit Sand Mine operates under five operating permits and complies with other state and federal regulations that do not require a specific permit. The Kermit Sand Mine’s current New Source Review (“NSR”) permit is renewable in 2028. Other permits held for such mine include: Stormwater, Above Ground Storage Tank, Aggregate Production Operation, and a Public Water System application that is pending. There are no formal state or federal reclamation plans or permits required for the operation.
Lamesa Sand Mine, Dawson County, TX
We operate a sand mine and processing facility located in Dawson County, Texas, strategically located in the Permian Basin that we refer to as our “Lamesa Sand Mine.” Following the acquisition of the land of the Lamesa Sand Mine in December 2021, we completed the installation of mining and processing facilities and commenced operations in late December 2022. Our Lamesa Sand Mine is a surface sand mine and a production stage property located approximately 55 miles north of Midland, Texas and 13 miles northwest of Lamesa, Texas. Our Lamesa Sand Mine facility features a wash plant and a dry plant that process the mined sand into finished proppant products. The Lamesa Sand Mine produces 40/70 and 100 mesh sand. Additional onsite facilities include an office building, shipping office and shop that support the mining and processing activities, and onsite housing for up to 36 employees. Approximately 85 employees are located at the Lamesa Sand Mine to facilitate the processing and storage of the proppant products. The plant does not crush the material but cleans and classifies the sand. Once the product is appropriately processed and classified, it is stored in one of four storage silos until it is transported by truck to its destination.
Our Lamesa Sand Mine operates under six operating permits and complies with other state and federal regulations that do not require a specific permit. The Lamesa Sand Mine operates under a Permit by Rule (“PBR”) permit, which does not have an expiration date. Other permits for the mine include: Stormwater, Above Ground Storage Tank, Aggregate Production Operation, On-Site Sewage Facility, and a Public Water System application that is pending. There are no formal state or federal reclamation plans or permits required for the operation.
Monahans Sand Mine, Ector and Ward Counties, TX
We own and operate a sand mine and processing facility located in Ector and Ward Counties, Texas, strategically located in the Permian Basin that we refer to as our “Monahans Sand Mine.” The Monahans Sand Mine was originally built in 2017 and we acquired the mine in late July 2022. Our Monahans Sand Mine is a surface sand mine and production stage property located approximately 10 miles east of Monahans, Texas and approximately 30 miles west of the Midland-Odessa, Texas area. Our Monahans Sand Mine facility features a wash plant and a dry plant with two rotary dryers that clean and classify sand. The Monahans Sand Mine produces 40/70 and 100 mesh sand. Additional onsite facilities include an office building, various control rooms, a shop/warehouse and a quality laboratory that support the mining and processing activities. Approximately 80 employees are located at the Monahans Sand Mine to facilitate the processing and storage of the proppant products. The plant does not crush the material but cleans and classifies the sand. Once the product is appropriately processed and classified, it is stored in one of eight storage silos until it is transported by truck to its destination.
Our Monahans Sand Mine operates under four permits and complies with other state and federal regulations that do not require a specific permit. The Monahans Sand Mine’s current NSR permit is renewable in 2029. Other permits for the mine include: Stormwater, Above Ground Storage Tank and Aggregate Production Operation. There are no formal state or federal reclamation plans or permits required for the operation.
41
Monarch Sand Mine, Bexar County, TX
We own and operate a sand mine and processing facility located in San Antonio, Texas, strategically located in the Eagle Ford Shale that we refer to as our “Monarch Sand Mine.” We acquired the Monarch Sand Mine in December 2022. Our Monarch Sand Mine is a surface sand mine and production stage property located approximately 3 miles south of Loop 1604 in Bexar County, Texas. Our Monarch Sand Mine facility features a wet and dry plant that processes the mined sand into finished proppant products. The Monarch Sand Mine was originally built in 2018 and produces 40/70 and 100 mesh sand. Additional onsite facilities include an office/control room and extensive conveyor systems that support intra-plant product movement. Approximately 60 employees are located at the Monarch Sand Mine to facilitate the processing and storage of the proppant products. The plant does not crush the material but cleans and classifies the sand. Once the product is appropriately processed and classified, it is stored in one of five storage silos until it is transported by truck to its destination. Additionally, the Monarch Sand Mine has more than six acres of wet sand storage.
Our Monarch Sand Mine operates under five permits and complies with other state and federal regulations that do not require a specific permit. The Monarch Sand Mine operates under a PBR permit, which does not have an expiration date. Other permits for the mine include: Stormwater, Above Ground Storage Tank, Aggregate Production Operation and On-Site Sewage Facility. There are no formal state or federal reclamation plans or permits required for the operation.
River Ridge Sand Mine, Miller and Lafayette Counties, AR
We own and operate a sand mine and processing facility located in Miller and Lafayette Counties, Arkansas, strategically located in the Haynesville Shale basin that we refer to as our “River Ridge Sand Mine.” We acquired the River Ridge Sand Mine in February 2023. Our River Ridge Sand Mine is a dredging and processing operation located approximately 5 miles east southeast of Doddridge, Arkansas and 30 miles southeast of Texarkana, Arkansas. Our River Ridge Sand Mine facility features a wet and dry plant that processes the mined sand into finished proppant products. The River Ridge Sand Mine was originally built in 2019 and produces 30/70, 40/70, 40/140 and 100 mesh sand. Additional onsite facilities include an office complex that supports the mining and processing activities. Approximately 145 employees are located at the River Ridge Sand Mine to facilitate the processing and storage of the proppant products. The plant does not crush the material but cleans and classifies the sand. Once the product is appropriately processed and classified, it is stored in one of six storage silos until it is transported by truck to its destination.
Our River Ridge Sand Mine operates under three permits and complies with other state and federal regulations that do not require a specific permit. The River Ridge Sand Mine operates under a state of Arkansas Minor Source Air permit, which does not have an expiration date. Other permits for the mine include Stormwater and Above Ground Storage Tank. There are no formal state or federal reclamation plans or permits required for the operation.
Hat Creek Sand Mine, Bossier and Caddo Parishes, LA
We own and operate a sand mine and processing facility located in Bossier and Caddo Parishes, Louisiana, strategically located in the Haynesville Shale basin that we refer to as our “Hat Creek Sand Mine.” We acquired the Hat Creek Sand Mine in February 2023. Our Hat Creek Sand Mine is a dredging and processing operation located approximately 5 miles north of Shreveport, Louisiana. Our Hat Creek Sand Mine facility features a wet and dry plant that processes the mined sand into finished proppant products. The Hat Creek Sand Mine was originally built in 2017 and produces 40/140 mesh sand. Additional onsite facilities include an office complex that supports the mining and processing activities. Approximately 75 employees are located at the Hat Creek Sand Mine to facilitate the processing and storage of the proppant products. The plant does not crush the material but cleans and classifies the sand. Once the product is appropriately processed and classified, it is stored in one of five storage silos until it is transported by truck to its destination.
Our Hat Creek Sand Mine operates under two permits and complies with other state and federal regulations that do not require a specific permit. The Hat Creek Sand Mine operates under a state of Louisiana Minor Source Air permit that expires in 2027 and also has a Stormwater permit. There are no formal state or federal reclamation plans or permits required for the operation.
Sunny Point Sand Mine, Bossier and Caddo Parishes, LA
We own and operate a sand mine and processing facility located in Bossier and Caddo Parishes, Louisiana, strategically located in the Haynesville Shale basin that we refer to as our “Sunny Point Sand Mine.” We acquired the Sunny Point Sand Mine in February 2023. Our Sunny Point Sand Mine is a dredging and processing operation located approximately 6 miles southeast of Shreveport, LA. Our Sunny Point Sand Mine facility features a wet and dry plant that processes the mined sand into finished proppant products. The Sunny Point Sand Mine was built in 2022 and produces 40/200 mesh sand. Additional onsite facilities include an office complex that supports the mining and processing activities. Approximately 80 employees are located at the Sunny Point Sand Mine to facilitate the processing and storage of the proppant products. The plant does not crush the material but cleans and classifies the sand. Once the product is appropriately processed and classified, it is stored in one of four storage silos until it is transported by truck to its destination.
42
Our Sunny Point Sand Mine operates under two permits and complies with other state and federal regulations that do not require a specific permit. The Sunny Point Sand Mine operates under a state of Louisiana Minor Source Air permit that expires in 2032 and also has a Stormwater permit. There are no formal state or federal reclamation plans or permits required for the operation.
Merryville Sand Mine, Beauregard Parish, LA
We own and operate a sand mine and processing facility located in Beauregard Parish, Louisiana, strategically located in the Haynesville Shale basin that we refer to as our “Merryville Sand Mine.” We acquired the Merryville Sand Mine in February 2023. Our Merryville Sand Mine is a dredging and processing operation located approximately 10 miles west of DeRidder, LA. Our Merryville Sand Mine facility features a dry plant that processes the mined sand into finished proppant products. The Merryville Sand Mine was built in 2022 and produces 30/100 mesh sand. Additional onsite facilities include an office complex that supports the mining and processing activities. Approximately 55 employees are located at the Merryville Sand Mine to facilitate the processing and storage of the proppant products. The plant does not crush the material but cleans and classifies the sand. Once the product is appropriately processed and classified, it is stored in one of three storage silos until it is transported by truck to its destination.
Our Merryville Sand Mine operates under two permits and complies with other state and federal regulations that do not require a specific permit. The Merryville Sand Mine operates under a state of Louisiana Minor Source Air permit that expires in 2032 and also has a Stormwater permit. There are no formal state or federal reclamation plans or permits required for the operation.
Summary of Resources and Reserves
Information concerning our mining properties and mineral reserves has been prepared in accordance with the requirements of Subpart 1300 of Regulation S-K (“Reg. S-K 1300”). The terms “mineral resources,” “mineral reserve,” “proven mineral reserve,” and “probable mineral reserve,” whether singular or plural, are defined and used in accordance with Reg. S-K 1300. Under Reg. S-K 1300, mineral resources may not be classified as “mineral reserves” unless the determination has been made by a qualified person that the mineral resources can be the basis of an economically viable project. We believe we have a high-quality mineral reserve base.
Set forth in the tables below are our estimates (in thousands of tons) of our proven and probable mineral reserves as of December 31, 2022.
|
|
Estimated Recoverable Mineral Reserves at December 31, 2022 |
|
|||||||||||||||||
|
|
|
|
|
By Classification |
|
|
By Tenure |
|
|||||||||||
|
|
Total |
|
|
Proven |
|
|
Probable |
|
|
Owned |
|
|
Leased |
|
|||||
40/200-Mesh Frac Sand: |
|
|
|
|
|
|
|
|
|
|
|
|
|
|
|
|||||
Permian Basin |
|
|
|
|
|
|
|
|
|
|
|
|
|
|
|
|||||
Kermit(a) |
|
|
46,373 |
|
|
|
39,189 |
|
|
|
7,184 |
|
|
|
26,798 |
|
|
|
19,575 |
|
Lamesa(b) |
|
|
56,108 |
|
|
|
56,108 |
|
|
|
- |
|
|
|
56,108 |
|
|
|
- |
|
Monahans(c) |
|
|
98,608 |
|
|
|
- |
|
|
|
98,608 |
|
|
|
- |
|
|
|
98,608 |
|
Subtotal |
|
|
201,089 |
|
|
|
95,297 |
|
|
|
105,792 |
|
|
|
82,906 |
|
|
|
118,183 |
|
Eagle Ford Shale |
|
|
|
|
|
|
|
|
|
|
|
|
|
|
|
|||||
Monarch(d) |
|
|
42,324 |
|
|
|
- |
|
|
|
42,324 |
|
|
|
42,324 |
|
|
|
- |
|
Total |
|
|
243,413 |
|
|
|
95,297 |
|
|
|
148,116 |
|
|
|
125,230 |
|
|
|
118,183 |
|
(a) Mineral reserves are reported at the 2021 average selling price of $19.11 per ton. Overall product yield is 78% after mining and processing losses.
(b) Mineral reserves are reported at the 2021 average selling price of $19.11 per ton. Overall product yield is 77.5% after mining and processing losses.
(c) Mineral reserves are reported at the 2022 average selling price of $39.29 per ton. Overall product yield is 69.3% after mining and processing losses.
(d) Mineral reserves are reported at the 2022 average selling price of $54.85 per ton. Overall product yield is 66.4% after mining and processing losses.
43
There are no reportable mineral resources in addition to those converted to mineral reserves. Quantities of frac sand controlled by us within the defined boundaries of the mining properties set forth above which are not reported as mineral reserves are not considered to have potential economic viability; as such, they are not reportable as mineral resources.
Internal Controls
At our Kermit Sand Mine, exploration samples are evaluated in our laboratory facilities to assess product quality and mining/processing parameters. Members of our sales management team assess the salability of the products. We engaged the John T. Boyd Company (“John T. Boyd”) to prepare geologic models, mining plans and financial models of our Kermit and Lamesa Sand mines using geologic, topographic and site data to independently estimate the mineral reserves for these mines. We provided the John T. Boyd certain operating and financial information for each of these mines to assist them in opining as to the economic viability of our mineral reserves. John T. Boyd did not verify historic drill hole data by conducting independent drilling in areas already explored. It is customary in preparing proppant sand resource and reserve estimates to accept basic drilling and quality testing data as provided by management, subject to the reported results being judged representative and reasonable.
John T. Boyd’s efforts to judge the appropriateness and reasonability of the source exploration data included reviewing provided drilling logs, sampling procedures, frac sand quality testing results, examining archival sample intervals, and discussing the foregoing information with us.
With respect to the sand mines acquired during 2022 (Monahans and Monarch), the quantity and nature of the mineral reserves are estimated by our internal mine planning team and third-party companies. John T. Boyd has reviewed our December 31, 2022 mineral reserves, and we intend to continue retaining third-party engineers to review our mineral reserves on an annual basis.
For a discussion of the risks inherent in our mineral resource and reserve estimates, please refer to Item 1A, Risk Factors - Risks Related to Our Business - Inaccuracies in our estimates of mineral reserves and resource deposits, or deficiencies in our title to those deposits, could result in our inability to mine the deposits or require us to pay higher than expected costs.
Item 3. Legal Proceedings.
Information with respect to this Item is incorporated herein by reference to “Note 13 – Commitments and Contingencies” included in “Item 8. Financial Statements and Supplementary Data” of this Annual Report.
Item 4. Mine Safety Disclosures.
The information concerning mine safety violations and other regulatory matters required by Section 1503(a) of the Dodd-Frank Wall Street Reform and Consumer Protection Act and Item 104 of Regulation S-K (17 CFR 229.104) is included in Exhibit 95 to this Annual Report on Form 10-K.
44
PART II
Item 5. Market for Registrant’s Common Equity, Related Stockholder Matters and Issuer Purchases of Equity Securities.
Market Information
Our Class A Common Stock and Warrants are currently quoted on Nasdaq under the symbols “ACDC” and “ACDCW,” respectively. There is no public market for our Class B Common Stock.
Holders of our Class A Common Stock
As of March 23, 2023, there were 51 holders of record of our Class A Common Stock and 7 holders of record of our Class B Common Stock. The number of record holders is based upon the actual number of holders registered on the books of the Company at such date and does not include holders of shares in “street name” or persons, partnerships, associations, corporations or other entities identified in security position listings maintained by depositories.
Dividend Policy
The Issuer does not presently anticipate declaring or paying any cash dividends to holders of the Class A Common Stock in the foreseeable future. We currently intend to retain future earnings, if any, to finance the growth of our business. Our future dividend policy is within the discretion of our board of directors and will depend upon the then-existing conditions, including our results of operations, financial condition, capital requirements, investment opportunities, and other factors our board of directors may deem relevant. In addition, our existing debt agreements place, and we expect our future debt agreements will place, certain restrictions on our ability to pay cash dividends on the Class A Common Stock.
Recent Sales of Unregistered Equity Securities
We had no sales of unregistered equity securities during the period covered by this Annual Report that were not previously reported in a Current Report on Form 8-K or a Quarterly Report on Form 10-Q.
Issuer Purchases of Equity Securities
During the quarter ended December 31, 2022, we did not repurchase any of our equity securities.
Item 6. [Reserved]
45
Item 7. Management’s Discussion and Analysis of Financial Condition and Results of Operations.
The following discussion and analysis of our financial condition and results of operations should be read together with our consolidated financial statements and related notes included within “Item 8. Financial Statements and Supplementary Data.” In addition to historical consolidated financial information, the following discussion contains forward-looking statements that reflect the Company’s plans, estimates, or beliefs. Actual results could differ materially from those discussed in the forward-looking statements. Factors that could cause or contribute to these differences include those discussed below and elsewhere in this Annual Report, including, without limitation, those described in the sections titled “Cautionary Note Regarding Forward-Looking Statements” and Part I, Item 1A “Risk Factors.”
Overview
We are a technology-focused, vertically integrated energy services company providing well stimulation services, proppants production and other complementary products and services to oil and gas companies engaged in E&P of unconventional oil and natural gas resources throughout the United States. Founded in 2016, ProFrac was built to be the go-to service provider for E&P companies’ most demanding hydraulic fracturing needs. On May 17, 2022, ProFrac Corp. completed its IPO of 16,000,000 shares of its Class A common stock, par value $0.01 per share, which is listed on the Nasdaq Global Select Market. Our business combines a young fleet of modern, technologically advanced pressure pumping equipment with vertically integrated proppant, chemicals and manufacturing, enabling us to deliver premium service quality while maintaining an advantaged cost structure. We believe the technical and operational capabilities of our fleets, as well as our internal frac sand production and equipment manufacturing capabilities uniquely position us to capitalize on the growing demand for well stimulation services to support the ongoing development of American oil and gas reserves. Additionally, we have a focused M&A strategy to acquire high-quality businesses at attractive valuations that increase our scale and expand our technological and supply chain competencies. Since the completion of our IPO, we have completed six acquisitions adding approximately 18.7 million tons of annual sand capacity and 13 frac fleets. These acquisitions provide us with an opportunity to generate attractive returns, when combined with our operational and commercial platform.
Our operations are focused on the most active unconventional regions in the United States, where we have cultivated deep and longstanding customer relationships with some of those regions’ leading E&P companies. We believe we are among the largest well stimulation services providers in the United States, with 42 active fleets as of January 3, 2023. We operate throughout nearly all major unconventional oil and gas basins in the United States and our scale and geographical footprint provide us with both operating leverage as well as exposure to a diversified customer and commodity mix.
Summary Financial Results
Our Predecessor and ProFrac Holding Corp.
Our predecessor consists of ProFrac LLC and its subsidiaries, Best Pump & Flow LP (“Best Flow”) and Alpine Silica, LLC (“Alpine”), (which we refer to as “ProFrac Predecessor”) on a consolidated basis. Historical periods for ProFrac Predecessor had been presented on a consolidated and combined basis given the common control ownership the Wilks Parties. On December 21, 2021, all of the then-outstanding membership interests in Best Flow and Alpine were contributed to ProFrac LLC in exchange for membership interests in ProFrac LLC. Unless otherwise indicated, the historical consolidated financial information included in this Annual Report presents the historical financial information of ProFrac Predecessor. Historical consolidated financial information is not indicative of the results that may be expected in any future periods.
2022 Significant Events
Initial Public Offering and Corporate Reorganization
On May 17, 2022, we consummated the IPO of 16,000,000 shares of our Class A Common Stock, at a public offering price of $18.00 per share. On June 6, 2022, the underwriters’ over-allotment option was partially exercised, resulting in a sale of an additional 2,228,153 shares of Class A Common Stock at a price of $18.00 per share. The IPO and exercise of the underwriters’ over-allotment option generated combined net proceeds of $301.7 million, after deducting underwriter discounts and commissions and estimated offering costs. In connection with our IPO, and the corporate reorganization (see “Note 1 – Organization and Description of Business” in the notes to our consolidated financial statements), we became a holding company.
After giving effect to the corporate reorganization and the IPO, ProFrac Holding Corp. directly and indirectly owned approximately 27.8% of ProFrac LLC, and the Unit Holders owned approximately 72.2% of ProFrac LLC and all of our Class B Common Stock.
46
Acquisition of FTS International, Inc.
On March 4, 2022, ProFrac LLC acquired FTS International, Inc. (“FTSI”) for a purchase price of approximately $405.7 million, consisting of cash consideration of $332.8 million and certain equity interests in ProFrac LLC of $72.9 million (the “FTSI Acquisition”). Prior to the FTSI Acquisition, FTSI was one of the largest providers of hydraulic fracturing services in North America, with 1.3 million HHP as of December 31, 2021. FTSI averaged 13 active fleets in the fourth quarter of 2021, with operations in the Permian Basin, Eagle Ford Shale, Midcontinent, Haynesville Shale and Uinta Basin.
Consolidation of Flotek Industries, Inc.
Through a series of transactions in the first half of 2022, we entered into a supply agreement with Flotek Industries, Inc. (“Flotek”) to provide full downhole chemistry solutions for 30 of our hydraulic fracturing fleets for a period of ten years starting on April 1, 2022. In exchange for entry into the supply agreement, we received $60.0 million in principal amount of convertible notes, and we received the right to designate up to four out of seven directors to Flotek’s board of directors.
Because of our power to appoint directors to the board of directors of Flotek without a direct equity interest in Flotek, we determined that Flotek is a variable interest entity (“VIE”). We further determined that the Company is the primary beneficiary of the VIE, due to our ability to appoint a majority of directors to Flotek’s board of directors. As a result, subsequent to May 17, 2022, the date that Flotek shareholders approved the supply agreement, we have accounted for this transaction as a business combination using the acquisition method of accounting. Accordingly, Flotek’s financial statements have been included in our consolidated financial statements from May 17, 2022.
We believe our investment in and strategic relationship with Flotek demonstrates our commitment to our vertical integration strategy and provides greater control over our supply chain.
Acquisition of SP Silica of Monahans, LLC and SP Silica Sales, LLC
On July 25, 2022, we acquired 100% of the issued and outstanding membership interests of the West Texas subsidiaries of Signal Peak Silica, for a purchase price of $90.0 million in cash (the “Monahans Acquisition”). In connection with the closing of the Monahans Acquisition, we acquired an in-basin frac sand facility and related mining operations in the Permian Basin (the “Monahans Sand Mine”).
Acquisition of U.S. Well Services, Inc.
On November 1, 2022, we acquired U.S. Well Services, Inc. (“USWS”) for a total purchase consideration of $479.1 million, consisting of cash consideration of $195.9 million, issuance of 12.9 million shares of Class A Common Stock valued at $282.0 million, and issuance of Class A Common Stock warrants valued at $1.1 million (the “USWS Acquisition”).
Prior to the USWS Acquisition, USWS was a technology-driven oilfield service company focused on electric-powered pressure pumping services in the United States. The USWS fleets consist mostly of all-electric, mobile pressure pumping equipment and other auxiliary heavy equipment to perform stimulation services. The USWS Clean Fleet® electric fleets replace the traditional engines, transmissions, and radiators used in conventional diesel fleets with electric motors.
Acquisition of Monarch Silica, LLC
On December 23, 2022, we completed the acquisition of the Eagle Ford sand mining operations of Monarch Silica, LLC, and related real estate property, for total purchase consideration of $175 million, consisting of cash consideration of $87.5 million and a secured note payable to the seller, Monarch Capital Holdings, LLC, for the remaining $87.5 million. A portion of the consideration is subject to certain customary post-closing adjustments.
Acquisition of REV Energy Holdings, LLC
On December 30, 2022, we acquired REV Energy Holdings, LLC (“REV”), a privately owned pressure pumping service provider with operations in the Rocky Mountains and Eagle Ford Shale. REV operates three premium frac fleets totaling 204,500 HHP. This acquisition expanded ProFrac’s presence in the Rocky Mountains and Eagle Ford Shale.
We acquired REV for a total purchase consideration of $140.0 million, consisting of (i) a number of shares of Class B Common Stock and Units, valued at $70.0 million, (ii) a secured note payable to BCKW LLC (REV sellers’ representative), with a principal amount of $39.0 million, (iii) approximately $5.5 million in debt assumption, and (iv) cash consideration of $25.5 million. A portion of the total purchase consideration is subject to certain customary post-closing adjustments. The agreement pursuant to which we acquired REV provides for up to $20.0 million of earn-out payments to sellers if certain EBITDA-based performance targets are achieved during 2023.
47
Recent Developments
Acquisition of Producers Services Holdings LLC
On January 3, 2023, we acquired 100% of the issued and outstanding membership interest of Producers Service Holdings LLC, a Delaware limited liability company, an employee-owned pressure pumping services provider serving Appalachia and the Mid-Continent, for approximately $35.0 million of total transaction value, of which approximately half is payable in shares of Class A Common Stock, with the remainder consisting of cash and debt assumption. A portion of the cash consideration is subject to certain customary post-closing adjustments. Through this transaction, we have added three fleets, of which two are currently active, totaling 200,000 HHP as well as a 50,000 square foot manufacturing facility located near Zanesville, OH, through which we plan to expand our manufacturing footprint to support Northeast operations.
Acquisition of Performance Proppants
On February 24, 2023, we acquired 100% of the issued and outstanding membership interest in (i) Performance Proppants, LLC, a Texas limited liability company, (ii) Red River Land Holdings, LLC, a Louisiana limited liability company, (iii) Performance Royalty, LLC, a Louisiana limited liability company, (iv) Performance Proppants International, LLC, a Louisiana limited liability company, and (v) Sunny Point Aggregates, LLC, a Louisiana limited liability company (together, “Performance Proppants”) for an aggregate purchase price of $475.0 million, consisting of (x) $469.0 million in cash and (y) a number of shares of Class A Common Stock equal to $6.0 million. A portion of the cash consideration is subject to certain customary post-closing adjustments. Performance Proppants is a frac sand provider in the Haynesville basin.
See “Note 4 – Business Combinations and Asset Acquisition” and “Note 5 – Investments” in the notes to our consolidated financial statements for additional discussion related to all of our recent acquisitions and investments.
Overall Trends and Outlook
Industry Trends
Demand for well stimulation services and frac sand is primarily driven by the level of drilling and completion activity of E&P companies in the United States. Drilling and completion activity is driven by well profitability and returns, which are influenced by a number of factors, including domestic and international supply and demand for oil and gas and prices for oil and gas, as well as the perceived stability and sustainability of those prices over the longer term.
With the growth in oil and gas demand, E&P activity has increased across all major onshore oil and gas basins in the United States. According to the North American Rig Count reported by Baker Hughes Company (“Baker Hughes”), as of March 17, 2023, the number of active U.S. land drilling rigs increased 15% from March 2022 to March 2023 and 91% from March 2021 to March 2023. Rig activity in our primary areas of operation (Permian Basin, Eagle Ford, Haynesville, Appalachia and the Rockies) has increased substantially over that same period.
We anticipate that the following market dynamics and trends in our industry may benefit our operations and our ability to achieve our business objectives:
Adoption of dynamic gas blending (“DGB”) and electric fleets. E&P operators have increased their focus on improving their emissions profiles. Some of these operators have transitioned from legacy Tier II diesel frac fleets to greener, next-generation Tier IV DGB frac fleets and electric fleets, because Tier IV DGB fleets utilize gas (including natural gas, CNG, LNG, pipeline and field gas) as a cheaper, cleaner fuel source. Rystad Energy anticipates that by the end of 2026, over 70% of active frac fleet horsepower in North America will be utilizing natural gas capable or electric fleets, as compared to 21% in 2020. As a market leader in next-generation fleet technology, we believe we are well positioned to capture additional market share as the shift to cleaner DGB and electric fleets continues.
Obsolescence of significant hydraulic fracturing horsepower in the market. The U.S. frac market is currently facing a pivotal transition with significant fleet capacity nearing retirement due to obsolescence. Prolonged underinvestment, including during the COVID-19 induced industry downturn, has resulted in a deterioration of the condition of operable legacy fleets. Even prior to the recent downturn, substantial legacy capacity had reached the end of its useful life, according to Rystad Energy. Retirement of these fleets is expected to tighten marketed supply while demand growth continues, resulting in expected frac fleet utilization levels in excess of 80% sustained through 2026, according to Rystad Energy. We believe that our vertical integration and lower cost of capital resulting from in-house maintenance and manufacturing of our own frac equipment will allow us to respond to this demand as well as increase our ability to maintain both the condition and utilization rates of our fleets. Over the last several years, we have earned higher margins versus peers (as defined by Adjusted EBITDA margin) that rely on third parties for refurbishment and newbuild fleets at higher cost. Additionally, with 65%+ of active frac capacity among the top five players (according to Rystad Energy), we believe the industry will see increased pricing and efficiency moving forward.
48
According to Rystad, frac fleets averaged ~48,000 HHP per fleet in 2015 and are expected to average ~58,000 HHP per fleet in 2024. We believe that this factor, which reduces the number of required frac fleets in the industry, in conjunction with attrition of older fleets and tight equipment supply, will improve pricing.
Tightening Frac Sand Market. Over the last three years, the growth in demand for frac sand for use in the hydraulic fracturing process has resulted in a significant increase in sand prices as well as constraints on supply availability. According to Rystad Energy, total U.S. frac sand demand is expected to grow by 17.6 million tons (14%) in 2023 compared to 2022) and reach 139 million tons. In 2023, the Permian Basin, Eagle Ford and Haynesville, where we currently operate 8 mines, are expected to collectively account for approximately 74% of the total U.S. demand, according to Rystad Energy. Current frac sand pricing is at its highest levels since 2017, with Permian free on board mine pricing reaching as high as $51/ton in the spot market in 2022, according to Rystad Energy. We believe our vertically integrated business model and recent sand mine investments (Lamesa, Monahans and Monarch), as well as our acquisition of Performance Proppants, position us to capitalize on this increased demand, insulate our operations from rising sand raw material costs and allow us to provide surety of supply to customers in an increasingly tight sand market.
Pivot to In-Basin Sand Supply. The frac sand market has undergone a transformation in recent years. Historically, sand was primarily supplied from sources out-of-basin. However, in recent years, producers have primarily sourced sand from in-basin suppliers due to logistical efficiencies and transportation cost savings.
Trends in E&P Operations. There are several trends within the E&P space which we believe will have a positive impact on our operations moving forward. First, E&P companies are drilling longer laterals. According to Enverus, average lateral length has increased from 5,511 feet in 2013 to 9,240 feet in 2022. Increased drilling time increases the number of frac stages and pump hours required to frac a well. We expect to see higher fleet utilization due to these factors in the future. However, even as lateral lengths have been increasing, there has been a decrease in well performance. E&P well productivity per lateral foot has fallen as operators have been forced to drill more Tier II and Tier III inventory. According to Enverus, in 2022, cumulative oil production per 1,000 feet was ~5% lower through 3 months of production and ~4% lower through 6 months of production relative to 2021. We believe this trend will provide a catalyst to our operations as E&P companies will be forced to drill more to maintain production, requiring more rigs and frac crews which we believe will improve fleet utilization and pricing.
Investor and regulator focus on ESG. The energy industry is undergoing a significant change of operating practices, with industry participants becoming increasingly focused on environmental and social considerations. Companies are experiencing market pressure to implement ESG initiatives, particularly related to environmental sustainability via a reduction of GHG emissions. We believe that state and federal governments are likely to implement increased measures to regulate GHG emissions, increasing pressure on, or requiring, E&P companies to decrease their emissions footprint. Additional ESG topics, such as human rights, supply chain management, water usage, natural capital and biodiversity, among others, are also receiving increased attention, and there may be increasing pressure on our customers to take actions to address these topics as well.
We believe our investment in greener, next-generation fleet technology places us at the forefront of the industry’s move towards a cleaner and more sustainable future and enables us to meet growing customer demand for ESG-sensitive operations.
We believe we are well positioned to capitalize on the continued demand for next generation frac fleets and in-basin frac sand. Our business, which combines a young fleet of modern, technologically advanced pressure pumping equipment with vertically integrated proppant, chemicals and manufacturing, has been purpose-built to capture maximum customer demand across the spectrum of completions operations. Our focus on next-generation fleet technology positions us to serve the growing demand for emissions-friendly solutions while also offering our customers significant fuel cost savings. At the same time, our focus on strategic in-basin sand mine acquisitions allows us to provide surety of supply in an increasingly tight sand market and realize additional margin uplift through our integrated frac service offering.
General Trends
Drilling and completion activities for oil and gas are heavily influenced by oil and gas prices. In 2022, geopolitical tensions in Eastern Europe related to Russia’s invasion of Ukraine have resulted in significant supply disruptions as a broad coalition of countries have responded with sanctions and/or import bans associated with Russian oil and natural gas. This has resulted in significant tightening in the market as reflected by higher commodity prices, with oil and gas prices reaching decade highs. As a result of the FTSI acquisition, our operations have diversified exposure to both natural gas and oil producing areas. Natural gas and oil prices have increased substantially compared to year-end 2020 prices and have also surpassed year-end 2019 (pre-COVID-19) levels.
49
While commodity prices have returned to and exceeded pre-pandemic levels, the pandemic led to supply chain disruptions worldwide. Tariffs, access to employees, increased shipping rates and raw material shortages are impacting markets. Our supply chain is either vertically integrated or predominantly U.S. based, reducing our exposure to global disruptions and allowing us to continue to maintain attractive margins. As our operations are predominantly U.S. based, we have no direct exposure to Russia and Ukraine. We have realized indirect impacts that may have occurred as a result of the crisis, such as increases in the costs of certain raw materials and components we purchase for use in our manufacturing processes. However, given the inflationary climate in the United States and globally, we are unable to determine the extent to which such increased commodity prices are the result of the crisis in Ukraine or a result of other factors. Despite these increases, we have experienced improved results of operations due to increased utilization of our fleets and increased prices for our products and services which have permitted us to maintain and increase our margins notwithstanding such cost increases.
The oil and gas industry is currently undergoing significant realignment of operating practices with a focus on reducing impacts to the environment. Many E&P companies are implementing carbon tracking and reduction initiatives and are expecting oilfield service providers to deliver products and services that utilize the most advanced and environmentally friendly technologies. We believe that companies in the pressure pumping industry with the most technologically advanced fleets and lowest carbon footprint will likely see significant growth in market share at the expense of companies with less advanced equipment. We have embraced tangible initiatives that help to protect the environment and improve our environment and communities making it part of our organizational culture since early in the life of the company. We have and intend to continue to invest in a number of industry leading advanced technologies that reduce carbon emissions while increasing profitability. We are currently upgrading approximately ten engines per month from Tier II to Tier IV DGB. In November 2022 we fully deployed our first electric fleet and have four additional electric fleets under construction, which will bring our total electric fleets to 12 fleets. We believe that these initiatives and commitment to lower emissions will help us lead the energy transition of the frac industry towards cleaner and sustainable business.
How We Generate Revenue
We operate three business segments: stimulation services, proppant production, and manufacturing. Business activities that are not separately reportable, which only included Flotek, are classified in the other category.
Stimulation Services. We own and operate a fleet of mobile hydraulic fracturing units and other auxiliary equipment that generates revenue by providing stimulation services to our customers. We also provide personnel and services that are tailored to meet each of our customers’ needs. We generally do not have long-term written contractual arrangements with our customers other than standard master service agreements, which include general contractual terms between our customers and us. We charge our customers on a per-job basis, in which we set pricing terms after receiving full specifications for the requested job, including the lateral length of the customer’s wellbore, the number of frac stages per well, the amount of proppant employed and other specifications of the job. Well stimulation contains complementary services that we often provide to our customers, including sand and associated logistics, chemicals and fuel.
Proppant Production. We generate revenue by providing proppant to oilfield service providers and E&P companies. We either own or lease, and operate the Monarch Sand Mine in the Eagle Ford basin, and the Monahans Sand Mine, Kermit Sand Mine and Lamesa Sand Mine in the Permian basin and we charge our customers on a per ton of proppant basis at current market prices. We do not have long-term contractual arrangements with our customers with fixed pricing. For the years ended December 31, 2022, 2021 and 2020, intersegment revenues for the proppant production segment were 62%, 40% and 20%, respectively.
Manufacturing. We primarily generate revenue through sales of highly engineered, tight tolerance machined, assembled, and factory tested products such as high horsepower pumps, valves, piping, swivels, large-bore manifold systems, seats, and fluid ends. As of December 31, 2022, we operate facilities in Cisco, Aledo and Fort Worth, Texas, including an ISO 9001 2015 certified OEM manufacturing facility, in which we manufacture and refurbish many of the components used by our fleets, including pumps, fluid ends, power ends, flow iron and other consumables and an engine and transmission rebuild facility that is licensed to provide warranty repairs on our transmissions. Additionally, we provide iron inspection, iron recertification, pump refurbishment, fluid end refurbishment, pump function testing, paint, scrap, and lube system change services. We charge our customers for equipment based on a per-order basis, in which we set pricing terms after receiving full specifications for the requested equipment. We charge our customers for our services based on the parts and labor incurred. For the years ended December 31, 2022, 2021 and 2020, intersegment revenues for the manufacturing segment were 92%, 90% and 97%, respectively.
Costs of Conducting Our Business
The principal costs of products and services involved in operating our business are expendables, personnel, equipment repairs and maintenance and fuel. Our fixed costs are relatively low and a large portion of the costs described below are only incurred as we perform jobs for our customers.
50
Expendables. Expendables used in our stimulation services business are the largest expenses incurred, and include the fuel, product and freight costs associated with proppant, chemicals and other consumables. Fuel is consumed both in the operation and movement of our hydraulic fracturing fleets and other equipment. In our proppant production business, fuel to run equipment is one of our major expenses. These costs comprise a substantial variable component of our service costs, particularly with respect to the quantity and quality of sand demanded when providing hydraulic fracturing services.
Raw Materials. Our manufacturing segment relies on various raw materials, specifically various grades of steel and other raw metals, and electricity.
Direct Labor Costs. Payroll and benefit expenses directly related to the delivery of our products and services are included in our operating costs.
Other Direct Costs. We incur other expenses related to our products and service offerings, including the costs of repairs and maintenance, general supplies, equipment rental and other miscellaneous operating expenses. Capital expenditures to upgrade or extend the useful life of equipment are not included in other direct costs.
How We Evaluate Our Operations
Our management uses a variety of financial and operating metrics to evaluate and analyze the performance of our business, including Adjusted EBITDA.
Note Regarding Non-GAAP Financial Measures
Adjusted EBITDA is not a financial measure presented in accordance with generally accepted accounting principles in the United States (“GAAP”) and should not be considered as a substitute for net income, net loss, operating loss or any other performance measure derived in accordance with GAAP or as an alternative to net cash provided by operating activities as a measure of our profitability or liquidity. Adjusted EBITDA is a supplemental measure utilized by our management and other users of our financial statements such as investors, commercial banks, research analysts and others, to assess our financial performance because it allows us to compare our operating performance on a consistent basis across periods by removing the effects of our capital structure (such as varying levels of interest expense), asset base (such as depreciation and amortization) and items outside the control of our management team (such as income tax rates).
We view Adjusted EBITDA as an important indicator of performance. We define Adjusted EBITDA as our net income (loss), before (i) interest expense, net, (ii) income tax expense, (iii) depreciation, depletion and amortization, (iv) loss on disposal of assets, (v) stock-based compensation, and (vi) other unusual or non-recurring charges, such as costs related to our initial public offering, non-recurring supply commitment charges, certain credit losses, loss on extinguishment of debt and gain on investments.
We believe that our presentation of Adjusted EBITDA will provide useful information to investors in assessing our financial condition and results of operations. Net income (loss) is the GAAP measure most directly comparable to Adjusted EBITDA. Adjusted EBITDA should not be considered as an alternative to net income (loss). Adjusted EBITDA has important limitations as an analytical tool because it excludes some but not all items that affect the most directly comparable GAAP financial measure. You should not consider Adjusted EBITDA in isolation or as a substitute for an analysis of our results as reported under GAAP. Because Adjusted EBITDA may be defined differently by other companies in our industry, our definition of this non-GAAP financial measure may not be comparable to similarly titled measures of other companies, thereby diminishing its utility.
51
The following table presents a reconciliation of Adjusted EBITDA from net income (loss), our most directly comparable financial measure calculated and presented in accordance with GAAP:
|
|
Year Ended December 31, |
|
|||||||||
|
|
2022 |
|
|
2021 |
|
|
2020 |
|
|||
Net income (loss) |
|
$ |
342.7 |
|
|
$ |
(43.5 |
) |
|
$ |
(118.5 |
) |
Interest expense, net |
|
|
59.5 |
|
|
|
25.8 |
|
|
|
23.3 |
|
Depreciation, depletion and amortization |
|
|
267.3 |
|
|
|
140.7 |
|
|
|
150.7 |
|
Income tax (benefit) expense |
|
|
9.1 |
|
|
|
(0.2 |
) |
|
|
0.5 |
|
Loss on disposal of assets, net |
|
|
2.1 |
|
|
|
9.8 |
|
|
|
8.4 |
|
Loss on extinguishment of debt |
|
|
17.6 |
|
|
|
0.5 |
|
|
|
- |
|
Accruals for legal contingencies |
|
|
11.3 |
|
|
|
- |
|
|
|
- |
|
Stock-based compensation |
|
|
8.1 |
|
|
|
- |
|
|
|
- |
|
Stock-based compensation related to deemed contributions |
|
|
59.3 |
|
|
|
- |
|
|
|
- |
|
Provision for credit losses, net of recoveries |
|
|
1.9 |
|
|
|
(1.2 |
) |
|
|
2.8 |
|
Loss on foreign currency transactions |
|
|
- |
|
|
|
0.2 |
|
|
|
- |
|
Reorganization costs |
|
|
- |
|
|
|
2.1 |
|
|
|
- |
|
Acquisition related expenses |
|
|
48.8 |
|
|
|
- |
|
|
|
- |
|
Severance charges |
|
|
- |
|
|
|
0.5 |
|
|
|
- |
|
Supply commitment charges |
|
|
- |
|
|
|
- |
|
|
|
5.6 |
|
Unrealized gain on investments, net |
|
|
(16.5 |
) |
|
|
- |
|
|
|
- |
|
Adjusted EBITDA |
|
$ |
811.2 |
|
|
$ |
134.7 |
|
|
$ |
72.8 |
|
Factors Affecting The Comparability of Our Financial Results
Our future results of operations may not be comparable to our historical results of operations for the reasons described below:
Recent Acquisitions
We have grown recently through strategic acquisitions and investments, including through our recently completed acquisitions of FTSI, West Munger, Monahans, USWS, Monarch, REV, Producers, Performance Proppants and our consolidation of Flotek. These acquisitions are not reflected in our historical results of operations for the period prior to the closing of each such acquisition and our future results will differ as a result.
In addition, in connection with our acquisitions, we have recorded the acquired assets and liabilities at fair value on the date of acquisition, which has impacted deferred revenue and deferred costs balances and increased revenue and expenses from that which would have otherwise been recognized in subsequent periods. We also recorded identifiable intangible assets that are amortized over their useful lives, increasing expenses from that which would otherwise have been recognized.
Public Company Expenses
We expect to incur additional recurring administrative expenses as a result of becoming a publicly traded corporation that we have not previously incurred, including costs associated with compliance under the Exchange Act, annual and quarterly reports to shareholders, transfer agent fees, audit fees, incremental director and officer liability insurance costs, SOX compliance readiness, and director and officer compensation. We additionally expect to incur approximately $3 million in incremental, non-recurring costs related to our transition to a publicly traded corporation.
Income Taxes
ProFrac Holding Corp. is a corporation and will be subject to U.S. federal, state and local income taxes. Although the ProFrac Predecessor entities are subject to franchise tax in the State of Texas, they have historically been treated as pass-through entities for U.S. federal and other state and local income tax purposes and as such were not subject to U.S. federal income taxes or other state or local income taxes. Rather, the tax liability with respect to the taxable income of the ProFrac Predecessor entities was passed through to their owners. Accordingly, prior to the March 2022 acquisition of FTSI, a corporation subject to U.S. federal and state income tax, the financial data attributable to ProFrac Predecessor contains no provision for U.S. federal income taxes or income taxes in any state or locality (other than franchise tax in the State of Texas). Subsequent to the acquisition of FTSI in March 2022, the financial data of the ProFrac Predecessor does contain both U.S. federal and state income taxes. We estimate that we will be subject to U.S. federal and state taxes at a blended statutory rate of approximately 24% of pre-tax earnings. Additionally, with the acquisition of EKU, the Company is subject to certain foreign taxes, which were immaterial for the year ended December 31, 2022.
52
Effective March 4, 2022 we account for income taxes under the asset and liability method. Under this method, deferred tax assets and liabilities are recognized for the estimated future tax consequences attributable to differences between the financial statement carrying amounts of existing assets and liabilities and their respective tax basis. Deferred tax assets and liabilities are measured using enacted tax rates in effect for the year in which those temporary differences are expected to be recovered or settled pursuant to the provisions of Accounting Standards Codification (“ASC”) 740, Income Taxes. The effect on deferred tax assets and liabilities of a change in tax rate is recognized in earnings in the period that includes the enactment date. Valuation allowances are established when necessary to reduce deferred tax assets to the amounts more likely than not to be realized.
We recorded a valuation allowance on substantially all of our net deferred tax assets based on our assessment that it is more likely than not that the deferred tax assets will not be realized. Flotek net deferred tax assets also have a full valuation allowance with the exception of $0.4 million. A change in these assumptions could cause a decrease to the valuation allowance, which could materially impact our results of operations.
Results of Operations
Year Ended December 31, 2022
Revenues
Total revenues for the year ended December 31, 2022 was $2,425.6 million an increase of $1,657.2 million and $1,877.9 million from the same periods in 2021 and 2020, respectively. The increase was primarily attributable to an increase in customer activity for our stimulation services, and an increase in active fleets, pumping hours and pricing. Additionally, the acquisitions of FTSI and USWS during the year contributed to the increase in revenues.
The following table summarizes our reportable segment revenues and certain operating statistics:
|
|
Year Ended December 31, |
|
|||||||||
|
|
2022 |
|
|
2021 |
|
|
2020 |
|
|||
Revenues: |
|
|
|
|
|
|
|
|
|
|||
Stimulation Services |
|
$ |
2,348.7 |
|
|
$ |
745.4 |
|
|
$ |
538.3 |
|
Proppant Production |
|
|
90.0 |
|
|
|
27.2 |
|
|
|
10.2 |
|
Manufacturing |
|
|
166.7 |
|
|
|
76.4 |
|
|
|
46.2 |
|
Other |
|
|
111.8 |
|
|
|
- |
|
|
|
- |
|
Eliminations |
|
|
(291.6 |
) |
|
|
(80.6 |
) |
|
|
(47.0 |
) |
Total revenues |
|
$ |
2,425.6 |
|
|
$ |
768.4 |
|
|
$ |
547.7 |
|
Operating Statistics: |
|
|
|
|
|
|
|
|
|
|||
Active fleets (1) |
|
|
38.0 |
|
|
|
14.0 |
|
|
|
11.0 |
|
Baker Hughes Domestic Average Rig Count—Onshore (2) |
|
|
660.0 |
|
|
|
430.0 |
|
|
|
385.0 |
|
Average oil price (per barrel) (3) |
|
$ |
94.79 |
|
|
$ |
67.99 |
|
|
$ |
39.23 |
|
Average natural gas price (per thousand cubic feet) (4) |
|
$ |
6.67 |
|
|
$ |
4.06 |
|
|
$ |
2.11 |
|
Revenues—Stimulation Services. Stimulation services revenues for the year ended December 31, 2022 increased $1,603.3 million, or 215%, and $1,810.4 million, or 336%, respectively from the same periods in 2021 and 2020. The increase was primarily attributable to an increase in customer activity for our stimulation services, and an increase in active fleets, pumping hours and pricing. Additionally, FTSI and USWS contributed revenue to this segment from their acquisition dates.
Revenues—Proppant Production. Proppant production revenues for the year ended December 31, 2022 increased $62.8 million, or 231%, and $79.8 million, or 782%, respectively from the same periods in 2021 and 2020. The increase was primarily attributable to an increase in proppant production and pricing resulting from increased proppant demand primarily in the Permian basin. Additionally, Monahans contributed revenue to this segment from its acquisition date.
Revenues—Manufacturing. Manufacturing revenues for the year ended December 31, 2022 increased $90.3 million, or 118%, and $120.5 million, or 261%, respectively from the same periods in 2021 and 2020. The increase was primarily attributable to increased activity in our stimulation services segment.
Revenues—Other. Other revenues for the year ended December 31, 2022 was $111.8 million, which represents the revenue from Flotek.
53
Cost of Revenues
The following table summarizes our cost of revenues by segment:
|
|
Year Ended December 31, |
|
|||||||||
|
|
2022 |
|
|
2021 |
|
|
2020 |
|
|||
Cost of revenues, exclusive of depreciation, depletion, and amortization: |
|
|
|
|
|
|
|
|
|
|||
Stimulation Services |
|
$ |
1,433.6 |
|
|
$ |
570.8 |
|
|
$ |
427.5 |
|
Proppant Production |
|
|
40.5 |
|
|
|
14.1 |
|
|
|
6.1 |
|
Manufacturing |
|
|
137.5 |
|
|
|
65.8 |
|
|
|
40.4 |
|
Other |
|
|
118.4 |
|
|
|
- |
|
|
|
- |
|
Eliminations |
|
|
(291.3 |
) |
|
|
(80.6 |
) |
|
|
(47.0 |
) |
Total cost of revenues, exclusive of depreciation, depletion, and amortization |
|
$ |
1,438.7 |
|
|
$ |
570.1 |
|
|
$ |
427.0 |
|
Total cost of revenues, exclusive of depreciation, depletion, and amortization for the year ended December 31, 2022 was $1,438.7 million an increase of $868.6 million and $1,011.7 million from the same periods in 2021 and 2020, respectively. The increase was primarily attributable to an increase in customer activity for our stimulation services. Additionally, the acquisitions of FTSI and USWS during the year contributed to the increase in cost of revenues.
Cost of Revenues, Exclusive of Depreciation, Depletion, and Amortization—Stimulation Services. Stimulation services cost of revenues for the year ended December 31, 2022 increased $862.8 million, or 151%, and $1,006.1 million, or 235%, respectively from the same periods in 2021 and 2020. The increase was primarily due to an increase in customer activity levels and increased prices for proppant and chemicals used in the fracturing process. Additionally, FTSI and USWS contributed cost to this segment from their acquisition dates.
Cost of Revenues, Exclusive of Depreciation, Depletion, and Amortization—Proppant Production. Proppant production cost of revenues for the year ended December 31, 2022 increased $26.4 million, or 187%, and $34.4 million, or 564%, respectively from the same periods in 2021 and 2020. The increase was primarily attributable to an increase in proppant production to meet increased customer demand. Additionally, Monahans contributed costs to this segment from its acquisition date.
Cost of Revenues, Exclusive of Depreciation, Depletion, and Amortization—Manufacturing. Manufacturing cost of revenues for the year ended December 31, 2022 increased $71.7 million, or 109%, and $97.1 million, or 240%, respectively from the same periods in 2021 and 2020. The increase was primarily attributable to increased activity in our stimulation services segment as well as higher prices for the cost of raw materials.
Cost of Revenues, Exclusive of Depreciation, Depletion, and Amortization—Other. Other cost of revenues for the year ended December 31, 2022 was $118.4 million, which represents the revenue from Flotek.
Selling, General and Administrative
The following table summarizes our selling, general and administrative expenses:
|
|
Year Ended December 31, |
|
|||||||||
|
|
2022 |
|
|
2021 |
|
|
2020 |
|
|||
Selling, general and administrative: |
|
|
|
|
|
|
|
|
|
|||
Selling, general and administrative, excluding stock-based compensation |
|
$ |
175.7 |
|
|
$ |
64.2 |
|
|
$ |
48.2 |
|
Stock-based compensation related to deemed contributions |
|
|
59.3 |
|
|
|
- |
|
|
|
- |
|
Stock-based compensation |
|
|
8.1 |
|
|
|
- |
|
|
|
- |
|
Total selling, general and administrative |
|
$ |
243.1 |
|
|
$ |
64.2 |
|
|
$ |
48.2 |
|
Selling, general and administrative expenses for the year ended December 31, 2022 was $243.1 million an increase of $178.9 million and $194.9 million from the same periods in 2021 and 2020, respectively.
The increase was primarily due to increased headcount, incentive compensation and non-labor costs associated with our increased activity levels and 2022 acquisitions. The increase was also due to stock-based compensation expense in 2022, primarily related to expense associated with certain deemed shareholder contributions. See “Note 10 – Stock-based Compensation” in the notes to our consolidated financial statements for more information on our stock-based compensation.
54
Depreciation, Depletion, and Amortization
The following table summarizes our depreciation, depletion, and amortization:
|
|
Year Ended December 31, |
|
|||||||||
|
|
2022 |
|
|
2021 |
|
|
2020 |
|
|||
Depreciation, Depletion, and Amortization |
|
|
|
|
|
|
|
|
|
|||
Depreciation |
|
$ |
261.2 |
|
|
$ |
139.9 |
|
|
$ |
150.6 |
|
Amortization |
|
|
5.6 |
|
|
|
0.6 |
|
|
|
- |
|
Depletion |
|
|
0.5 |
|
|
|
0.2 |
|
|
|
0.1 |
|
Total selling, general and administrative |
|
$ |
267.3 |
|
|
$ |
140.7 |
|
|
$ |
150.7 |
|
Depreciation, depletion, and amortization for the year ended December 31, 2022 was $267.3 million compared to $140.7 million and $150.7 million for the same periods in 2021 and 2020, respectively. The increase was primarily due to increased capital expenditure in 2022 and the depreciation related to the assets acquired from FTSI and USWS acquisition.
Acquisition Related Expenses
Acquisition related expenses for the year ended December 31, 2022 was $48.8 million compared to zero for the same periods in 2021 and 2020, respectively. These costs related to our acquisition and integration activities in 2022.
Other Operating Expenses, Net
The following table summarizes our other operating expenses, net:
|
|
Year Ended December 31, |
|
|||||||||
|
|
2022 |
|
|
2021 |
|
|
2020 |
|
|||
Loss on disposal of assets, net |
|
$ |
2.1 |
|
|
$ |
9.8 |
|
|
$ |
8.4 |
|
Accruals for legal contingencies |
|
|
11.3 |
|
|
|
- |
|
|
|
- |
|
Provision for credit losses, net of recoveries |
|
|
1.9 |
|
|
|
(1.2 |
) |
|
|
2.8 |
|
Loss on foreign currency transactions |
|
|
- |
|
|
|
0.2 |
|
|
|
- |
|
Reorganization costs |
|
|
- |
|
|
|
2.1 |
|
|
|
- |
|
Severance charges |
|
|
- |
|
|
|
0.5 |
|
|
|
- |
|
Supply commitment charges |
|
|
- |
|
|
|
- |
|
|
|
5.6 |
|
Total |
|
$ |
15.3 |
|
|
$ |
11.4 |
|
|
$ |
16.8 |
|
Loss on disposal of assets, net consists of gains or losses on excess property, early equipment failures, and other asset dispositions.
Accruals for legal contingencies represent estimates for significant loss contingencies with regards to certain vendor disputes and litigation matters. See “Note 13 - Commitments and Contingencies” in the notes to the consolidated financial statements for discussion of significant litigation matters.
Interest Expense, Net
Interest expense, net for the year ended December 31, 2022 was $59.5 million compared to $25.8 million and $23.3 million for the same periods in 2021 and 2020, respectively. The increase in interest expense, net was attributable to our increased debt balances, and higher average interest rates in 2022. See “Note 6 – Debt” in the notes to our consolidated financial statements for additional discussion related to our debt.
Loss on Extinguishment of Debt
As a result of debt refinancing transactions and debt repayments in 2022, we recognized a loss on extinguishment of debt for the year ended December 31, 2022 of $17.6 million compared to $0.5 million and zero for the same periods in 2021 and 2020, respectively.
Other (Expense) Income, Net
For the year ended December 31, 2022, we recognized unrealized gains of $16.5 million related to the change in fair value of the Flotek Convertible Notes before we obtained control of Flotek and our investment in BPC.
Income Tax (Expense) Benefit
Income tax expense for the year ended December 31, 2022 was $9.1 million compared to income tax benefit of $0.2 million and income tax expense of $0.5 million for the same periods in 2021 and 2020, respectively. The increase in 2022 income tax expense is due to the Company’s corporate reorganization to a taxable entity subsequent to the IPO.
55
Year Ended December 31, 2021
For a discussion of our Predecessor’s results of operations for the year ended December 31, 2021, please refer to the Management’s Discussion and Analysis of Financial Condition and Results of Operations of ProFrac in the Amendment No. 1 to the Registration Statement on Form S-4 filed by the Issuer on September 22, 2022 (Registration Statement No. 333-267168).
Liquidity and Capital Resources
Sources of Liquidity
Historically, our primary sources of liquidity and capital resources have been borrowings under our credit facilities, cash flows from our operations and capital contributions from our shareholders. We expect that our primary uses of capital will be to continue to fund our operations, support organic and strategic growth opportunities and satisfy future debt payments.
Due to our determination that Flotek is a VIE of which the Company is the primary beneficiary, Flotek’s financial statements have been included in our consolidated financial statements from May 17, 2022. However, we do not have the ability to access or use Flotek’s cash or liquidity in our operations and, accordingly, have excluded Flotek’s cash and other sources of liquidity from the following discussion of our liquidity and capital resources. Refer to “Note 4 – Business Combinations and Asset Acquisition” in the notes to our consolidated financial statements for additional discussion related to the acquisition of Flotek.
At December 31, 2022, we had $22.8 million of cash and cash equivalents, excluding Flotek, and $35.2 million available for borrowings under our revolving credit facility which resulted in a total liquidity position of $58.0 million. Refer to “Note 6 – Debt” in the notes to our consolidated financial statements for more information regarding our revolving credit facility.
In February 2023, our revolving credit facility was amended to increase the maximum availability to $400.0 million in connection with our acquisition of Performance Proppants. Refer to “Note 18 – Subsequent Events” in the notes to our consolidated financial statements for more information regarding the acquisition of Performance Proppants.
At February 28, 2023, we had $78.7 million of cash and cash equivalents, excluding Flotek, and $72.3 million available for borrowings under our revolving credit facility which resulted in a total liquidity position of $151.0 million.
We believe that our cash and cash equivalents, cash provided by operations, and the availability under our revolving credit facility will be sufficient to fund our capital expenditures, satisfy our obligations, and remain in compliance with our existing debt covenants for at least the next 12 months. If we pursue additional acquisitions during 2023 we will likely need to raise additional debt and/or equity financing to fund them.
Financing of Potential Acquisitions
Our growth strategy includes potential acquisitions and other strategic transactions, and from time to time we enter into non-binding letters of intent to make investments or acquisitions. These letters of intent may provide for purchase consideration including cash, notes payable by us, equity of ProFrac, or some combination, the use of which could impact our liquidity needs. These potential transactions are subject to the completion of satisfactory due diligence, the negotiation and resolution of significant business and legal issues, the negotiation, documentation and completion of mutually satisfactory definitive agreements among the parties, the consent of our lenders, our ability to finance any cash payment at closing, and approval of the ProFrac board of directors. We cannot guarantee that any such potential transaction would be completed on acceptable terms, if at all.
Flotek Liquidity
In Flotek’s Form 10-K filed on March 23, 2023, Flotek concluded that there was substantial doubt about its ability to continue as a going concern due to limited sources of liquidity. Flotek is evaluating strategies to obtain additional funding to improve its liquidity position and believes it will be able to continue to fund its operations. We believe that substantial doubt about Flotek’s ability to continue as a going concern does not materially adversely affect our business, financial condition or results of operations as we do not guarantee any Flotek liabilities and we have access to other chemical suppliers.
Working Capital
Our working capital was $197.3 million and $5.0 million as of December 31, 2022 and 2021, respectively. The $192.3 million increase in working capital was primarily due to higher activity levels and our business combinations in 2022.
56
Cash Flows
The following table provides a summary of our cash flows:
|
|
Year Ended December 31, |
|
|||||||||
|
|
2022 |
|
|
2021 |
|
|
2020 |
|
|||
Net cash provided by (used in): |
|
|
|
|
|
|
|
|
|
|||
Operating activities |
|
$ |
415.2 |
|
|
$ |
43.9 |
|
|
$ |
45.1 |
|
Investing activities |
|
|
(1,028.6 |
) |
|
|
(78.4 |
) |
|
|
(44.6 |
) |
Financing activities |
|
|
645.9 |
|
|
|
36.9 |
|
|
|
(15.3 |
) |
Net change in cash, cash equivalents, and restricted cash |
|
$ |
32.5 |
|
|
$ |
2.4 |
|
|
$ |
(14.8 |
) |
Operating Activities. Net cash provided by operating activities was $415.2 million, $43.9 million and $45.1 million for the years ended December 31, 2022, 2021 and 2020, respectively. The increase was primarily due to higher activity levels and profitability, offset by working capital increases in 2022.
Investing Activities. Net cash used in investing activities was $1,028.6 million, $78.4 million and $44.6 million for the years ended December 31, 2022, 2021 and 2020, respectively. The increase was primarily due to $640.7 in net cash paid for acquisitions and higher capital expenditures of $268.8 million related to dual fuel engine upgrades, engine standby controller installations, and our electric frac fleet build program. These uses of cash were partially offset by cash proceeds from the FTSI Sale Leaseback of real property.
Financing Activities. Net cash provided by financing activities was $645.9 million and $36.9 million for the years ended December 31, 2022 and 2021, respectively, compared to net cash used in financing activities of $15.3 million for the year ended December 31, 2020. The increase in cash provided by financing activities was due to proceeds from the issuance of long-term debt associated with refinancing transactions related to the FTSI acquisition, proceeds from upsizing the 2022 ABL Credit Facility, and proceeds from our IPO. These proceeds were offset by debt repayments.
Debt Obligations
The following table summarizes our outstanding indebtedness as of December 31, 2022:
|
|
2023 |
|
|
2024 |
|
|
2025 |
|
|
2026 |
|
|
2027 |
|
|
Thereafter |
|
|
Total |
|
|||||||
2022 ABL Credit Facility |
|
$ |
- |
|
|
$ |
- |
|
|
$ |
- |
|
|
$ |
- |
|
|
$ |
234.3 |
|
|
$ |
- |
|
|
$ |
234.3 |
|
2022 Term Loan Credit Facility |
|
|
26.0 |
|
|
|
26.0 |
|
|
|
467.2 |
|
|
|
- |
|
|
|
- |
|
|
|
- |
|
|
|
519.2 |
|
First Financial loan |
|
|
16.6 |
|
|
|
- |
|
|
|
- |
|
|
|
- |
|
|
|
- |
|
|
|
- |
|
|
|
16.6 |
|
REV Note (1) |
|
|
24.2 |
|
|
|
8.5 |
|
|
|
6.3 |
|
|
|
- |
|
|
|
- |
|
|
|
- |
|
|
|
39.0 |
|
Monarch Note |
|
|
32.8 |
|
|
|
54.7 |
|
|
|
- |
|
|
|
- |
|
|
|
- |
|
|
|
- |
|
|
|
87.5 |
|
Finance Lease Liabilities |
|
|
2.5 |
|
|
|
2.5 |
|
|
|
2.1 |
|
|
|
1.3 |
|
|
|
0.9 |
|
|
|
- |
|
|
|
9.3 |
|
Flotek Convertible Notes |
|
|
12.7 |
|
|
|
- |
|
|
|
- |
|
|
|
- |
|
|
|
- |
|
|
|
- |
|
|
|
12.7 |
|
Equify Note (1) |
|
|
5.0 |
|
|
|
5.0 |
|
|
|
5.0 |
|
|
|
5.0 |
|
|
|
3.8 |
|
|
|
- |
|
|
|
23.8 |
|
Equipment Financings |
|
|
3.6 |
|
|
|
1.5 |
|
|
|
- |
|
|
|
- |
|
|
|
- |
|
|
|
- |
|
|
|
5.1 |
|
Other |
|
|
4.2 |
|
|
|
5.7 |
|
|
|
1.4 |
|
|
|
0.1 |
|
|
|
0.1 |
|
|
|
0.4 |
|
|
|
11.9 |
|
Total |
|
$ |
127.6 |
|
|
$ |
103.9 |
|
|
$ |
482.0 |
|
|
$ |
6.4 |
|
|
$ |
239.1 |
|
|
$ |
0.4 |
|
|
$ |
959.4 |
|
(1) Related party debt agreements.
See “Note 6 – Debt” and “Note 7 - Leases” in the notes to our consolidated financial statements for the discussion of our various debt agreements and operating and capital leases, respectively.
On December 30, 2022, the 2022 Term Loan Credit Facility was amended to provide the option to request borrowings of delayed draw term loans, in an aggregate principal amount not to exceed $150 million, $80 million of which was borrowed on January 4, 2023 and the remaining $70 million of which was borrowed on January 20, 2023. On February 1, 2023, the 2022 Term Loan Credit Facility was amended to increase the size of the 2022 Term Loan Credit Facility by $170 million. On February 23, 2023, the 2022 Term Loan Credit Facility was further amended to provide for more flexibility in certain debt financings, the addition of a most favored nation adjustment to the 2022 Term Loan Credit Facility in the event that any obligor enters into certain debt financings, and permit our acquisition of Performance Proppants (see below). The outstanding principal balance of the 2022 Term Loan Credit Facility after these amendments and borrowings was $839.2 million.
In January and February 2023, we repaid all amounts outstanding under the 2022 ABL Credit Facility with the proceeds from the additional borrowings under the 2022 Term Loan Credit Facility discussed above. On February 23, 2023 the 2022 ABL Credit Facility was amended to, among other things, provide for more flexibility in debt financing, increase the maximum availability to $400.0 million, and permit our acquisition of Performance Proppants (see below). In February 2023, we borrowed $317.0 million to help fund the acquisition of Performance Proppants and for other general corporate purposes.
57
Purchase Commitments
We have purchase agreements and orders placed for hydraulic fracturing equipment related to the buildout of our Nyx Clean Fleets®. As of December 31, 2022, we have purchase commitments of $21.0 million due in the next twelve months under these agreements and purchase orders.
Capital Expenditures
During the years ended December 31, 2022, 2021 and 2020, our capital expenditures were $356.2 million, $87.4 million and $48.0 million, respectively. The primary drivers of the increase were increased maintenance capital expenditures for our larger fleet, building electric-powered hydraulic fracturing fleets, engine upgrades as part of our ESG focus, and the construction of our Lamesa sand mine.
For 2023, we expect capital expenditures to be in line with 2022, excluding the effect of acquisitions. We have budgeted approximately 15% of this amount to complete the construction of four electric-powered fleets. We also expect to allocate roughly 30% of our 2023 capital expenditure budget to complete engine upgrades and other growth initiatives, as well as another 15% for various initiatives in our proppant production and manufacturing segments. The remainder of the 2023 capital expenditure budget will be used to fund maintenance capital expenditures, estimated to be $3.0 million to $3.5 million per fleet per year.
We continually evaluate our capital expenditures and the amount that we ultimately spend will depend on a number of factors, including customer demand for new fleets and expected industry activity levels. We believe we will be able to fund our 2023 capital program from cash flows from operations.
Tax Receivable Agreement
On May 17, 2022, in connection with its IPO, the Issuer entered into a tax receivable agreement (the “TRA”) with certain of Unit holders of ProFrac LLC (the “TRA Holders”). The TRA generally provides for the payment by the Issuer to each TRA Holder of 85% of the net cash savings, if any, in U.S. federal, state and local income tax and franchise tax (computed using simplifying assumptions to address the impact of state and local taxes) actually realized (or deemed to have been realized in certain circumstances) as a result of (i) certain increases in tax basis that occur as a result of the Issuer’s acquisition (or deemed acquisition for U.S. federal income tax purposes) of all or a portion of such TRA Holder’s Units of ProFrac LLC in connection with the IPO or pursuant to an exercise of the Redemption Right (as defined in the TRA) or the Call Right (as defined in the TRA) and (ii) imputed interest deemed to be paid by us as a result of, and additional tax basis arising from, any payments made under the TRA. The Issuer depends on ProFrac LLC to make distributions to us in an amount sufficient to cover its obligations under the TRA.
Payments will generally be made under the TRA as the Issuer realizes actual cash tax savings from the tax benefits covered by the TRA. However, if there is a Change of Control of the Issuer (as defined in the TRA), or the TRA otherwise terminates early, the Issuer’s obligations under the TRA would accelerate and the present value of the anticipated future payments to be made by it under the TRA (determined by applying a discount rate) would become immediately due and payable. Any such payment is expected to be substantial. See the discussion in Item 9B of this Annual Report for additional information.
Off-Balance Sheet Arrangements
From time-to-time, we enter into off-balance sheet arrangements and transactions that can give rise to off-balance sheet obligations. As of December 31, 2022 and 2021, the off-balance sheet arrangements and transactions that we have entered into include undrawn letters of credit. We do not believe that these arrangements are reasonably likely to materially affect our liquidity or availability of, or requirements for, capital resources.
Critical Accounting Policies and Estimates
The discussion and analysis of our financial condition and results of operations is based on our consolidated financial statements, which have been prepared in accordance with accounting principles generally acceptable in the United States of America. The preparation of these consolidated financial statements requires us to make estimates and assumptions that affect the reported amounts of assets and liabilities and the disclosure of contingent assets and liabilities at the dates of the consolidated financial statements and the reported revenues and expenses during the reporting periods. We evaluate these estimates and assumptions on an ongoing basis and base our estimates on historical experience, current conditions and various other assumptions that we believe to be reasonable under the circumstances. The results of these estimates form the basis for making judgments about the carrying values of assets and liabilities as well as identifying and assessing the accounting treatment with respect to commitments and contingencies. Our actual results may materially differ from these estimates.
58
Listed below are the accounting policies that we believe are critical to our consolidated financial statements due to the degree of uncertainty regarding the estimates or assumptions involved, and that we believe are critical to the understanding of our operations. See “Note 2 - Summary of Significant Accounting Policies” in the notes to our consolidated financial statements for additional information on all our significant accounting policies.
Property, Plant and Equipment
Our property and equipment are recorded at cost, less accumulated depreciation.
Upon sale or retirement of property and equipment, the cost and related accumulated depreciation are removed from the consolidated balance sheet and the net amount, less proceeds from disposal, is recognized as a gain or loss in earnings.
The estimated useful lives and salvage values of property and equipment is subject to key assumptions such as maintenance, utilization and job variation. Unanticipated future changes in these assumptions could negatively or positively impact our net income. The determination of the appropriate useful life of our property and equipment requires significant judgment resulting from the demanding operating environments in which we conduct our business as well as the significant volatility and demand fluctuations we have seen in our industry in recent years. A significant change in our established useful lives could cause depreciation expenses to fluctuate materially.
Business Combinations
Business combinations are accounted for under the acquisition method of accounting. Under this method, the assets acquired and liabilities assumed are recognized at their respective fair values as of the date of acquisition. The excess, if any, of the acquisition price over the fair values of the assets acquired and liabilities assumed is recorded as goodwill. For significant acquisitions, we utilize third-party appraisal firms to assist us in determining the fair values for certain assets acquired and liabilities assumed. The measurement of these fair values requires us to make significant estimates and assumptions which are inherently uncertain.
Adjustments to the fair values of assets acquired and liabilities assumed are made until we obtain all relevant information regarding the facts and circumstances that existed as of the acquisition date (the “measurement period”), not to exceed one year from the date of the acquisition. We recognize measurement-period adjustments in the period in which we determine the amounts, including the effect on earnings of any amounts we would have recorded in previous periods if the accounting had been completed at the acquisition date.
The estimation of net assets acquired in business combinations requires significant judgment in determination of the fair value of the assets and liabilities acquired. Our fair value estimates require us to use significant observable and unobservable inputs. The estimates of fair value are also subject to significant variability, are sensitive to changes in market conditions, and are reasonably likely to change in the future. A significant change in the observable and unobservable inputs and determination of fair value of the assets and liabilities acquired could significantly impact our consolidated financial statements.
Tax Receivable Agreement
In connection with our IPO, ProFrac Corp. entered into a tax receivable agreement (the “TRA”) with certain Unit holders (the “TRA Holders”). The TRA generally provides for payment by ProFrac Corp. to the TRA Holders of 85% of the net cash savings, if any, in U.S. federal, state and local income tax and franchise tax (computed using simplifying assumptions to address the impact of state and local taxes) that ProFrac Corp. actually realizes (or is deemed to realize in certain circumstances) as a result of (i) certain increases in tax basis that occur as a result of ProFrac Corp.’s acquisition (or deemed acquisition for U.S. federal income tax purposes) of all or a portion of such TRA Holder’s Units in connection with the IPO or the exercise of the Redemption Right (as defined in the TRA) or the Call Right (as defined in the TRA), and (ii) imputed interest deemed to be paid by ProFrac Corp. as a result of, and additional tax basis arising from, any payments ProFrac Corp. makes under the TRA. ProFrac Corp. will be dependent on ProFrac LLC to make distributions to ProFrac Corp. in an amount sufficient to cover ProFrac Corp.’s obligations under the TRA. ProFrac Corp. will retain the benefit of the remaining 15% of any actual net cash tax savings. The payment obligations under the TRA are ProFrac Corp.’s obligations and not obligations of ProFrac LLC, and we expect that the payments required to be made under the TRA could be substantial.
The term of the TRA commenced upon the completion of the IPO and will continue until all tax benefits that are subject to the TRA have been utilized or expired, unless we experience a Change of Control (as defined in the TRA, which includes certain mergers, asset sales, or other forms of business combinations) or the TRA otherwise terminates early (at our election or as a result of our breach or the commencement of bankruptcy or similar proceedings by or against us) and ProFrac Corp. makes the termination payments specified in the TRA in connection with such Change of Control or other early termination. In the event that the TRA is not terminated, the payments under the TRA could commence in 2023 and will continue for 15 years after the date of the last redemption of the Units.
59
Payments will generally be made under the TRA as we realize actual cash tax savings from the tax benefits covered by the TRA. However, if we experience a Change of Control or the TRA otherwise terminates early, ProFrac Corp.’s obligations under the TRA would accelerate and ProFrac Corp. would be required to make an immediate payment equal to the present value of the anticipated future payments to be made by it under the TRA. For example, if a Change of Control or other early termination event had occurred on December 31, 2022, we estimate the payment could have ranged up to more than $475 million. There can be no assurance that we will be able to satisfy our obligations under the TRA.
Estimating the amount and timing of payments that may become due under the TRA is by its nature imprecise. For purposes of the TRA, net cash tax savings generally are calculated by comparing ProFrac Corp.’s actual tax liability (determined by using the actual applicable U.S. federal income tax rate and an assumed combined state and local income and franchise tax rate) to the amount ProFrac Corp. would have been required to pay had it not been able to utilize any of the tax benefits subject to the TRA. The actual increases in tax basis covered by the TRA, as well as the amount and timing of any payments under the TRA, will vary depending on a number of factors, including the timing of any redemption of Units, the price of ProFrac Corp.’s Class A Common Stock at the time of each redemption, the extent to which such redemptions are taxable transactions, the amount of the redeeming Unit holder’s tax basis in its Units at the time of the relevant redemption, the depreciation and amortization periods that apply to the increase in tax basis, the amount and timing of taxable income we generate in the future, the U.S. federal income tax rates then applicable, and the portion of ProFrac Corp.’s payments under the TRA that constitute imputed interest or give rise to depreciable or amortizable tax basis.
We account for amounts payable under the TRA when we determine that a liability is probable and the amount is reasonably estimable.
Income Taxes
Before May 17, 2022, the ProFrac Predecessor entities were organized as limited liability companies or a limited partnership and were treated as either a disregarded entity or a partnership for U.S. federal income tax purposes, whereby the ordinary business income or loss and certain deductions were passed-through and reported on the members’ income tax returns. As such, the Company was not required to account for U.S. federal income taxes in the consolidated financial statements. Certain state income-based taxes are imposed on the Company which are reflected as income tax expense or benefit in historical periods.
In connection with the IPO in May 2022, the Company reorganized and ProFrac LLC became partially owned by ProFrac Corp., a U.S. Internal Revenue Code Subchapter C corporation (“C-Corporation”). ProFrac Corp. is a taxable entity and is required to account for income taxes under the asset and liability method for periods subsequent to May 17, 2022.
Income taxes are accounted for using the asset and liability method. Deferred taxes are recognized for the tax consequences of temporary differences by applying enacted statutory tax rates applicable to future years to differences between the financial statement carrying amounts and the tax bases of existing assets and liabilities. We recognize future tax benefits to the extent that such benefits are more likely than not to be realized.
We record a valuation allowance to reduce the value of a deferred tax asset if based on the consideration of all available evidence, it is more likely than not that all or some portion of the deferred tax asset will not be realized. Significant weight is given to evidence that can be objectively verified. We evaluate our deferred income taxes at each reporting date to determine if a valuation allowance is required by considering all available evidence, including historical and projected taxable income and tax planning strategies. We will adjust a previously established valuation allowance if we change our assessment of the amount of deferred income tax asset that is more likely than not to be realized.
An estimate of whether a valuation allowance is necessary and the related amount of the valuation allowance contain uncertainties because it requires us to apply judgment to all positive and negative evidence available to us. When considering the likelihood of whether a deferred tax asset will be available to offset future taxable income, we assess, among other things, our historical and projected income or loss. When performing this assessment, we must consider the cyclical nature of our business. Our business is heavily influenced by current and expected prices for oil and natural gas. These prices are outside of our control and a downturn in the market can result in periods of significant losses for us, which could prevent the realization of a deferred tax asset. We therefore must consider the future possibility of an industry downturn and the severity of its effect on our business when considering all positive and negative evidence related to the realization of our deferred tax assets. Although we believe that our judgments and estimates are reasonable, an adjustment to a valuation allowance in a given period may require a material adjustment in a future period if our assumptions regarding our future taxable income are proven inaccurate due to an industry downturn.
Recent Accounting Pronouncements
See “Note 2 – Summary of Significant Accounting Policies” in the notes to our consolidated financial statements for further discussion regarding recently issued accounting standards.
60
Related Party Transactions
See “Note 16 – Related Party Transactions” in the notes to our consolidated financial statements for further discussion regarding related party transactions.
ITEM 7A. QUANTITATIVE AND QUALITATIVE DISCLOSURES ABOUT MARKET RISK
Market risk is the risk of loss arising from adverse changes in market rates and prices. Historically, our risks have been predominantly related to potential changes in the fair value of our long-term debt due to fluctuations in applicable market interest rates. Going forward our market risk exposure generally will be limited to those risks that arise in the normal course of business, as we do not engage in speculative, non-operating transactions, nor do we utilize financial instruments or derivative instruments for trading purposes.
Commodity Price Risk
Our material and fuel purchases expose us to commodity price risk. Our material costs primarily include the cost of inventory consumed while performing our pressure pumping services such as proppants, chemicals, trucking and fluid supplies. For our manufacturing segment, our material costs primarily include the cost of steel. For our proppant production segment, our material costs primarily include the cost of fuel. Our fuel costs consist primarily of diesel fuel used by our trucks, frac fleets and other motorized equipment. The prices for fuel and the raw materials in our inventory are volatile and are impacted by changes in supply and demand, as well as market uncertainty and regional shortages. Additionally, the market for our products and services is indirectly exposed to fluctuations in the prices of oil and natural gas to the extent such fluctuations impact well completion activity levels. Historically, we have generally been able to pass along price increases to our customers; however, we may be unable to do so in the future. We do not engage in commodity price hedging activities.
Interest Rate Risk
We are subject to interest rate risk on our variable rate debt from our 2022 Term Loan Credit Facility and our 2022 ABL Credit Facility. The Company also has fixed rate debt but does not currently utilize derivative instruments to manage the economic effect of changes in interest rates. The impact of a 1% increase in interest rates on our outstanding debt as of December 31, 2022, would have resulted in an annual increase in interest expense of approximately $5.2 million.
Credit Risk
Financial instruments that potentially subject us to concentrations of credit risk are trade account receivables. We extend credit to customers and other parties in the normal course of business. We have established various procedures to manage our credit exposure, including credit evaluations and maintaining an allowance for credit losses.
61
Item 8. Financial Statements and Supplementary Data
INDEX TO FINANCIAL STATEMENTS
|
Page |
Report of Independent Registered Public Accounting Firm (PCAOB ID Number |
63 |
Report of Independent Registered Public Accounting Firm (PCAOB ID Number |
65 |
67 |
|
68 |
|
69 |
|
70 |
|
71 |
|
72 |
62
REPORT OF INDEPENDENT REGISTERED PUBLIC ACCOUNTING FIRM
Board of Directors and Stockholders
ProFrac Holding Corp.
Opinion on the financial statements
We have audited the accompanying consolidated balance sheets of ProFrac Holding Corp. (a Delaware corporation) and subsidiaries (the “Company”) as of December 31, 2022 and 2021, the related consolidated statements of operations, comprehensive income (loss), changes in equity, and cash flows for each of the three years in the period ended December 31, 2022, and the related notes (collectively referred to as the “financial statements”). In our opinion, based on our audits and the report of the other auditors, the financial statements present fairly, in all material respects, the financial position of the Company as of December 31, 2022 and 2021, and the results of its operations and its cash flows for each of the three years in the period ended December 31, 2022, in conformity with accounting principles generally accepted in the United States of America.
We did not audit the financial statements of Flotek Industries, Inc., a consolidated variable interest entity, which statements reflect total assets constituting 3% of consolidated total assets as of December 31, 2022, and total revenues of 2% of consolidated total revenues for the year then ended. Those statements were audited by other auditors, whose report has been furnished to us, and our opinion, insofar as it relates to the amounts included for Flotek Industries, Inc., is based solely on the report of the other auditors.
Change in accounting principle
As discussed in Note 2 to the financial statements, the Company has changed its method of accounting for leases in 2022 due to the adoption of ASC 842, Leases.
Basis for opinion
These financial statements are the responsibility of the Company’s management. Our responsibility is to express an opinion on the Company’s financial statements based on our audits. We are a public accounting firm registered with the Public Company Accounting Oversight Board (United States) (“PCAOB”) and are required to be independent with respect to the Company in accordance with the U.S. federal securities laws and the applicable rules and regulations of the Securities and Exchange Commission and the PCAOB.
We conducted our audits in accordance with the standards of the PCAOB. Those standards require that we plan and perform the audit to obtain reasonable assurance about whether the financial statements are free of material misstatement, whether due to error or fraud. The Company is not required to have, nor were we engaged to perform, an audit of its internal control over financial reporting. As part of our audits we are required to obtain an understanding of internal control over financial reporting but not for the purpose of expressing an opinion on the effectiveness of the Company’s internal control over financial reporting. Accordingly, we express no such opinion.
Our audits included performing procedures to assess the risks of material misstatement of the financial statements, whether due to error or fraud, and performing procedures that respond to those risks. Such procedures included examining, on a test basis, evidence regarding the amounts and disclosures in the financial statements. Our audits also included evaluating the accounting principles used and significant estimates made by management, as well as evaluating the overall presentation of the financial statements. We believe that our audits and the report of the other auditors provide a reasonable basis for our opinion.
Critical audit matter
The critical audit matter communicated below is a matter arising from the current period audit of the financial statements that was communicated or required to be communicated to the audit committee and that: (1) relates to accounts or disclosures that are material to the financial statements and (2) involved our especially challenging, subjective, or complex judgments. The communication of critical audit matters does not alter in any way our opinion on the financial statements, taken as a whole, and we are not, by communicating the critical audit matter below, providing a separate opinion on the critical audit matter or on the accounts or disclosures to which it relates.
Estimation of fair value of certain acquired assets and liabilities
As described further in Note 4 to the financial statements, during 2022, the Company completed acquisitions of five businesses in exchange for aggregate consideration transferred of approximately $1.3 billion. Additionally, the Company obtained control and applied the acquisition method of accounting to the assets and liabilities of Flotek Industries, Inc. as of May 17, 2022, a consolidated variable interest entity. We identified the estimation of fair value of certain acquired assets and liabilities in accordance with the application of the acquisition method of accounting to these acquired businesses as a critical audit matter.
63
The principal considerations for our determination that the estimation of fair value of certain acquired assets and liabilities is a critical audit matter are that the methods used to determine fair value, including the application of significant inputs and assumptions within the determination of fair value, require management to make significant judgments regarding the anticipated future results of the acquired business and to select inputs and assumptions that are relevant and supportable for each acquisition. The Company utilized valuation specialists to assist in developing the estimates of fair value of acquired assets and liabilities. The presence of management judgment, including the selection of significant inputs and assumptions, and the use of valuation specialists, caused the audit procedures associated with the estimation of fair value of certain acquired assets and liabilities to be especially challenging and to require the use of auditor judgment in determining the extent of audit effort, including the need to involve professionals having expertise in the valuation of acquired assets and liabilities.
Our audit procedures related to the estimation of fair value of certain acquired assets and liabilities included the following, among others.
/s/
We have served as the Company’s auditor since 2018.
March 30, 2023
64
REPORT OF INDEPENDENT REGISTERED PUBLIC ACCOUNTING FIRM
To the Stockholders and the Board of Directors
Flotek Industries, Inc.:
Opinion on the Consolidated Financial Statements
We have audited the accompanying consolidated balance sheets of Flotek Industries, Inc. and subsidiaries (the Company) as of December 31, 2022 and 2021, the related consolidated statements of operations, comprehensive loss, cash flows, and stockholders’ equity for each of the years in the two-year period ended December 31, 2022, and the related notes (collectively, the consolidated financial statements). In our opinion, the consolidated financial statements present fairly, in all material respects, the financial position of the Company as of December 31, 2022 and 2021, and the results of its operations and its cash flows for each of the years in the two-year period ended December 31, 2022, in conformity with U.S. generally accepted accounting principles.
Going Concern
The accompanying consolidated financial statements have been prepared assuming that the Company will continue as a going concern. As discussed in Note 1 to the consolidated financial statements, the Company has suffered recurring operating losses and negative cash flows from operations that raise substantial doubt about its ability to continue as a going concern. Management’s plans in regard to these matters are also described in Note 1. The consolidated financial statements do not include any adjustments that might result from the outcome of this uncertainty.
Change in Accounting Principle
As discussed in Note 2 to the consolidated financial statements, the Company has changed its method of accounting for convertible instruments as of January 1, 2022 due to the adoption of ASU No. 2020-06, Accounting for Convertible Instruments and Contracts in an Entity’s Own Equity.
Basis for Opinion
These consolidated financial statements are the responsibility of the Company’s management. Our responsibility is to express an opinion on these consolidated financial statements based on our audits. We are a public accounting firm registered with the Public Company Accounting Oversight Board (United States) (PCAOB) and are required to be independent with respect to the Company in accordance with the U.S. federal securities laws and the applicable rules and regulations of the Securities and Exchange Commission and the PCAOB.
We conducted our audits in accordance with the standards of the PCAOB. Those standards require that we plan and perform the audit to obtain reasonable assurance about whether the consolidated financial statements are free of material misstatement, whether due to error or fraud. The Company is not required to have, nor were we engaged to perform, an audit of its internal control over financial reporting. As part of our audits, we are required to obtain an understanding of internal control over financial reporting but not for the purpose of expressing an opinion on the effectiveness of the Company’s internal control over financial reporting. Accordingly, we express no such opinion.
Our audits included performing procedures to assess the risks of material misstatement of the consolidated financial statements, whether due to error or fraud, and performing procedures that respond to those risks. Such procedures included examining, on a test basis, evidence regarding the amounts and disclosures in the consolidated financial statements. Our audits also included evaluating the accounting principles used and significant estimates made by management, as well as evaluating the overall presentation of the consolidated financial statements. We believe that our audits provide a reasonable basis for our opinion.
Critical Audit Matter
The critical audit matter communicated below is a matter arising from the current period audit of the consolidated financial statements that was communicated or required to be communicated to the audit committee and that: (1) relates to accounts or disclosures that are material to the consolidated financial statements and (2) involved our especially challenging, subjective, or complex judgments. The communication of a critical audit matter does not alter in any way our opinion on the consolidated financial statements, taken as a whole, and we are not, by communicating the critical audit matter below, providing a separate opinion on the critical audit matter or on the accounts or disclosures to which it relates.
Recoverability of contract assets
As described in Note 2 to the Company’s consolidated financial statements, the Company’s contract assets represent consideration issued in the form of convertible notes and other incremental costs related to obtaining a contract with ProFrac Services, LLC, a related party customer. The contract assets are tested for recoverability on a recurring basis
65
and the Company will recognize an impairment loss to the extent that the carrying amount of the contract assets exceeds the amount of revenue the Company expects to receive in the future for the transfer of goods under the long-term supply agreement and the amendment to that agreement (collectively, the ProFrac Agreement) less the direct costs that relate to providing those goods in the future. As described in Note 4, the Company had recorded contract assets, net of $79.7 million as of December 31, 2022.
We identified the evaluation of the recoverability of contract assets as a critical audit matter. There was subjective auditor judgement in evaluating the key assumptions used in the Company’s contract asset recoverability assessment, specifically the forecasted product revenue and related forecasted costs to provide products over the term of the ProFrac Agreement.
The following are the primary procedures we performed to address this critical audit matter. We evaluated the design of certain internal controls related to the Company’s contract assets recoverability assessment, including controls over the development of forecasted revenue and costs over the term of the ProFrac Agreement. To assess the Company’s ability to forecast revenue and costs, we compared revenue and cost forecasts for the current year to actual results. We performed sensitivity analyses over the Company’s contract asset recoverability assessment by evaluating the effect of changes in the forecasted revenue and costs over the term of the ProFrac Agreement. We assessed the reasonableness of forecasted revenue and costs by considering whether such amounts were consistent with evidence obtained in other areas of the audit.
/s/
We have served as the Company’s auditor since 2021.
March 22, 2023
66
ProFrac Holding Corp.
CONSOLIDATED BALANCE SHEETS
(in millions, except per share amounts)
|
|
December 31, |
|
|||||
|
|
2022 |
|
|
2021 |
|
||
ASSETS |
|
|
|
|
|
|
||
Current assets: |
|
|
|
|
|
|
||
Cash and cash equivalents |
|
$ |
|
|
$ |
|
||
Accounts receivable, net |
|
|
|
|
|
|
||
Accounts receivable—related party |
|
|
|
|
|
|
||
Inventories |
|
|
|
|
|
|
||
Prepaid expenses and other current assets |
|
|
|
|
|
|
||
Total current assets |
|
|
|
|
|
|
||
Property, plant, and equipment, net |
|
|
|
|
|
|
||
Operating lease right-of-use assets |
|
|
|
|
|
- |
|
|
Goodwill |
|
|
|
|
|
- |
|
|
Intangible assets, net |
|
|
|
|
|
|
||
Investments |
|
|
|
|
|
|
||
Deferred tax assets |
|
|
|
|
|
- |
|
|
Other assets |
|
|
|
|
|
|
||
Total assets |
|
$ |
|
|
$ |
|
||
LIABILITIES, REDEEMABLE NONCONTROLLING INTEREST, AND STOCKHOLDERS’ AND MEMBERS’ (DEFICIT) EQUITY |
|
|
|
|
|
|
||
Current liabilities: |
|
|
|
|
|
|
||
Accounts payable |
|
$ |
|
|
$ |
|
||
Accounts payable—related party |
|
|
|
|
|
|
||
Accrued expenses |
|
|
|
|
|
|
||
Current portion of long-term debt |
|
|
|
|
|
|
||
Current portion of operating lease liabilities |
|
|
|
|
|
- |
|
|
Other current liabilities |
|
|
|
|
|
|
||
Total current liabilities |
|
|
|
|
|
|
||
Long-term debt |
|
|
|
|
|
|
||
Long-term debt—related party |
|
|
|
|
|
|
||
Operating lease liabilities |
|
|
|
|
|
- |
|
|
Other liabilities |
|
|
|
|
|
- |
|
|
Total liabilities |
|
|
|
|
|
|
||
(NOTE 13) |
|
|
|
|
|
|
||
Redeemable noncontrolling interest |
|
|
|
|
|
- |
|
|
Stockholders' and members' (deficit) equity: |
|
|
|
|
|
|
||
Members' equity |
|
|
- |
|
|
|
|
|
Preferred stock, $ |
|
|
|
|
|
|
||
Class A Common Stock, $ |
|
|
|
|
|
- |
|
|
Class B Common Stock, $ |
|
|
|
|
|
- |
|
|
Additional paid-in capital |
|
|
- |
|
|
|
- |
|
Accumulated deficit |
|
|
( |
) |
|
|
- |
|
Accumulated other comprehensive income |
|
|
- |
|
|
|
|
|
Total stockholders' and members' (deficit) equity attributable to ProFrac Holding Corp. |
|
|
( |
) |
|
|
|
|
Noncontrolling interests |
|
|
|
|
|
|
||
Total stockholders' and members' (deficit) equity |
|
|
( |
) |
|
|
|
|
Total liabilities, redeemable noncontrolling interest, and stockholders' and members' (deficit) equity |
|
$ |
|
|
$ |
|
||
The accompanying notes are an integral part of these consolidated financial statements.
67
ProFrac Holding Corp.
CONSOLIDATED STATEMENTS OF OPERATIONS
(in millions, except per share amounts)
|
|
Year Ended December 31, |
|
|||||||||
|
|
2022 |
|
|
2021 |
|
|
2020 |
|
|||
Revenues |
|
$ |
|
|
$ |
|
|
$ |
|
|||
Operating costs and expenses: |
|
|
|
|
|
|
|
|
|
|||
Cost of revenues, exclusive of depreciation, depletion and amortization |
|
|
|
|
|
|
|
|
|
|||
Selling, general, and administrative |
|
|
|
|
|
|
|
|
|
|||
Depreciation, depletion and amortization |
|
|
|
|
|
|
|
|
|
|||
Acquisition related expenses |
|
|
|
|
|
- |
|
|
|
- |
|
|
Other operating (income) expenses, net |
|
|
|
|
|
|
|
|
|
|||
Total operating costs and expenses |
|
|
|
|
|
|
|
|
|
|||
Operating income (loss) |
|
|
|
|
|
( |
) |
|
|
( |
) |
|
Other (expense) income: |
|
|
|
|
|
|
|
|
|
|||
Interest expense, net |
|
|
( |
) |
|
|
( |
) |
|
|
( |
) |
Loss on extinguishment of debt |
|
|
( |
) |
|
|
( |
) |
|
|
- |
|
Other (expense) income, net |
|
|
|
|
|
|
|
|
|
|||
Income (loss) before income taxes |
|
|
|
|
|
( |
) |
|
|
( |
) |
|
Income tax (expense) benefit |
|
|
( |
) |
|
|
|
|
|
( |
) |
|
Net income (loss) |
|
|
|
|
|
( |
) |
|
|
( |
) |
|
Less: net (income) loss attributable to ProFrac Predecessor |
|
|
( |
) |
|
|
|
|
|
|
||
Less: net loss attributable to noncontrolling interests |
|
|
|
|
|
|
|
|
|
|||
Less: net income attributable to redeemable noncontrolling interests |
|
|
( |
) |
|
|
- |
|
|
|
- |
|
Net income attributable to ProFrac Holding Corp. |
|
$ |
|
|
$ |
- |
|
|
$ |
- |
|
|
Earnings per Class A common share: |
|
|
|
|
|
|
|
|
|
|||
Basic and diluted |
|
$ |
|
|
|
|
|
|
|
|||
Weighted average Class A common shares outstanding: |
|
|
|
|
|
|
|
|
|
|||
Basic |
|
|
|
|
|
|
|
|
|
|||
Diluted |
|
|
|
|
|
|
|
|
|
|||
The accompanying notes are an integral part of these consolidated financial statements.
68
ProFrac Holding Corp.
CONSOLIDATED STATEMENTS OF COMPREHENSIVE INCOME (LOSS)
(in millions)
|
|
Year Ended December 31, |
|
|||||||||
|
|
2022 |
|
|
2021 |
|
|
2020 |
|
|||
Net income (loss) |
|
$ |
|
|
$ |
( |
) |
|
$ |
( |
) |
|
Foreign currency translation adjustments |
|
|
|
|
|
|
|
|
- |
|
||
Comprehensive income (loss) |
|
|
|
|
|
( |
) |
|
|
( |
) |
|
Less: comprehensive (income) loss attributable to ProFrac Predecessor |
|
|
( |
) |
|
|
|
|
|
|
||
Less: comprehensive loss attributable to noncontrolling interest |
|
|
|
|
|
|
|
|
|
|||
Less: comprehensive income attributable to redeemable noncontrolling interest |
|
|
( |
) |
|
|
- |
|
|
|
- |
|
Comprehensive income attributable to ProFrac Holding Corp. |
|
$ |
|
|
$ |
- |
|
|
$ |
- |
|
|
The accompanying notes are an integral part of these consolidated financial statements.
69
ProFrac Holding Corp.
CONSOLIDATED STATEMENTS OF CHANGES IN EQUITY
(in millions)
|
|
Members' |
|
|
Class A Common Stock |
|
|
Class B Common Stock |
|
|
Additional |
|
|
Retained Earnings |
|
|
Accumulated |
|
|
Noncontrolling |
|
|
Total Equity |
|
||||||||||||||||
|
|
Equity |
|
|
Shares |
|
|
Amount |
|
|
Shares |
|
|
Amount |
|
|
Paid-in Capital |
|
|
(Deficit) |
|
|
Income |
|
|
Interests |
|
|
(Deficit) |
|
||||||||||
Balance, December 31, 2019 |
|
$ |
|
|
|
- |
|
|
$ |
- |
|
|
|
- |
|
|
$ |
- |
|
|
$ |
- |
|
|
$ |
- |
|
|
$ |
- |
|
|
$ |
|
|
$ |
|
|||
Net loss |
|
|
( |
) |
|
|
- |
|
|
|
- |
|
|
|
- |
|
|
|
- |
|
|
|
- |
|
|
|
- |
|
|
|
- |
|
|
|
( |
) |
|
|
( |
) |
Member contribution by debt retirement |
|
|
|
|
|
- |
|
|
|
- |
|
|
|
- |
|
|
|
- |
|
|
|
- |
|
|
|
- |
|
|
|
- |
|
|
|
- |
|
|
|
|
||
Balance, December 31, 2020 |
|
$ |
|
|
|
- |
|
|
$ |
- |
|
|
|
- |
|
|
$ |
- |
|
|
$ |
- |
|
|
$ |
- |
|
|
$ |
- |
|
|
$ |
|
|
$ |
|
|||
Net loss |
|
|
( |
) |
|
|
- |
|
|
|
- |
|
|
|
- |
|
|
|
- |
|
|
|
- |
|
|
|
- |
|
|
|
- |
|
|
|
( |
) |
|
|
( |
) |
Member contribution by debt retirement |
|
|
|
|
|
- |
|
|
|
- |
|
|
|
- |
|
|
|
- |
|
|
|
- |
|
|
|
- |
|
|
|
- |
|
|
|
- |
|
|
|
|
||
Purchase of noncontrolling interests |
|
|
( |
) |
|
|
- |
|
|
|
- |
|
|
|
- |
|
|
|
- |
|
|
|
- |
|
|
|
- |
|
|
|
- |
|
|
|
( |
) |
|
|
( |
) |
Noncontrolling interest of acquired business |
|
|
- |
|
|
|
- |
|
|
|
- |
|
|
|
- |
|
|
|
- |
|
|
|
- |
|
|
|
- |
|
|
|
- |
|
|
|
|
|
|
|
||
Foreign currency translation |
|
|
- |
|
|
|
- |
|
|
|
- |
|
|
|
- |
|
|
|
- |
|
|
|
- |
|
|
|
- |
|
|
|
|
|
|
- |
|
|
|
|
||
Balance, December 31, 2021 |
|
$ |
|
|
|
- |
|
|
$ |
- |
|
|
|
- |
|
|
$ |
- |
|
|
$ |
- |
|
|
$ |
- |
|
|
$ |
|
|
$ |
|
|
$ |
|
||||
Net income (loss) |
|
|
|
|
|
- |
|
|
|
- |
|
|
|
- |
|
|
|
- |
|
|
|
- |
|
|
|
|
|
|
- |
|
|
|
( |
) |
|
|
|
|||
Member contributions |
|
|
|
|
|
- |
|
|
|
- |
|
|
|
- |
|
|
|
- |
|
|
|
- |
|
|
|
- |
|
|
|
- |
|
|
|
- |
|
|
|
|
||
Deemed distribution |
|
|
( |
) |
|
|
- |
|
|
|
- |
|
|
|
- |
|
|
|
- |
|
|
|
- |
|
|
|
- |
|
|
|
- |
|
|
|
- |
|
|
|
( |
) |
THRC related equity |
|
|
|
|
|
- |
|
|
|
- |
|
|
|
- |
|
|
|
- |
|
|
|
- |
|
|
|
- |
|
|
|
- |
|
|
|
- |
|
|
|
|
||
Issuance of Class A shares in IPO |
|
|
- |
|
|
|
|
|
|
|
|
|
- |
|
|
|
- |
|
|
|
|
|
|
- |
|
|
|
- |
|
|
|
- |
|
|
|
|
||||
Issuance of Class B shares |
|
|
- |
|
|
|
- |
|
|
|
- |
|
|
|
|
|
|
|
|
|
- |
|
|
|
- |
|
|
|
- |
|
|
|
- |
|
|
|
|
|||
Effect of corporate reorganization and reclassification to redeemable noncontrolling interest |
|
|
( |
) |
|
|
|
|
|
|
|
|
- |
|
|
|
- |
|
|
|
( |
) |
|
|
- |
|
|
|
- |
|
|
|
- |
|
|
|
( |
) |
||
Adjustment of redeemable noncontrolling interest to redemption amount at IPO |
|
|
- |
|
|
|
- |
|
|
|
- |
|
|
|
- |
|
|
|
- |
|
|
|
( |
) |
|
|
( |
) |
|
|
- |
|
|
|
- |
|
|
|
( |
) |
Class A shares issued to settle asset purchase |
|
|
- |
|
|
|
|
|
|
- |
|
|
|
- |
|
|
|
- |
|
|
|
|
|
|
- |
|
|
|
- |
|
|
|
- |
|
|
|
|
|||
Noncontrolling interest of acquired business |
|
|
- |
|
|
|
- |
|
|
|
- |
|
|
|
- |
|
|
|
- |
|
|
|
- |
|
|
|
- |
|
|
|
- |
|
|
|
|
|
|
|
||
Purchase of noncontrolling interest |
|
|
- |
|
|
|
- |
|
|
|
- |
|
|
|
- |
|
|
|
- |
|
|
|
- |
|
|
|
- |
|
|
|
- |
|
|
|
( |
) |
|
|
( |
) |
Class A shares issued to acquire USWS |
|
|
- |
|
|
|
|
|
|
|
|
|
- |
|
|
|
- |
|
|
|
|
|
|
- |
|
|
|
- |
|
|
|
- |
|
|
|
|
||||
Class A shares issued for vested stock awards |
|
|
- |
|
|
|
- |
|
|
|
- |
|
|
|
- |
|
|
|
- |
|
|
|
|
|
|
- |
|
|
|
- |
|
|
|
- |
|
|
|
|
||
Tax withholding related to net share settlement of equity awards |
|
|
- |
|
|
|
( |
) |
|
|
- |
|
|
|
- |
|
|
|
- |
|
|
|
( |
) |
|
|
- |
|
|
|
- |
|
|
|
- |
|
|
|
( |
) |
Class B shares issued to acquire REV |
|
|
- |
|
|
|
- |
|
|
|
- |
|
|
|
|
|
|
- |
|
|
|
|
|
|
- |
|
|
|
- |
|
|
|
- |
|
|
|
|
|||
Additional paid-in capital related to tax receivable agreement |
|
|
- |
|
|
|
- |
|
|
|
- |
|
|
|
- |
|
|
|
- |
|
|
|
|
|
|
- |
|
|
|
- |
|
|
|
- |
|
|
|
|
||
Stock-based compensation |
|
|
- |
|
|
|
- |
|
|
|
- |
|
|
|
- |
|
|
|
- |
|
|
|
|
|
|
- |
|
|
|
- |
|
|
|
|
|
|
|
|||
Stock-based compensation related to deemed contribution |
|
|
- |
|
|
|
- |
|
|
|
- |
|
|
|
- |
|
|
|
- |
|
|
|
|
|
|
- |
|
|
|
- |
|
|
|
- |
|
|
|
|
||
Foreign currency translation adjustments |
|
|
- |
|
|
|
- |
|
|
|
- |
|
|
|
- |
|
|
|
- |
|
|
|
- |
|
|
|
- |
|
|
|
( |
) |
|
|
|
|
|
- |
|
|
Other |
|
|
- |
|
|
|
- |
|
|
|
- |
|
|
|
- |
|
|
|
- |
|
|
|
|
|
|
- |
|
|
|
- |
|
|
|
- |
|
|
|
|
||
Adjustment of redeemable noncontrolling interest to redemption amount |
|
|
- |
|
|
|
- |
|
|
|
- |
|
|
|
- |
|
|
|
- |
|
|
|
( |
) |
|
|
|
|
|
- |
|
|
|
- |
|
|
|
( |
) |
|
Balance, December 31, 2022 |
|
$ |
- |
|
|
|
|
|
$ |
|
|
|
|
|
$ |
|
|
$ |
- |
|
|
$ |
( |
) |
|
$ |
- |
|
|
$ |
|
|
$ |
( |
) |
|||||
The accompanying notes are an integral part of these consolidated financial statements.
70
ProFrac Holding Corp.
CONSOLIDATED STATEMENTS OF CASH FLOWS
(in millions)
|
|
Year Ended December 31, |
|
|||||||||
|
|
2022 |
|
|
2021 |
|
|
2020 |
|
|||
Cash flows from operating activities: |
|
|
|
|
|
|
|
|
|
|||
Net income (loss) |
|
$ |
|
|
$ |
( |
) |
|
$ |
( |
) |
|
Adjustments to reconcile net income (loss) to cash provided by operating activities: |
|
|
|
|
|
|
|
|
|
|||
Depreciation, depletion and amortization |
|
|
|
|
|
|
|
|
|
|||
Stock-based compensation |
|
|
|
|
|
- |
|
|
|
- |
|
|
Loss on disposal of assets, net |
|
|
|
|
|
|
|
|
|
|||
Non-cash loss on extinguishment of debt |
|
|
|
|
|
|
|
|
- |
|
||
Amortization of debt issuance costs |
|
|
|
|
|
|
|
|
|
|||
Deferred tax expense |
|
|
|
|
|
- |
|
|
|
- |
|
|
Unrealized gain on investments, net |
|
|
( |
) |
|
|
- |
|
|
|
- |
|
Other non-cash items, net |
|
|
|
|
|
( |
) |
|
|
|
||
Changes in operating assets and liabilities: |
|
|
|
|
|
|
|
|
|
|||
Accounts receivable |
|
|
( |
) |
|
|
( |
) |
|
|
|
|
Inventories |
|
|
( |
) |
|
|
( |
) |
|
|
( |
) |
Prepaid expenses and other assets |
|
|
( |
) |
|
|
|
|
|
( |
) |
|
Accounts payable |
|
|
|
|
|
|
|
|
( |
) |
||
Accrued expenses |
|
|
|
|
|
|
|
|
( |
) |
||
Deferred revenues and other liabilities |
|
|
( |
) |
|
|
( |
) |
|
|
- |
|
Net cash provided by operating activities |
|
|
|
|
|
|
|
|
|
|||
Cash flows from investing activities: |
|
|
|
|
|
|
|
|
|
|||
Investment in property, plant & equipment |
|
|
( |
) |
|
|
( |
) |
|
|
( |
) |
Proceeds from sale of assets |
|
|
|
|
|
|
|
|
|
|||
Acquisitions, net of cash acquired |
|
|
( |
) |
|
|
( |
) |
|
|
( |
) |
Investment in preferred shares of BPC |
|
|
( |
) |
|
|
( |
) |
|
|
- |
|
Initial investment in Flotek |
|
|
( |
) |
|
|
- |
|
|
|
- |
|
Other investments |
|
|
( |
) |
|
|
- |
|
|
|
- |
|
Net cash used in investing activities |
|
|
( |
) |
|
|
( |
) |
|
|
( |
) |
Cash flows from financing activities: |
|
|
|
|
|
|
|
|
|
|||
Proceeds from issuance of long-term debt |
|
|
|
|
|
|
|
|
|
|||
Repayments of long-term debt |
|
|
( |
) |
|
|
( |
) |
|
|
( |
) |
Borrowings from revolving credit agreements |
|
|
|
|
|
|
|
|
|
|||
Repayments to revolving credit agreements |
|
|
( |
) |
|
|
( |
) |
|
|
( |
) |
Payment of debt issuance costs |
|
|
( |
) |
|
|
( |
) |
|
|
( |
) |
Member contribution |
|
|
|
|
|
- |
|
|
|
- |
|
|
Proceeds from issuance of common stock |
|
|
|
|
|
- |
|
|
|
- |
|
|
Payment of THRC related equity |
|
|
( |
) |
|
|
- |
|
|
|
- |
|
Payment of common stock issuance costs |
|
|
( |
) |
|
|
- |
|
|
|
- |
|
Other |
|
|
( |
) |
|
|
( |
) |
|
|
( |
) |
Net cash provided by (used in) financing activities |
|
|
|
|
|
|
|
|
( |
) |
||
Net increase (decrease) in cash, cash equivalents, and restricted cash |
|
|
|
|
|
|
|
|
( |
) |
||
Cash, cash equivalents, and restricted cash beginning of period |
|
|
|
|
|
|
|
|
|
|||
Cash, cash equivalents, and restricted cash end of period |
|
$ |
|
|
$ |
|
|
$ |
|
|||
Supplemental cash flow information: |
|
|
|
|
|
|
|
|
|
|||
Cash payments for interest |
|
$ |
|
|
$ |
|
|
$ |
|
|||
Cash payments (refunds received) for income taxes |
|
$ |
|
|
$ |
( |
) |
|
$ |
|
||
Non-cash investing and financing activities: |
|
|
|
|
|
|
|
|
|
|||
Capital expenditures included in accounts payable |
|
$ |
|
|
$ |
|
|
$ |
|
|||
Acquisition of land in exchange for other current liability |
|
$ |
- |
|
|
$ |
|
|
$ |
- |
|
|
Acquisition of noncontrolling interest in exchange for other current liability |
|
$ |
- |
|
|
$ |
|
|
$ |
- |
|
|
Retirement of long-term debt by member |
|
$ |
- |
|
|
$ |
|
|
$ |
|
||
The accompanying notes are an integral part of these consolidated financial statements.
71
ProFrac Holding Corp.
NOTES TO THE CONSOLIDATED FINANCIAL STATEMENTS
(Amounts in millions, except per share amounts, or where otherwise noted)
1. ORGANIZATION AND DESCRIPTION OF BUSINESS
ProFrac Holding Corp. (“ProFrac Corp.”) and its consolidated subsidiaries, including ProFrac Holdings, LLC (“ProFrac LLC”), is a vertically integrated and innovation-driven energy services company providing hydraulic fracturing, completion services and other complementary products and services to leading upstream oil and gas companies engaged in the exploration and production (“E&P”) of North American unconventional oil and natural gas resources. The Company operates in three business segments: stimulation services, manufacturing, and proppant production.
Company Formation
ProFrac Corp. was incorporated as a Delaware corporation on August 17, 2021, to become a holding corporation for ProFrac LLC and its subsidiaries upon completion of a corporate reorganization in conjunction with a planned initial public offering (“IPO”). On May 17, 2022, ProFrac Corp. completed its IPO and corporate reorganization and became the managing member of ProFrac LLC.
The consolidated financial statements presented herein are those of ProFrac Corp. subsequent to the corporate reorganization on May 17, 2022, and ProFrac LLC before that date. In these notes to the consolidated financial statements, ProFrac Corp. and ProFrac LLC together are also referred to as “we,” “us,” “our,” or the “Company” and ProFrac LLC is also referred to as “ProFrac Predecessor.” For all periods presented, the consolidated financial statements presented herein include the controlled subsidiaries of ProFrac LLC, which include Best Pump & Flow LP (“Best Flow”) and Alpine Silica, LLC (“Alpine”).
Prior to December 21, 2021, Dan Wilks and Farris Wilks (or entities they control) (collectively, the “Wilks Parties”) held a controlling interest in each of ProFrac LLC, Best Flow and Alpine. Historical periods for ProFrac Predecessor had been presented on a consolidated and combined basis given the common control ownership by the Wilks Parties. On December 21, 2021, all of the then-outstanding membership interests in Best Flow and Alpine were contributed to ProFrac LLC in exchange for membership interests in ProFrac LLC. Accordingly, the results for the years ended December 31, 2021 and 2020 have been retrospectively adjusted to present the operations of ProFrac LLC, Best Flow and Alpine on a combined basis. The acquisitions of Best Flow and Alpine have been accounted for in a manner consistent with the pooling of interest method of accounting, as the transaction was a combination of entities under common control. Under this method of accounting, the statements of operations, comprehensive income, equity and cash flows have been adjusted to include all activities of the commonly controlled groups for all periods in which common control existed.
Initial Public Offering
On May 17, 2022, ProFrac Corp. completed its IPO of
Correction of an Immaterial Error on Previously Issued Financial Statements
During the fourth quarter of 2022, the Company identified and corrected errors related to the recognition and classification of certain repairs and maintenance expenses and the capitalized costs associated with certain inventory and property, plant and equipment in the first three quarters of 2022. We evaluated whether our previously issued unaudited consolidated financial statements for the first three quarters of 2022 were materially misstated due to these errors. Based upon our evaluation of both quantitative and qualitative factors, we concluded that the effects of these errors were not material individually or in the aggregate to any previously reported quarterly period. Accordingly, we have corrected our previously issued unaudited consolidated financial statements for the first three quarters of 2022 as shown in Note 17 - “Selected Quarterly Data (Unaudited).”
72
ProFrac Holding Corp.
NOTES TO THE CONSOLIDATED FINANCIAL STATEMENTS
(Amounts in millions, except per share amounts, or where otherwise noted)
Redeemable Noncontrolling Interests
ProFrac Corp’s only material asset is an equity interest consisting of units representing limited liability company interests in ProFrac LLC (“Units”). As the sole managing member of ProFrac LLC, ProFrac Corp. operates and controls all of the business and affairs of ProFrac LLC and conducts its business through ProFrac LLC and its subsidiaries. As a result, ProFrac Corp. consolidates the financial results of ProFrac LLC and its subsidiaries and reports a noncontrolling interest related to the portion of Units not owned by ProFrac Corp., which reduces net income attributable to holders of ProFrac Corp.’s Class A Common Stock. The holders of Units not owned by ProFrac Corp. also hold shares of ProFrac Corp.’s Class B common stock, par value $
The holders of Units not owned by ProFrac Corp. may redeem all or a portion of their Units, together with a corresponding number of shares of Class B Common Stock, for either shares of Class A Common Stock or an approximately equivalent amount of cash, at the election of ProFrac Corp. In connection with the exercise of such redemption, a corresponding number of shares of Class B Common Stock will be canceled. The redemption election is not considered to be within the control of the Company because the holders of Class B Common Stock and their affiliates control the Company through direct representation on ProFrac Corp.’s board of directors. As a result, we present the noncontrolling interests in ProFrac LLC as redeemable noncontrolling interests outside of permanent equity.
During the year ended December 31, 2022, we recorded adjustments to the value of our redeemable noncontrolling interests as shown below:
|
|
Redeemable Noncontrolling Interests |
|
|
Balance as of December 31, 2021 |
|
$ |
|
|
Effect of corporate reorganization and reclassification to redeemable noncontrolling interest |
|
|
|
|
Adjustment of redeemable noncontrolling interest to redemption amount at IPO (1) |
|
|
|
|
Net income |
|
|
|
|
Class A Common Stock issued to settle asset purchase |
|
|
|
|
Class A shares issued to acquire USWS |
|
|
|
|
Class A shares issued for vested stock awards |
|
|
( |
) |
Tax withholding related to net share settlement of equity awards |
|
|
( |
) |
Class B shares issued to acquire REV |
|
|
|
|
Change in accrued distribution related to income taxes |
|
|
( |
) |
Stock-based compensation |
|
|
|
|
Stock-based compensation related to deemed contribution |
|
|
|
|
Foreign currency translation adjustments |
|
|
|
|
Adjustment of redeemable noncontrolling interest to redemption amount (2) |
|
|
|
|
Balance as of December 31, 2022 |
|
$ |
|
|
As of December 31, 2022, ProFrac Corp. owned
73
ProFrac Holding Corp.
NOTES TO THE CONSOLIDATED FINANCIAL STATEMENTS
(Amounts in millions, except per share amounts, or where otherwise noted)
Concentrations of Risk
Our business activities are concentrated in the well completion services segment of the oilfield services industry in the United States. The market for these services is cyclical, and we depend on the willingness of our customers to make operating and capital expenditures to explore for, develop, and produce oil and natural gas in the United States. The willingness of our customers to undertake these activities depends largely upon prevailing industry conditions that are predominantly influenced by current and expected prices for oil and natural gas. Historically, a low commodity-price environment has caused our customers to significantly reduce their hydraulic fracturing activities and the prices they are willing to pay for those services. During these periods, these customer actions materially adversely affected our business, financial condition and results of operations.
Our customers consist primarily of E&P companies in the continental United States. For the year ended December 31, 2022, no individual customer represented more than 10% of our consolidated revenues. For the year ended December 31, 2021, our top
2. SUMMARY OF SIGNIFICANT ACCOUNTING POLICIES
Basis of Presentation
The consolidated financial statements have been prepared in accordance with accounting principles generally accepted in the United States of America (“GAAP”) and pursuant to the rules and regulations of the Securities and Exchange Commission for annual financial information. The consolidated financial statements include the accounts of our company and all of our majority-owned subsidiaries that we control or variable interest entities for which we have determined that we are the primary beneficiary. All significant intercompany accounts and transactions are eliminated in consolidation.
Use of Estimates
The preparation of financial statements in accordance with GAAP requires us to make estimates and assumptions that affect the reported amounts of assets and liabilities, related revenues and expenses, and the disclosure of gain and loss contingencies at the date of the financial statements and during the periods presented. We base these estimates on historical results and various other assumptions believed to be reasonable, all of which form the basis for making estimates concerning the carrying values of assets and liabilities that are not readily available from other sources. Actual results could differ materially from those estimates.
Cash and Cash Equivalents
Cash equivalents include only investments with an original maturity of three months or less. We occasionally hold cash deposits in financial institutions that exceed federally insured limits. We monitor the credit ratings and our concentration of risk with these financial institutions on a continuing basis to safeguard our cash deposits.
Restricted Cash
Cash and cash equivalents that are restricted as to withdrawal or use under the terms of certain contractual agreements, or are reserved for a specific purpose, and not readily available for immediate or general use are recorded to restricted cash and included in prepaid expenses and other current assets in our consolidated balance sheets. As of December 31, 2022, restricted cash consisted of $
The following table provides a reconciliation of cash, cash equivalents, and restricted cash reported within the consolidated statements of cash flows for the periods indicated:
|
|
December 31, |
|
|||||||||
|
|
2022 |
|
|
2021 |
|
|
2020 |
|
|||
Cash and cash equivalents |
|
$ |
|
|
$ |
|
|
$ |
|
|||
Restricted cash included in prepaid expenses and other current assets |
|
|
|
|
|
- |
|
|
|
- |
|
|
Total cash, cash equivalents, and restricted cash shown in the |
|
$ |
|
|
$ |
|
|
$ |
|
|||
74
ProFrac Holding Corp.
NOTES TO THE CONSOLIDATED FINANCIAL STATEMENTS
(Amounts in millions, except per share amounts, or where otherwise noted)
Accounts Receivable
Accounts receivable are recorded at their invoiced amounts or amounts for which we have a right to invoice based on services completed. We establish an allowance for credit losses to reduce the carrying value of our accounts receivable based on a number of factors, including the length of time that accounts receivable are past due, our previous loss history, and the customer’s creditworthiness. Losses are charged against the allowance when the customer accounts are determined to be uncollectible.
The following table summarizes the rollforward of our allowance for credit losses:
|
|
December 31, |
|
|||||
|
|
2022 |
|
|
2021 |
|
||
Balance at beginning of period |
|
$ |
( |
) |
|
$ |
( |
) |
Provision for credit losses, net of recoveries |
|
|
( |
) |
|
|
|
|
Write-offs |
|
|
- |
|
|
|
- |
|
Balance at end of period |
|
$ |
( |
) |
|
$ |
( |
) |
Inventories
Inventories, which consist of proppants and chemicals that are used to provide hydraulic fracturing services and maintenance parts that are used to service our hydraulic fracturing equipment, are carried at the lower of cost or net realizable value. Our inventory is recorded using the first-in, first-out method. As necessary, we record an adjustment to decrease the value of slow moving and obsolete inventory to its net realizable value. To determine the adjustment amount, we regularly review inventory quantities on hand and compare them to estimates of future product demand, market conditions, production requirements and technological developments.
Property, Plant and Equipment
Property, plant, and equipment is stated at cost less accumulated depreciation, which is generally provided by using the straight-line method over the estimated useful lives of the individual assets. We manufacture our hydraulic fracturing units and the cost of this equipment, which includes direct and indirect manufacturing costs, is capitalized, and carried as construction in progress until it is completed and placed into service. Expenditures for renewals and betterments that extend the lives of our service equipment, which includes the replacement of significant components of service equipment, are capitalized and depreciated. Other repairs and maintenance costs are expensed as incurred. Mining property costs are amortized using the units-of-production method on estimated measured tons in proved reserves. The impact of revisions to reserve estimates is recognized on a prospective basis. When assets are disposed or retired, the cost and accumulated depreciation are netted against any sale proceeds, and the resulting gains or losses are included in the results of operations.
Other than those assets acquired in business combinations that were recorded at their fair values upon acquisition, our property, plant and equipment are recorded at cost less accumulated depreciation, which is generally provided by using the straight-line method over the estimated useful lives of the individual assets.
Land |
|
|
Machinery and equipment |
|
|
Office equipment, software, and other |
|
|
Buildings and leasehold improvements |
|
Depletion expense related to mining property and mine development are recorded as minerals are extracted, based on units of production and engineering estimates of mineable reserves.
Goodwill and Other Intangible Assets
Goodwill represents the excess of the purchase price over the fair value of the tangible and identifiable intangible assets acquired in a business combination. Goodwill is not amortized, but is reviewed for each reporting unit for impairment annually during the fourth quarter or more frequently when events or changes in circumstances indicate that the carrying value may not be recoverable. Judgments regarding indicators of potential impairment are based on market conditions and operational performance of our business. We may assess our goodwill for impairment initially using a qualitative approach to determine whether conditions exist that indicate it is more likely than not that a reporting unit’s carrying value is greater than its fair value, and if such conditions are identified, then a quantitative analysis will be performed to determine if there is any impairment.
75
ProFrac Holding Corp.
NOTES TO THE CONSOLIDATED FINANCIAL STATEMENTS
(Amounts in millions, except per share amounts, or where otherwise noted)
The changes in the carrying amount of goodwill by reportable segment were as follows:
|
|
Stimulation |
|
|
Manufacturing |
|
|
Proppant |
|
|
Other |
|
|
Total |
|
|||||
Balances as of December 31, 2021 |
|
$ |
- |
|
|
$ |
- |
|
|
$ |
- |
|
|
$ |
- |
|
|
$ |
- |
|
Acquisition of Flotek |
|
|
- |
|
|
|
- |
|
|
|
- |
|
|
|
|
|
|
|
||
Acquisition of Monahans |
|
|
- |
|
|
|
- |
|
|
|
|
|
|
- |
|
|
|
|
||
Acquisition of USWS |
|
|
|
|
|
- |
|
|
|
- |
|
|
|
- |
|
|
|
|
||
Acquisition of Monarch |
|
|
- |
|
|
|
- |
|
|
|
|
|
|
- |
|
|
|
|
||
Acquisition of REV |
|
|
|
|
|
- |
|
|
|
- |
|
|
|
- |
|
|
|
|
||
Balances as of December 31, 2022 |
|
$ |
|
|
$ |
- |
|
|
$ |
|
|
$ |
|
|
$ |
|
||||
We amortize other identifiable intangible assets with a definite life on a straight-line basis over the estimated useful lives of the assets, ranging from
Impairment of Long-Lived Assets
We evaluate property, plant, and equipment and definite-lived intangible assets for impairment when events or changes in circumstances indicate that the carrying value of a long-lived asset may not be recoverable. Recoverability is assessed based on the undiscounted future cash flows generated by the asset or asset group. If the carrying amount of an asset or asset group is not recoverable, we recognize an impairment loss equal to the amount by which the carrying amount exceeds fair value. We estimate fair value based on the income, market, or cost valuation techniques. During the years ended December 31, 2022, 2021 and 2020,
Leases
At the inception of an arrangement or contract, we determine whether it is a lease or contains a lease. Lease classification is determined, and the lease is recognized and measured, at the lease commencement date. A right-of-use asset and the corresponding lease liability are recorded based on the present value of the remaining lease payments over the lease term. We do not include renewal or termination options in our assessment of the lease term unless the exercise of those options is deemed to be reasonably certain. We do not recognize a right-of-use asset and lease liability for leases with a term of 12 months or less. Operating lease expenses are recognized on a straight-line basis over the lease term. Assets and lease liabilities related to finance leases are classified as property, plant and equipment and debt on our consolidated balance sheets.
Revenue Recognition
Our products and services are sold based upon contracts with our customers. We recognize revenue as we satisfy our performance obligations by transferring control over a service or product to a customer. Payment terms are specified in each customer agreement and are typically a specific number of days following satisfaction of the performance obligation. We assess our customers’ ability and intention to pay based on factors such as their financial condition and our historical payment experience with them. The following are descriptions of the principal activities of each reportable segment from which we generate our revenue.
Stimulation Services. We generate revenue through the provision of hydraulic fracturing services, which involves the injection of water, sand and chemicals under high pressure into formations to optimize hydrocarbon flow paths during the completion phase of wellbores. Our contracts with customers are generally short term in nature, typically less than four weeks, and have a single performance obligation, which is satisfied over time. We generate a field ticket, which our customer signs, that includes charges for services performed and any inputs consumed during the service. The signing of the field ticket by the customer represents their acceptance of the service and agreement to the amounts to which we have the right to invoice and recognize as revenue.
Proppant Production. We generate revenue through the sale of frac sand to oilfield service providers and E&P companies. The performance obligation is satisfied and revenue is recognized at the point-in-time that control of the product is transferred to the customer, generally upon shipment from our facility. Certain of our contracts contain multiple performance obligations to provide a minimum quantity of products to our customers in future periods. For these contracts, the transaction price is allocated to each performance obligation at estimated selling prices and we recognize revenue as we satisfy these performance obligations. At December 31, 2022, the aggregate amount of transaction price allocated to unsatisfied performance obligations was $
76
ProFrac Holding Corp.
NOTES TO THE CONSOLIDATED FINANCIAL STATEMENTS
(Amounts in millions, except per share amounts, or where otherwise noted)
Manufacturing. We generate revenue through sales of equipment used to perform oilfield services. The performance obligation is satisfied and revenues are recognized at the point-in-time that control of goods are transferred to the customer, generally upon shipment from our manufacturing facility.
Taxes collected from customers and remitted to governmental authorities are accounted for on a net basis and are therefore excluded from revenues in the consolidated statements of operations.
Business Combinations
Business combinations are accounted for under the acquisition method of accounting. Under this method, the assets acquired and liabilities assumed are recognized at their respective fair values as of the date of acquisition. The excess, if any, of the acquisition price over the fair values of the assets acquired and liabilities assumed is recorded as goodwill if the definition of a business is met. For significant acquisitions, we utilize third-party appraisal firms to assist us in determining the fair values for certain assets acquired and liabilities assumed using discounted cash flows and other applicable valuation techniques. We record any acquisition related costs as expenses when incurred.
Adjustments to the fair values of assets acquired and liabilities assumed are made until we obtain all relevant information regarding the facts and circumstances that existed as of the acquisition date (the “measurement period”), not to exceed one year from the date of the acquisition. We recognize measurement-period adjustments in the period in which we determine the amounts, including the effect on earnings of any amounts we would have recorded in previous periods if the accounting had been completed at the acquisition date.
We measure asset acquisitions based on their cost to us, including transaction costs. Acquisition costs or consideration transferred in an asset acquisition are assumed to be equal to the fair value of the net assets acquired. If the consideration transferred is cash, measurement is based on the amount of cash paid to the seller, as well as transaction costs incurred. Consideration given in the form of non-monetary assets, liabilities incurred or equity interests issued is measured based on either their cost to us or the fair value of the net assets acquired, whichever is more clearly evident. The cost of an asset acquisition is allocated to the net assets acquired based on their estimated relative fair values. Goodwill is not recognized in an asset acquisition.
The estimation of the fair values of assets and liabilities acquired in business combinations or asset acquisitions requires significant judgment. Our fair value estimates require us to use significant observable and unobservable inputs. The estimates of fair value are also subject to significant variability, are sensitive to changes in market conditions, and are reasonably likely to change in the future. A significant change in the observable and unobservable inputs and determination of fair value of the assets and liabilities acquired could significantly impact our consolidated financial statements.
Variable Interest Entities
We evaluate our ownership, contractual and other interest in entities to determine if they are variable interest entities (“VIE”). We evaluate whether we have a variable interest in those entities and the nature and extent of those interests. Based on our evaluation, if we determine we are the primary beneficiary of a VIE, we consolidate the entity in our financial statements.
Fair Value Measurements
Fair value is defined as the price that would be received from selling an asset or paid to transfer a liability in an orderly transaction between market participants at a measurement date. We apply the following fair value hierarchy, which prioritizes the inputs used to measure fair value into three levels and bases of categorization within the hierarchy upon the lowest level input that is available and significant to the fair value measurement:
Our current assets and liabilities contain financial instruments, the most significant of which are trade accounts receivable and payable. We believe the carrying value of our current assets and liabilities approximate fair value. Our fair value assessment incorporates a variety of considerations, including: (i) the short-term duration of the instruments and (ii) our historical incurrence of and expectations of future credit losses. The book value of our floating rate debt approximates fair value because of its floating rate structure.
77
ProFrac Holding Corp.
NOTES TO THE CONSOLIDATED FINANCIAL STATEMENTS
(Amounts in millions, except per share amounts, or where otherwise noted)
Stock-based Compensation
Stock-based compensation is measured on the grant date and fair value is recognized as expense over the requisite service period, which is generally the vesting period of the award. We recognize forfeitures as they occur rather than estimating expected forfeitures.
The fair value of time-based restricted stock units is determined based on the number of units granted and the closing price of our Class A Common Stock on the date of grant. Stock-based awards with market conditions are valued using a Monte Carlo simulation analysis.
Income Taxes
Before May 17, 2022, the ProFrac Predecessor entities were organized as limited liability companies or a limited partnership and were treated as either a disregarded entity or a partnership for U.S. federal income tax purposes, whereby the ordinary business income or loss and certain deductions were passed-through and reported on the members’ income tax returns. As such, we were not required to account for U.S. federal income taxes in the consolidated financial statements. Certain state income-based taxes are imposed on us which are reflected as income tax expense or benefit in historical periods.
In connection with the IPO in May 2022, the Company reorganized and ProFrac LLC became partially owned by ProFrac Corp., a U.S. Internal Revenue Code Subchapter C corporation (“C-Corporation”). ProFrac Corp. is a taxable entity and is required to account for income taxes under the asset and liability method for periods subsequent to May 17, 2022.
Under the asset and liability method, deferred tax assets and liabilities are recognized for the estimated future tax consequences attributable to differences between the financial statement carrying amounts of existing assets and liabilities and their respective tax basis. Deferred tax assets and liabilities are measured using enacted tax rates in effect for the year in which those temporary differences are expected to be recovered or settled pursuant to the provisions of ASC 740, Income Taxes. The effect on deferred tax assets and liabilities of a change in tax rate is recognized in earnings in the period that includes the enactment date. Valuation allowances are established when necessary to reduce deferred tax assets to the amounts more-likely-than-not to be realized.
Recently Adopted Accounting Standards
On January 1, 2022, we adopted the FASB Accounting Standards Codification (“ASC”) Topic 842, Leases, which amended existing guidance to require lessees to recognize right-of-use assets and related lease liabilities on the consolidated balance sheet for the rights and obligations created by long-term leases and to disclose additional quantitative and qualitative information about leasing arrangements. We adopted this guidance using the current period adjustment approach on January 1, 2022 using the transition method that allows a cumulative-effect adjustment to the opening balance of retained earnings in the period of adoption.
We have completed our process to implement this standard, and we have designed processes and internal controls necessary for the adoption of this standard. We have made policy elections to (i) not capitalize short-term leases for all asset classes, (ii) not separate non-lease components from lease components for all of our existing asset classes, and (iii) apply the package of practical expedients that allows us to not reassess: whether any expired or existing contracts contain leases, lease classification for any expired or existing leases and initial direct costs for existing leases.
Our application of this standard did not significantly impact our results of operations or cash flows. As of January 1, 2022, we recognized right-of-use assets and liabilities of approximately $
During 2022, we adopted FASB ASU No. 2016-13, Financial Instruments – Credit Losses (Topic 326): Measurement of Credit Losses on Financial Instruments. This ASU introduces a new accounting model, the Current Expected Credit Losses model (“CECL”), which requires recognition of credit losses and additional disclosures related to credit risk. The CECL model utilizes a lifetime expected credit loss measurement objective for the recognition of credit losses for loans and other receivables at the time the financial asset is originated or acquired. The expected credit losses are adjusted each period for changes in expected lifetime credit losses. This model replaces the multiple existing impairment models previously used under GAAP, which generally require that a loss be incurred before it is recognized. The new standard also applies to financial assets arising from revenue transactions such as contract assets and accounts receivable.
78
ProFrac Holding Corp.
NOTES TO THE CONSOLIDATED FINANCIAL STATEMENTS
(Amounts in millions, except per share amounts, or where otherwise noted)
We adopted this new standard using the modified-retrospective approach, which allows for a cumulative effect adjustment to the consolidated balance sheet as of the beginning of the first reporting period in which the new standard is effective. Periods prior to the adoption date that are presented for comparative purposes are not adjusted. Upon adoption of this new standard, we analyzed our trade accounts receivable on an individual customer and overall basis through review of historical collection experience and current aging status of our customer accounts. We also consider the financial condition and economic environment of our customers in evaluating the need for an allowance. The adoption of this new standard did not result in a material impact on our consolidated financial statements.
On January 1, 2022, we adopted FASB ASU No. 2019-12, Income Taxes (Topic 740): Simplifying the Accounting for Income Taxes, which removed specific exceptions to the general principles in Topic 740 under GAAP. The new guidance also improves the application of income tax-related guidance and simplifies GAAP for franchise taxes that are partially based on income, transactions with a government that result in a step up in the tax basis of goodwill, separate financial statements of legal entities that are not subject to tax, and enacted changes in tax laws in interim periods. We adopted this guidance using a prospective method of transition, which did not result in a material impact on our consolidated financial statements.
3. SUPPLEMENTAL BALANCE SHEET INFORMATION
Inventories
The following table summarizes the components of our inventories:
|
|
December 31, |
|
|||||
|
|
2022 |
|
|
2021 |
|
||
Raw materials and supplies |
|
$ |
|
|
$ |
|
||
Work in process |
|
|
|
|
|
|
||
Finished products and parts |
|
|
|
|
|
|
||
Total |
|
$ |
|
|
$ |
|
||
The increase in inventory was partially due to acquired inventory of $
Property, Plant, and Equipment, Net
The following table summarizes the components of our property, plant, and equipment, net:
|
|
December 31, |
|
|||||
|
|
2022 |
|
|
2021 |
|
||
Machinery and equipment |
|
$ |
|
|
$ |
|
||
Mining property and mine development |
|
|
|
|
|
|
||
Office equipment, software and other |
|
|
|
|
|
|
||
Land |
|
|
|
|
|
- |
|
|
Buildings and leasehold improvements |
|
|
|
|
|
|
||
Total |
|
|
|
|
|
|
||
Less: accumulated depreciation, depletion and amortization |
|
|
( |
) |
|
|
( |
) |
Construction in progress |
|
|
|
|
|
|
||
Property, plant, and equipment, net |
|
$ |
|
|
$ |
|
||
The increase in net property, plant, and equipment was primarily due to assets of $
Depreciation and amortization expense related to property, plant, and equipment for the years ended on December 31, 2022, 2021 and 2020, was $
79
ProFrac Holding Corp.
NOTES TO THE CONSOLIDATED FINANCIAL STATEMENTS
(Amounts in millions, except per share amounts, or where otherwise noted)
Intangible Assets, Net
The following table summarizes the components of our finite-lived intangible assets:
|
|
Weighted Average Remaining Amortization period (Years) |
|
Estimated |
|
Gross |
|
|
Less: Accumulated |
|
|
Net Book |
|
|||
As of December 31, 2022 |
|
|
|
|
|
|
|
|
|
|
|
|
|
|||
Acquired technology |
|
|
|
$ |
|
|
$ |
( |
) |
|
$ |
|
||||
Customer relationships |
|
|
|
|
|
|
|
( |
) |
|
|
|
||||
Intangible assets, net |
|
|
|
|
$ |
|
|
$ |
( |
) |
|
$ |
|
|||
|
|
|
|
|
|
|
|
|
|
|
|
|
|
|||
As of December 31, 2021 |
|
|
|
|
|
|
|
|
|
|
|
|
|
|||
Electric frac licenses |
|
|
|
$ |
|
|
$ |
- |
|
|
$ |
|
||||
Acquired technology |
|
|
|
|
|
|
|
( |
) |
|
|
|
||||
Intangible assets, net |
|
|
|
|
$ |
|
|
$ |
( |
) |
|
$ |
|
|||
Amortization expense related to intangible assets was $
The estimated future amortization expense related to intangible assets is $
Accrued Expenses
The following table summarizes our accrued expenses:
|
|
December 31, |
|
|||||
|
|
2022 |
|
|
2021 |
|
||
Employee compensation and benefits |
|
$ |
|
|
$ |
|
||
Sales, use, and property taxes |
|
|
|
|
|
|
||
Insurance |
|
|
|
|
|
- |
|
|
Interest |
|
|
|
|
|
|
||
Income taxes |
|
|
|
|
|
- |
|
|
Tax receivable agreement |
|
|
|
|
|
- |
|
|
Other |
|
|
|
|
|
|
||
Total accrued expenses |
|
$ |
|
|
$ |
|
||
4. BUSINESS COMBINATIONS AND ASSET ACQUISITION
FTS International, Inc. (“FTSI”)
On March 4, 2022 (“FTSI Acquisition Date”), we acquired all of the outstanding stock of FTSI (the “FTSI Acquisition”) for a purchase price of $
Immediately following the closing of the cash acquisition pursuant to an Agreement and Plan of Merger, dated as of October 21, 2021, by and among FTSI, ProFrac LLC and ProFrac Acquisitions, Inc. (the “FTSI Merger Agreement”), ProFrac LLC distributed the
80
ProFrac Holding Corp.
NOTES TO THE CONSOLIDATED FINANCIAL STATEMENTS
(Amounts in millions, except per share amounts, or where otherwise noted)
The following table summarizes the fair value of consideration transferred in the FTSI Acquisition and the allocation of the purchase price to the fair values of assets acquired and liabilities assumed at the FTSI Acquisition Date:
Total purchase consideration |
|
$ |
|
|
|
|
|
|
|
Cash and cash equivalents |
|
|
|
|
Accounts receivable |
|
|
|
|
Prepaid expense and other assets |
|
|
|
|
Inventories |
|
|
|
|
Property, plant and equipment |
|
|
|
|
Operating lease right-of-use asset |
|
|
|
|
Intangible assets |
|
|
|
|
Other assets |
|
|
|
|
Total identifiable assets acquired |
|
|
|
|
Accounts payable |
|
|
|
|
Accrued expenses |
|
|
|
|
Operating lease liability current |
|
|
|
|
Current portion of debt |
|
|
|
|
Other current liabilities |
|
|
|
|
Operating lease liability non-current |
|
|
|
|
Other non-current liabilities |
|
|
|
|
Total liabilities assumed |
|
|
|
|
Goodwill |
|
|
- |
|
Total purchase consideration |
|
$ |
|
|
For the three months ended March 31, 2022, revenues and pretax earnings associated with the FTSI acquired operations were $
Consolidation of Flotek Industries, Inc.
On February 2, 2022, we entered into an agreement with Flotek Industries, Inc. (“Flotek”), pursuant to which Flotek will provide full downhole chemistry solutions for a minimum of
On February 16, 2022, we and Flotek agreed to amend the Flotek Supply Agreement to increase the term to
81
ProFrac Holding Corp.
NOTES TO THE CONSOLIDATED FINANCIAL STATEMENTS
(Amounts in millions, except per share amounts, or where otherwise noted)
interest in Flotek during 2022, we allocated
The Flotek Convertible Notes issued to ProFrac accrue paid-in-kind interest at a rate of
Before May 17, 2022, we designated our investment in the Flotek Convertible Notes as trading securities. Securities designated as trading securities are reported at fair value, with gains or losses resulting from changes in fair value recognized in net investment income on the consolidated statements of operations. For the period from February 2, 2022 through May 17, 2022 we recognized noncash income of $
In June 2022, Flotek issued and sold to ProFrac II LLC, a wholly-owned subsidiary of ProFrac LLC, pre-funded warrants to purchase from Flotek up to approximately
82
ProFrac Holding Corp.
NOTES TO THE CONSOLIDATED FINANCIAL STATEMENTS
(Amounts in millions, except per share amounts, or where otherwise noted)
The following table summarizes the fair value of consideration transferred in the transaction, which consisted of settlement of pre-existing relationships, and its allocation to the fair values of Flotek’s assets, liabilities and noncontrolling interest as of May 17, 2022 (the “Flotek Acquisition Date”):
Settlement of pre-existing relationships: |
|
|
|
|
Accounts payable |
|
$ |
( |
) |
Supply Agreement contract liability |
|
|
( |
) |
Fair value of previously held interest in 10% Convertible PIK Notes |
|
|
|
|
Total purchase consideration |
|
$ |
|
|
|
|
|
|
|
Cash and cash equivalents |
|
$ |
|
|
Accounts receivable |
|
|
|
|
Inventories |
|
|
|
|
Assets held for sale |
|
|
|
|
Other current assets |
|
|
|
|
Property and equipment |
|
|
|
|
Operating lease right-of-use assets |
|
|
|
|
Deferred tax assets |
|
|
|
|
Total identifiable assets acquired |
|
|
|
|
Accounts payable and accrued liabilities |
|
|
|
|
Operating lease liabilities |
|
|
|
|
Finance lease liabilities |
|
|
|
|
Long-term debt |
|
|
|
|
Other liabilities |
|
|
|
|
Total liabilities assumed |
|
|
|
|
Noncontrolling interests |
|
|
|
|
Goodwill |
|
|
|
|
Total purchase consideration |
|
$ |
|
|
The fair value of the noncontrolling interest was based on the Flotek common stock price reported by the New York Stock Exchange at the Flotek Acquisition Date, which represented Level 1 inputs. No portion of the recorded goodwill is tax deductible. The allocation of the purchase price to Flotek’s net tangible assets and liabilities and identifiable intangible assets is preliminary and subject to revisions to the fair value calculations for the identifiable assets and liabilities. The determination and allocation of the purchase consideration are subject to change during the measurement period, up to
Our consolidated results included revenue of $
SP Silica of Monahans, LLC and SP Silica Sales, LLC
On July 25, 2022 (the “Monahans Acquisition Date”), we acquired
83
ProFrac Holding Corp.
NOTES TO THE CONSOLIDATED FINANCIAL STATEMENTS
(Amounts in millions, except per share amounts, or where otherwise noted)
The following table summarizes the fair value of consideration transferred in the Monahans Acquisition and the allocation of the purchase price to the fair values of assets acquired and liabilities assumed at the Monahans Acquisition Date:
Total purchase consideration |
|
$ |
|
|
|
|
|
|
|
Cash and cash equivalents |
|
|
|
|
Accounts receivable |
|
|
|
|
Prepaid expense and other assets |
|
|
|
|
Inventories |
|
|
|
|
Property, plant and equipment |
|
|
|
|
Intangible assets |
|
|
|
|
Other assets |
|
|
|
|
Total identifiable assets acquired |
|
|
|
|
Accounts payable |
|
|
|
|
Accrued expenses |
|
|
|
|
Other current liabilities |
|
|
|
|
Other non-current liabilities |
|
|
|
|
Total liabilities assumed |
|
|
|
|
Goodwill |
|
|
|
|
Total purchase consideration |
|
$ |
|
|
For the acquired property, plant and equipment, the valuation technique utilized was the cost approach, which adjusted estimates of replacement cost for the age, condition and utility of the associated assets. In addition, the market approach valuation technique was used for assets that had comparable market data available. Included in our property, plant and equipment valuation is mineral reserves valued at $
The goodwill in this acquisition was primarily attributable to Monahans’ organized workforce and potential or expected synergies, and is tax deductible. We recognized this goodwill in the proppant production segment.
Our consolidated results included revenue of approximately $
U.S. Well Services, Inc. (“USWS”)
On June 21, 2022, ProFrac Holding Corp. entered into an Agreement and Plan of Merger (the “USWS Merger Agreement”) by and among ProFrac Holding Corp., USWS, a Delaware corporation, and Thunderclap Merger Sub I, Inc., a Delaware corporation and an indirect subsidiary of ProFrac Holding Corp. (“Merger Sub”), to effect a stock-for-stock merger transaction. The USWS Merger Agreement also provides for, among other things, the merger of Merger Sub with and into USWS, with USWS surviving the merger as the surviving corporation and an indirect subsidiary of ProFrac Holding Corp. (the “USWS Acquisition”).
The USWS Acquisition was completed on
In connection with the USWS Acquisition, we borrowed approximately $
84
ProFrac Holding Corp.
NOTES TO THE CONSOLIDATED FINANCIAL STATEMENTS
(Amounts in millions, except per share amounts, or where otherwise noted)
The Wilks Parties hold a controlling interest in ProFrac Holding Corp and certain Wilks Parties also owned certain securities of USWS. Upon consummation of the USWS Acquisition, certain Wilks Parties received approximately
The following table summarizes the fair value of consideration transferred in the USWS Acquisition and the allocation of the purchase price to the fair values of assets acquired and liabilities assumed at the USWS Acquisition Date:
Total purchase consideration |
|
$ |
|
|
|
|
|
|
|
Cash and cash equivalents |
|
|
|
|
Accounts receivable |
|
|
|
|
Prepaid expense and other assets |
|
|
|
|
Inventories |
|
|
|
|
Property, plant and equipment |
|
|
|
|
Operating lease right-of-use assets |
|
|
|
|
Intangible assets |
|
|
|
|
Other assets |
|
|
|
|
Total identifiable assets acquired |
|
|
|
|
Accounts payable |
|
|
|
|
Accrued expenses |
|
|
|
|
Current portion of debt |
|
|
|
|
Current portion of operating lease liabilities |
|
|
|
|
Current portion of finance lease liabilities |
|
|
|
|
Warrant liabilities |
|
|
|
|
Long-term debt |
|
|
|
|
Long-term operating lease liabilities |
|
|
|
|
Long-term finance lease liabilities |
|
|
|
|
Total liabilities assumed |
|
|
|
|
Goodwill |
|
|
|
|
Total purchase consideration |
|
$ |
|
|
For the acquired property, plant and equipment, the valuation technique utilized was the cost approach, which adjusted estimates of replacement cost for the age, condition and utility of the associated assets. The intangible assets related to the USWS Acquisition represent developed technology and customer relationship. The fair value of the developed technology was determined using the income approach, which is predicated upon the value of the future cash flows that an asset will generate over its economic life. The fair value of customer relationship was determined using the with-and-without method which is an income approach and considers the time needed to rebuild the customer base. The allocation of the purchase price to USWS’s net tangible assets and liabilities and identifiable intangible assets is preliminary and subject to revisions to the fair value calculations for the identifiable assets and liabilities. The determination and allocation of the purchase consideration are subject to change during the measurement period, up to
The goodwill in this acquisition was primarily attributable to USWS’ organized workforce and potential or expected synergies. We recognized this goodwill in the stimulation services segment. No portion of the recorded goodwill is tax deductible.
Our consolidated results included revenue of $
Monarch Silica, LLC (“Monarch”)
On December 5, 2022, ProFrac II LLC (i) entered into a Membership Interest Purchase Agreement (the “Monarch Purchase Agreement”) by and among ProFrac II LLC, Monarch Capital Holdings, LLC, a Texas limited liability company (“Monarch Capital”), Monarch, David E. Welch and Paul A. Welch, pursuant to which ProFrac II LLC agreed to purchase from Monarch Capital
The Monarch Acquisition was completed on
85
ProFrac Holding Corp.
NOTES TO THE CONSOLIDATED FINANCIAL STATEMENTS
(Amounts in millions, except per share amounts, or where otherwise noted)
$
The following table summarizes the fair value of consideration transferred in the Monarch Acquisition and the allocation of the purchase price to the fair values of assets acquired and liabilities assumed at the Monarch Acquisition Date:
Total purchase consideration |
|
$ |
|
|
|
|
|
|
|
Cash and cash equivalents |
|
|
|
|
Accounts receivable |
|
|
|
|
Inventories |
|
|
|
|
Property, plant and equipment |
|
|
|
|
Operating lease right-of-use assets |
|
|
|
|
Intangible assets |
|
|
|
|
Total identifiable assets acquired |
|
|
|
|
Accounts payable |
|
|
|
|
Accrued expenses |
|
|
|
|
Current portion of operating lease liabilities |
|
|
|
|
Long-term operating lease liabilities |
|
|
|
|
Total liabilities assumed |
|
|
|
|
Goodwill |
|
|
|
|
Total purchase consideration |
|
$ |
|
|
For the acquired property, plant and equipment, the valuation technique utilized was the cost approach, which adjusted estimates of replacement cost for the age, condition and utility of the associated assets. In addition, the market approach valuation technique was used for assets that had comparable market data available. Included in our property, plant and equipment valuation is mineral reserves valued at $
The goodwill in this acquisition was primarily attributable to Monarch’s organized workforce and potential or expected synergies, and is tax deductible. We recognized this goodwill in the proppant production segment.
Our consolidated results included an immaterial amount of revenue and pretax earnings from this acquisition in 2022.
REV Energy Holdings, LLC (“REV”)
On December 23, 2022, ProFrac II LLC entered into a Membership Interest Purchase Agreement (the “REV Purchase Agreement”) by and among ProFrac II LLC, REV, Jason Kuzov, an individual (“Kuzov”), Michell Winnick, an individual (“Winnick”), Buffalo Creek, LLC, an Idaho limited liability company (together with Kuzov and Winnick, the “REV Sellers”), and BCKW LLC, a Colorado limited liability company (the “REV Sellers’ Representative”), pursuant to which ProFrac II LLC agreed to purchase from the REV Sellers
The REV Acquisition was completed on
86
ProFrac Holding Corp.
NOTES TO THE CONSOLIDATED FINANCIAL STATEMENTS
(Amounts in millions, except per share amounts, or where otherwise noted)
earn-out payments to REV Sellers if certain EBITDA-based performance targets are achieved during 2023, as described in the REV Purchase Agreement.
The following table summarizes the fair value of consideration transferred in the REV Acquisition and the allocation of the purchase price to the fair values of assets acquired and liabilities assumed at the REV Acquisition Date:
Total purchase consideration |
|
$ |
|
|
|
|
|
|
|
Cash and cash equivalents |
|
|
|
|
Accounts receivable |
|
|
|
|
Prepaid expense and other assets |
|
|
|
|
Inventories |
|
|
|
|
Property, plant and equipment |
|
|
|
|
Intangible assets |
|
|
|
|
Other assets |
|
|
|
|
Total identifiable assets acquired |
|
|
|
|
Accounts payable |
|
|
|
|
Accrued expenses |
|
|
|
|
Current portion of debt |
|
|
|
|
Long-term debt |
|
|
|
|
Total liabilities assumed |
|
|
|
|
Goodwill |
|
|
|
|
Total purchase consideration |
|
$ |
|
|
For the acquired property, plant and equipment, the valuation technique utilized was the cost approach, which adjusted estimates of replacement cost for the age, condition and utility of the associated assets. The intangible assets related to the REV Acquisition represent customer relationships and the fair value was determined using the income approach, which is predicated upon the value of the future cash flows that an asset will generate over its economic life. The allocation of the purchase price to REV’s net tangible assets and liabilities and identifiable intangible assets is preliminary and subject to revisions to the fair value calculations for the identifiable assets and liabilities. The determination and allocation of the purchase consideration are subject to change during the measurement period, up to
The goodwill in this acquisition was primarily attributable to REV’s organized workforce and potential or expected synergies. We recognized this goodwill in the stimulation services segment. A portion of the recorded goodwill is tax deductible.
Our consolidated results included an immaterial amount of revenue and pretax earnings from this acquisition in 2022.
The following combined pro forma results of operations have been prepared as though the USWS, FTSI, Flotek, Monahans, REV, and Monarch acquisitions had been completed on January 1, 2020. Pro forma amounts presented below are for illustrative purposes only and does not reflect future events that occurred after December 31, 2022 or any operating efficiencies or inefficiencies that may result from these significant acquisitions. The results of operations are not necessarily indicative of results that would have been achieved had we controlled USWS, FTSI, Flotek, Monahans, REV, and Monarch during the periods presented.
|
|
Year Ended December 31, |
|
|||||
(Unaudited) |
|
2022 |
|
|
2021 |
|
||
Revenue |
|
$ |
|
|
$ |
|
||
Net income (loss) |
|
$ |
|
|
$ |
( |
) |
|
EKU Power Drives, GmbH
On December 22, 2020, we purchased a
We obtained a
87
ProFrac Holding Corp.
NOTES TO THE CONSOLIDATED FINANCIAL STATEMENTS
(Amounts in millions, except per share amounts, or where otherwise noted)
our investment in associate, recognized equity of $
iO-TEQ, LLC
We acquired iO-TEQ, LLC in October 2021 for $
Asset Acquisition of West Munger
In November 2021, we entered into an agreement to acquire approximately
The Munger Right Agreement includes a ‘Make Whole’ provision. Under the Make Whole provision, if any seller liquidates
On February 4, 2022, THRC Holdings entered into a Rights Agreement with Encantor Properties LP, one of the sellers from whom we purchased the West Munger property, under which the related party was assigned rights to $
In May 2022, as part of the IPO, we issued
5. INVESTMENTS
Basin Production and Completion LLC
During the year ended December 31, 2021, we purchased Series B-1 Preferred Units of Basin Production and Completion LLC (“BPC”), a manufacturer of equipment used in hydraulic fracturing for $
On February 9, 2022, we entered into an agreement to purchase all the series A-1 and B-1 preferred units of BPC for $
Subsequent to February 9, 2022, our investments in BPC provide us the ability to have significant influence, but not control over BPC’s operations. BPC's business and affairs are managed under the direction of its board of directors, which we do not control. Based on our evaluation, we determined that BPC is a VIE, but we are not the primary beneficiary of the VIE. We have elected the fair value option to account for our equity method investment in BPC. See “Note 14 – Fair Value of Financial Instruments” for more information on our instruments using Level 3 measurements. As of December 31, 2022, the estimated fair value of our investment in BPC was $
88
ProFrac Holding Corp.
NOTES TO THE CONSOLIDATED FINANCIAL STATEMENTS
(Amounts in millions, except per share amounts, or where otherwise noted)
6. DEBT
The following table summarizes our debt:
|
|
December 31, |
|
|||||
|
|
2022 |
|
|
2021 |
|
||
2022 Term Loan Credit Facility |
|
$ |
|
|
$ |
- |
|
|
2018 Term Loan |
|
|
- |
|
|
|
|
|
2022 ABL Credit Facility |
|
|
|
|
|
- |
|
|
2018 ABL Credit Facility |
|
|
- |
|
|
|
|
|
First Financial Loan |
|
|
|
|
|
|
||
REV Note (1) |
|
|
|
|
|
- |
|
|
Monarch Note |
|
|
|
|
|
- |
|
|
Finance Lease Liabilities |
|
|
|
|
|
- |
|
|
Equify Note(1) |
|
|
|
|
|
- |
|
|
Flotek Convertible Notes |
|
|
|
|
|
- |
|
|
Equipment Financings |
|
|
|
|
|
- |
|
|
Best Flow Credit Facility (1) |
|
|
- |
|
|
|
|
|
Best Flow Note (1) |
|
|
- |
|
|
|
|
|
Alpine Promissory Note (1) |
|
|
- |
|
|
|
|
|
Other |
|
|
|
|
|
|
||
Total gross debt |
|
|
|
|
|
|
||
Less: unamortized debt discounts, premiums, and issuance costs |
|
|
( |
) |
|
|
( |
) |
Less: current portion of long-term debt |
|
|
( |
) |
|
|
( |
) |
Total long-term debt |
|
$ |
|
|
$ |
|
||
2022 Term Loan Credit Facility
On March 4, 2022, ProFrac LLC, ProFrac Holdings II, LLC (“ProFrac II LLC”), as borrower, and certain of the Company’s wholly owned subsidiaries as obligors, entered into a senior secured term loan credit agreement that expires on March 4, 2025 (as amended, the “2022 Term Loan Credit Facility”), with Piper Sandler Finance LLC, as administrative agent and collateral agent, and the lenders party thereto, providing for a term loan facility in an aggregate amount of $
The 2022 Term Loan Credit Facility was amended multiple times during the year to, among other things, increase its size by $
Borrowings under the 2022 Term Loan Credit Facility accrue interest at either a SOFR rate or a base rate, plus an applicable margin. The applicable margin for SOFR rate loans ranges from
The 2022 Term Loan Credit Facility requires minimum quarterly payments including prepayments based on a percentage of
The 2022 Term Loan Credit Facility is guaranteed by ProFrac LLC and all of the Company’s material existing subsidiaries and certain direct and indirect future U.S. restricted subsidiaries of the Company. The 2022 Term Loan Credit Facility is secured by a lien on, and security interest in, substantially all of each such guarantor’s assets.
We are required by the 2022 Term Loan Credit Facility to maintain a quarterly debt to EBITDA ratio (defined as the “Total Net Leverage Ratio” in the 2022 Term Loan Credit Facility). We were in compliance with this ratio in 2022. The ratio for 2023 and future periods will be
89
ProFrac Holding Corp.
NOTES TO THE CONSOLIDATED FINANCIAL STATEMENTS
(Amounts in millions, except per share amounts, or where otherwise noted)
The 2022 Term Loan Credit Facility contains certain customary representations and warranties and affirmative and negative covenants. The negative covenants include, subject to customary exceptions, limitations on indebtedness, dividends, distributions and certain other payments, investments, capital expenditures, acquisitions, prepayments of specified junior indebtedness, amendments of specified junior indebtedness, transactions with affiliates, dispositions, mergers and consolidations, liens, restrictive agreements, changes in fiscal periods and changes in line of business.
The 2022 Term Loan Credit Facility contains customary events of default. If an event of default occurs and is continuing, the lenders may declare all loans to be immediately due and payable. Some events of default require an automatic termination of the loans and become immediately due and payable. The Company was in compliance with all covenants, and there were no defaults or events of default related to the 2022 Term Loan Credit Facility, as of December 31, 2022.
2022 ABL Credit Facility
On March 4, 2022, ProFrac LLC, ProFrac II, LLC, as borrower, and certain of the Company’s wholly owned subsidiaries as obligors, entered into a senior secured asset-based revolving credit agreement that expires on
The 2022 ABL Credit Facility initially provided for a maximum availability of $
Borrowings under the 2022 ABL Credit Facility accrue interest at either a SOFR rate or a base rate, plus an applicable margin. The applicable margin for SOFR rate loans ranges from
We are required by the 2022 ABL Credit Facility to maintain minimum liquidity of $
The 2022 ABL Credit Facility contains certain customary representations and warranties and affirmative and negative covenants. The negative covenants include, subject to customary exceptions, limitations on indebtedness, dividends, distributions and certain other payments, investments, acquisitions, prepayments of specified junior indebtedness, amendments of specified junior indebtedness, transactions with affiliates, dispositions, mergers and consolidations, liens, restrictive agreements, sale and leaseback transactions, changes in fiscal periods and changes in line of business. The Company was in compliance with all covenants, and there were no existing defaults or events of default related to the 2022 ABL Credit Facility as of December 31, 2022.
As of December 31, 2022, the maximum availability under the 2022 ABL Credit Facility was the aggregate lender commitments of $
Monarch Note
In connection with our acquisition of Monarch on
The Monarch Note requires minimum quarterly payments of $
The Monarch Note was initially measured at fair value in connection with the Monarch Acquisition, resulting in recording a debt discount of $
90
ProFrac Holding Corp.
NOTES TO THE CONSOLIDATED FINANCIAL STATEMENTS
(Amounts in millions, except per share amounts, or where otherwise noted)
REV Note
In connection with our acquisition of REV on
The REV Note requires a $
The REV note was initially measured at fair value in connection with the REV Acquisition, resulting in recording a debt discount of $
One of the REV Sellers joined the Company in a management capacity upon the acquisition of REV.
First Financial Loan
On July 22, 2020, ProFrac LLC entered into a $
On December 22, 2021, the Main Street Loan had a balance of $
The First Financial Loan has a maturity date of
During the year ended December 31, 2022, the Company made principal payments of $
Flotek Convertible Notes
On February 2, 2022, Flotek entered into a private investment in public equity transaction (the “PIPE Transaction”) with a consortium of investors to secure growth capital. Pursuant to the PIPE Transaction, Flotek issued $
As of December 31, 2022, there was $
Backstop Note
On March 4, 2022, ProFrac LLC borrowed $
Closing Date Note
On March 4, 2022, ProFrac LLC borrowed $
91
ProFrac Holding Corp.
NOTES TO THE CONSOLIDATED FINANCIAL STATEMENTS
(Amounts in millions, except per share amounts, or where otherwise noted)
Credit Facility and the 2022 Term Loan Credit Facility. In June 2022, the Closing Date Note was fully paid with net proceeds from the IPO.
Equify Bridge Note
On March 4, 2022, ProFrac II LLC entered into a $
2018 Term Loan
On September 7, 2018, ProFrac LLC entered into a $
LIBOR borrowings under the 2018 Term Loan bore interest at the greater of LIBOR or
The 2018 Term Loan contained certain restrictive covenants, including a financial covenant which required ProFrac LLC to maintain a total net leverage ratio, as defined in the credit agreement, of no greater than
On
2018 ABL Credit Facility
On March 14, 2018, ProFrac LLC entered into a senior secured asset-based revolving credit agreement (the “2018 ABL Credit Facility”), with Barclays Bank PLC, as administrative agent and collateral agent, and the lenders party thereto. The 2018 ABL Credit Facility had a maturity date of
LIBOR borrowings under the 2018 ABL Credit Facility bore interest at the greater of LIBOR or
As of December 31, 2021, there were $
Best Flow Credit Facility
On February 4, 2019, Best Flow entered into a revolving loan credit agreement (the “Best Flow Credit Facility”), with Equify Financial, LLC (“Equify Financial”) as lender. Equify Financial is a related party. The Best Flow Credit Facility provided for a revolving credit facility in an aggregate principal amount at any time outstanding up to $
On
92
ProFrac Holding Corp.
NOTES TO THE CONSOLIDATED FINANCIAL STATEMENTS
(Amounts in millions, except per share amounts, or where otherwise noted)
Best Flow Note
On January 28, 2021, Best Flow issued a promissory note (the “Best Flow Note”), with Equify Financial, as holder. Equify Financial is a related party. The Best Flow Note provided for a term loan in an initial aggregate principal amount equal to $
Alpine Promissory Note
In January 2021, Alpine entered into a $
Equipment Financings
The Company has equipment financing notes for the purchase of certain hydraulic fracturing equipment. The equipment financing notes have interest rate of
Other Indebtedness
As of December 31, 2022 and 2021, the Company had other debt agreements outstanding with unpaid principal balances of $
As of December 31, 2022, other consolidated indebtedness also included a $
Maturities of Debt
As of December 31, 2022, the
|
|
2023 |
|
|
2024 |
|
|
2025 |
|
|
2026 |
|
|
2027 |
|
|
Thereafter |
|
|
Total |
|
|||||||
2022 ABL Credit Facility |
|
$ |
- |
|
|
$ |
- |
|
|
$ |
- |
|
|
$ |
- |
|
|
$ |
|
|
$ |
- |
|
|
$ |
|
||
2022 Term Loan Credit Facility |
|
|
|
|
|
|
|
|
|
|
|
- |
|
|
|
- |
|
|
|
- |
|
|
|
|
||||
First Financial loan |
|
|
|
|
|
- |
|
|
|
- |
|
|
|
- |
|
|
|
- |
|
|
|
- |
|
|
|
|
||
REV Note (1) |
|
|
|
|
|
|
|
|
|
|
|
- |
|
|
|
- |
|
|
|
- |
|
|
|
|
||||
Monarch Note |
|
|
|
|
|
|
|
|
- |
|
|
|
- |
|
|
|
- |
|
|
|
- |
|
|
|
|
|||
Finance Lease Liabilities |
|
|
|
|
|
|
|
|
|
|
|
|
|
|
|
|
|
- |
|
|
|
|
||||||
Flotek Convertible Notes |
|
|
|
|
|
- |
|
|
|
- |
|
|
|
- |
|
|
|
- |
|
|
|
- |
|
|
|
|
||
Equify Note (1) |
|
|
|
|
|
|
|
|
|
|
|
|
|
|
|
|
|
- |
|
|
|
|
||||||
Equipment Financings |
|
|
|
|
|
|
|
|
- |
|
|
|
- |
|
|
|
- |
|
|
|
- |
|
|
|
|
|||
Other |
|
|
|
|
|
|
|
|
|
|
|
|
|
|
|
|
|
|
|
|
|
|||||||
Total |
|
$ |
|
|
$ |
|
|
$ |
|
|
$ |
|
|
$ |
|
|
$ |
|
|
$ |
|
|||||||
(1) Related party debt agreements.
7. LEASES
Effective January 1, 2022, we adopted the new lease accounting guidance under ASC Topic 842, Leases. We adopted the standard using the current period adjustment approach; accordingly, the comparative information as of December 31, 2021 and 2020, has not been adjusted and continues to be reported under the previous lease standard. Under the new standard, assets and liabilities that arise from all leases are required to be recognized on the consolidated balance sheet for lessees. The adoption of this standard resulted in the recognition of approximately $
93
ProFrac Holding Corp.
NOTES TO THE CONSOLIDATED FINANCIAL STATEMENTS
(Amounts in millions, except per share amounts, or where otherwise noted)
Our leasing arrangements consist of both operating and finance leases. We are a lessee on several leases of real estate, administrative offices, manufacturing and maintenance facilities, light duty vehicles, tractors, and power generation equipment. We do not have any material lessor arrangements.
In connection with the completion of the FTSI Acquisition, FTSI conveyed to Wilks Development, LLC, an affiliate of ProFrac LLC, substantially all of FTSI’s owned real property, consisting primarily of FTSI’s hydraulic fracturing equipment manufacturing facilities, in exchange for cash consideration of approximately $
Our
|
|
Consolidated Balance Sheet Location |
|
December 31, |
|
|
Assets: |
|
|
|
|
|
|
Finance lease right-of-use assets |
|
|
$ |
|
||
Liabilities: |
|
|
|
|
|
|
Current portion of finance lease liabilities |
|
|
$ |
|
||
Finance lease liabilities |
|
|
$ |
|
||
The components of our lease costs are as follows:
|
|
Year Ended |
|
|
|
|
December 31, 2022 |
|
|
Operating lease costs |
|
$ |
|
|
Short-term lease costs |
|
|
|
|
Finance lease costs: |
|
|
|
|
Amortization of right-of-use assets |
|
|
|
|
Interest on lease liabilities |
|
|
|
|
Total lease costs |
|
$ |
|
|
The weighted-average remaining lease term and discount rates used in the measurement of our right-of-use assets and lease liabilities are as follows:
|
|
Year Ended |
|
|
|
|
December 31, 2022 |
|
|
Weighted-average remaining lease term: |
|
|
|
|
Operating leases |
|
|
||
Finance leases |
|
|
||
Weighted average discount rate: |
|
|
|
|
Operating leases |
|
|
% |
|
Finance leases |
|
|
% |
|
The following table includes other supplemental information for our leases:
|
|
Year Ended |
|
|
|
|
December 31, 2022 |
|
|
Cash paid for amounts included in the measurement of lease obligations: |
|
|
|
|
Operating leases |
|
$ |
|
|
Finance leases |
|
$ |
|
|
Right-of-use assets obtained in exchange for new lease obligations: |
|
|
|
|
Operating leases |
|
$ |
|
|
Finance leases |
|
$ |
|
|
Operating lease right-of-use assets recognized upon adoption of the leasing standard |
|
$ |
|
|
94
ProFrac Holding Corp.
NOTES TO THE CONSOLIDATED FINANCIAL STATEMENTS
(Amounts in millions, except per share amounts, or where otherwise noted)
As of December 31, 2022, the future maturities of our leases liabilities are as follows:
Fiscal Year |
|
Operating Leases |
|
|
Finance Leases |
|
||
2023 |
|
$ |
|
|
$ |
|
||
2024 |
|
|
|
|
|
|
||
2025 |
|
|
|
|
|
|
||
2026 |
|
|
|
|
|
|
||
2027 |
|
|
|
|
|
|
||
Thereafter |
|
|
|
|
|
- |
|
|
Total lease payments |
|
|
|
|
|
|
||
Less imputed interest |
|
|
( |
) |
|
|
( |
) |
Total lease liabilities |
|
$ |
|
|
$ |
|
||
8. EQUITY
As described in “Note 1 - Organization and Description of Business”, we completed our IPO on May 17, 2022. The types of equity we are authorized to issue and the related rights and preferences are summarized below.
Preferred Stock
The Company is authorized to issue
Class A Common Stock
The Company is authorized to issue
Class B Common Stock
The Company is authorized to issue
Best Flow Noncontrolling Interests
In December 2021, the Company entered into an agreement with Eagleton Venture, Inc. (“Eagleton”) to purchase Eagleton’s approximate
9. OTHER OPERATING (INCOME) EXPENSES, NET
|
|
Year Ended December 31, |
|
|||||||||
|
|
2022 |
|
|
2021 |
|
|
2020 |
|
|||
Loss on disposal of assets, net |
|
$ |
|
|
$ |
|
|
$ |
|
|||
Accruals for legal contingencies |
|
|
|
|
|
- |
|
|
|
- |
|
|
Provision for credit losses, net of recoveries |
|
|
|
|
|
( |
) |
|
|
|
||
Loss on foreign currency transactions |
|
|
- |
|
|
|
|
|
|
- |
|
|
Reorganization costs |
|
|
- |
|
|
|
|
|
|
- |
|
|
Severance charges |
|
|
- |
|
|
|
|
|
|
- |
|
|
Supply commitment charges |
|
|
- |
|
|
|
- |
|
|
|
|
|
Total |
|
$ |
|
|
$ |
|
|
$ |
|
|||
95
ProFrac Holding Corp.
NOTES TO THE CONSOLIDATED FINANCIAL STATEMENTS
(Amounts in millions, except per share amounts, or where otherwise noted)
Loss on disposal of assets, net consists of gains or losses on excess property, early equipment failures, and other asset dispositions.
Accruals for legal contingencies represent estimates for significant loss contingencies with regards to certain vendor disputes and litigation matters. See “Note 13 - Commitments and Contingencies” for discussion of significant litigation matters.
10. STOCK-BASED COMPENSATION
Stock-based Compensation Related to Deemed Contributions
In connection with the Company’s IPO, our majority shareholders, Farris Wilks (“Farris”) and Dan Wilks (“Dan”) (together with certain family members or entities they control), sold Units representing approximately
Also in connection with the IPO, Farris engaged in estate planning that may result, subject to other terms and conditions, in additional shares being transferred by Farris to Ladd if the Company’s total market capitalization increases to certain target levels within the next five years, which resulted in a performance award being deemed granted by the Company to Ladd. We concluded that this arrangement should be treated, for accounting purposes, in accordance with ASC Topic 718, Compensation — Stock Compensation, as a deemed contribution to the Company by a related party and the grant of stock-based compensation with market conditions to Ladd by the Company.
The grant date fair value of this award was estimated to be $
The derived service period for the award was determined based on the median vesting time for the simulations that achieved the vesting hurdle.
Long Term Incentive Plan
In May 2022, we adopted the ProFrac Holding Corp. 2022 Long Term Incentive Plan (“2022 Plan”) to attract and retain officers, employees, directors, and other key personnel and to provide those persons incentives and awards for performance. The 2022 Plan originally allocated
Pursuant to the 2022 Plan, we granted RSUs to certain employees and directors. The RSUs granted generally vests over one to four years from the grant date. The grant date fair value of the RSUs is determined using the closing price of our Class A Common Stock on the grant date.
96
ProFrac Holding Corp.
NOTES TO THE CONSOLIDATED FINANCIAL STATEMENTS
(Amounts in millions, except per share amounts, or where otherwise noted)
The following table summarizes the activity related to our RSUs:
|
|
Units |
|
|
Grant Date Weighted- |
|
||
Outstanding at December 31, 2021 |
|
|
- |
|
|
$ |
- |
|
Granted |
|
|
|
|
|
|
||
Vested |
|
|
- |
|
|
|
- |
|
Forfeited |
|
|
- |
|
|
|
- |
|
Outstanding at December 31, 2022 |
|
|
|
|
$ |
|
||
The weighted-average grant-date fair value per share of RSUs granted was $
Flotek Stock-based Compensation Expense
Flotek stockholders have approved long-term incentive plans under which Flotek may grant equity awards to officers, key employees, non-employee directors and service providers in the form of stock options, restricted stock, restricted stock units, and certain other incentive awards. See “Note 4 - Business Combinations and Asset Acquisition” for additional information on the Flotek acquisition. As of December 31, 2022, there was $
Compensation Expense
For the year ending December 31, 2022, total stock-based compensation expense amounted to $
11. INCOME TAXES
Before May 17, 2022, the ProFrac Predecessor entities were organized as limited liability companies or a limited partnership and were treated as either a disregarded entity or a partnership for U.S. federal income tax purposes, whereby the ordinary business income or loss and certain deductions were passed-through and reported on the members’ income tax returns. As such, we were not required to account for U.S. federal income taxes in our consolidated financial statements. Certain state income-based taxes are imposed on the Company which are reflected as income tax expense or benefit in historical periods. In connection with the IPO in May 2022, the Company reorganized and ProFrac LLC became partially owned by ProFrac Corp., a C-Corporation. ProFrac Corp. is a taxable entity and is required to account for income taxes under the asset and liability method for periods subsequent to May 17, 2022.
The following table summarizes the components of income tax expense (benefit):
|
|
Year Ended December 31, |
|
|
|
|
2022 |
|
|
Current income taxes: |
|
|
|
|
Federal |
|
$ |
|
|
State |
|
|
|
|
Total current |
|
|
|
|
|
|
|
|
|
Deferred income taxes: |
|
|
|
|
Federal |
|
|
|
|
State |
|
|
|
|
Total deferred |
|
|
|
|
|
|
|
|
|
Income tax expense |
|
$ |
|
|
97
ProFrac Holding Corp.
NOTES TO THE CONSOLIDATED FINANCIAL STATEMENTS
(Amounts in millions, except per share amounts, or where otherwise noted)
Actual income tax expense (benefit) differed from the amount computed by applying the statutory federal income tax rate to income (loss) before income taxes as follows:
|
|
December 31, 2022 |
|
|
Income before income taxes |
|
$ |
|
|
Statutory rate |
|
|
||
Federal income tax expense at statutory rate |
|
|
|
|
State taxes, net of federal benefit |
|
|
|
|
Permanent items |
|
|
|
|
Other |
|
|
( |
) |
Non-controlling interest |
|
|
( |
) |
Valuation allowance |
|
|
( |
) |
Income tax expense |
|
$ |
|
|
Effective tax rate |
|
|
% |
|
The Company’s effective tax rate will generally be lower than the federal corporate income tax rate of
The tax effects of temporary differences that give rise to significant portions of the deferred tax assets and deferred tax liabilities are presented below:
|
|
December 31, |
|
|
|
|
2022 |
|
|
Deferred tax assets: |
|
|
|
|
Net operating loss carryforward |
|
$ |
|
|
Investment in ProFrac Holdings, LLC |
|
|
|
|
Tax receivable agreement |
|
|
|
|
Flotek net operating loss and tax credit carryforwards |
|
|
|
|
Flotek intangible assets and goodwill |
|
|
|
|
Flotek other |
|
|
|
|
Gross deferred tax assets |
|
|
|
|
Valuation allowance |
|
|
( |
) |
Total deferred tax assets |
|
|
|
|
|
|
|
|
|
Deferred tax liabilities: |
|
|
|
|
Flotek right-of-use asset and other |
|
|
( |
) |
Total deferred tax liabilities |
|
|
( | ) |
|
|
|
|
|
Net deferred tax assets |
|
$ |
|
|
As of December 31, 2022, the Company had approximately $
The Company also has $
We have established a valuation allowance on substantially all of the Company’s net deferred tax assets. As a result, we only recorded income tax expense for current year tax expense. Deferred tax assets related to our U.S. federal and state tax net operating losses are still available to us to offset future taxable income, subject to limitations in the event of a change of control under Section 382 of the Internal Revenue Code. At December 31, 2022, we had not incurred such an ownership change.
98
ProFrac Holding Corp.
NOTES TO THE CONSOLIDATED FINANCIAL STATEMENTS
(Amounts in millions, except per share amounts, or where otherwise noted)
At each reporting date, we consider all available positive and negative evidence to evaluate whether our deferred tax assets are more likely than not to be realized. A significant piece of negative evidence that we consider is whether we have incurred cumulative losses (generally defined as losses before income taxes) in recent years. Such negative evidence weighs heavily against other more subjective positive evidence such as our projections for future taxable income. We noted that for the three years ended December 31, 2022, we recorded cumulative income before income taxes of $
The primary positive evidence we noted was:
The primary negative evidence we noted was:
If we continue to generate income before income taxes in future periods and if our forecasts become more accurate due to the cycles of the hydraulic fracturing industry becoming less significant, we may be able to recognize a portion of our net deferred tax assets in future periods. We will adjust the valuation allowance based on our evaluation of new information as it becomes available and new circumstances as they occur. A change in our assessment could cause a decrease to the valuation allowance, which could materially impact our results of operations. Due to the prevailing negative evidence cited above, we believe that the earliest period when we may adjust the valuation allowance is the fourth quarter of 2023.
At December 31, 2022, we had
ProFrac LLC is obligated to make cash distributions to the redeemable noncontrolling interest holders to fund their respective income tax liabilities relating to their share of the income of ProFrac LLC. In the fourth quarter of 2022, the Company paid a distribution of $
ProFrac Holding Corp and its U.S. subsidiaries join in the filing of a U.S. federal consolidated income tax return. Our income tax returns, along with income tax returns for FTSI and USWS, are currently subject to examination in federal and state jurisdictions primarily for tax years from 2018-2021.
99
ProFrac Holding Corp.
NOTES TO THE CONSOLIDATED FINANCIAL STATEMENTS
(Amounts in millions, except per share amounts, or where otherwise noted)
12. EARNINGS PER SHARE
Earnings per common share for our Class A Common Stock for the year ended December 31, 2022 was calculated as follows:
|
|
Year Ended December 31, |
|
|
|
|
2022 |
|
|
Numerator: |
|
|
|
|
Net income attributable to ProFrac Holding Corp. |
|
$ |
|
|
Net income reallocated to dilutive Class A common shares |
|
|
|
|
Net income attributable to ProFrac Holding Corp. used for diluted earnings per Class A common share |
|
$ |
|
|
|
|
|
|
|
Denominator: |
|
|
|
|
Weighted average Class A common shares used for basic EPS computation |
|
|
|
|
Dilutive potential of employee restricted stock units |
|
|
|
|
Weighted average Class A common shares used for diluted EPS computation |
|
|
|
|
Basic and diluted earnings per Class A common share |
|
$ |
|
|
The basic and diluted earnings per share (“EPS”) for the year ended December 31, 2022, represents only the period from the IPO date of May 17, 2022, to December 31, 2022, which represents the period wherein the Company had outstanding Class A common stock.
13. COMMITMENTS AND CONTINGENCIES
Litigation
In the ordinary course of business, we are the subject of, or party to a number of pending or threatened legal actions and administrative proceedings. While many of these matters involve inherent uncertainty, we believe that, other than as described below, the amount of the liability, if any, ultimately incurred with respect to proceedings or claims will not have a material adverse effect on our consolidated financial position as a whole or on our liquidity, capital resources or future annual results of operations.
U.S. Well Services Inc. and U.S. Well Services, LLC (collectively, “USWS”) v. Halliburton Company and Cimarex Energy Co. (collectively, “Halliburton”): In April 2021, USWS filed a patent infringement suit against Halliburton in United States District Court for the Western District of Texas Waco Division. In the suit, USWS alleges willful infringement of seven U.S. patents based on Halliburton’s “All-Electric Fracturing Fleet.” The trial was previously scheduled for March 2023, but has been postponed to a date yet to be determined in August 2023 or later.
In June 2021, Halliburton filed inter partes review petitions against these USWS patents. In January 2023, the Patent Trial and Appeal Board (“PTAB”) entered final written decisions finding certain claims of these patents invalid. In March 2023, USWS filed a notice of appeal of the final written decisions invalidating certain claims of three of these patents. Other appeal deadlines remain open. In May 2022, the Western District of Texas ruled certain claims of five of the USWS patents are invalid.
In May 2022, Halliburton filed an amended answer to this patent infringement suit counterclaiming for declaratory judgment of invalidity of USWS’ patents asserted against Halliburton in this matter and willful infringement of seven of Halliburton’s U.S. patents based on USWS’ “Clean Fleets.” In June 2022, USWS filed inter partes review petitions against four of Halliburton’s patents. In December 2022, the PTAB denied institution of inter partes review against these four patents.
The outcome of Halliburton’s counterclaim against us is uncertain and the ultimate resolution of it could have a material adverse effect on our consolidated financial statements in the period in which the resolution is recorded.
100
ProFrac Holding Corp.
NOTES TO THE CONSOLIDATED FINANCIAL STATEMENTS
(Amounts in millions, except per share amounts, or where otherwise noted)
Halliburton Energy Services, Inc., Halliburton US Technologies, Inc., and Halliburton Group Technologies, Inc. (collectively, “Halliburton”) v. U.S. Well Services, LLC (“USWS”): In September 2022, Halliburton filed two patent infringement suits against USWS in United States District Court for the Western District of Texas Waco Division. In the first lawsuit, Halliburton alleges willful infringement of three of its previously asserted patents as well as five additional U.S. patents. In the second lawsuit, Halliburton alleges willful infringement of two of its previously asserted patents as well as five additional U.S. patents. Both lawsuits allege infringement based on USWS’ “Clean Fleet” and “Nyx Clean Fleet” as well as ProFrac’s “Simul-Frac.” The two lawsuits are scheduled together and set for trial in May 2024.
In January 2023, USWS filed amended answers to these patent infringement suits counterclaiming for declaratory judgment of invalidity of Halliburton’s patents asserted against USWS in this matter and willful infringement of two additional USWS’ U.S. patents based on Halliburton’s “All-Electric Fracturing Fleet.” In February 2023, Halliburton filed inter partes review petitions against these USWS patents.
The outcomes of these cases are uncertain and the ultimate resolution of them could have a material adverse effect on our consolidated financial statements in the period in which the resolution is recorded.
Patterson v. FTS International Manufacturing, LLC and FTS International Services, LLC (collectively, “FTS”): On June 24, 2015, Joshua Patterson filed a lawsuit in the 115th Judicial District Court of Upshur County, Texas, alleging, among other things, that FTS was negligent with respect to an automobile accident in 2013. Mr. Patterson sought monetary relief of more than $
Lonestar Prospects, Ltd. d/b/a Vista Sand v. ProFrac Services, LLC: ProFrac Services, LLC (“ProFrac Services”) entered into a Master Purchase Agreement For Products And/Or Services with Lonestar Prospects, Ltd. d/b/a Vista Sand (“Vista”), dated November 27, 2017 (the “Vista MSA”), as amended by the First Addendum to Vista MSA and the First Amendment to Vista MSA, both of which are dated June 10, 2018 (collectively, the “Vista Agreement”). Under the terms of the Vista Agreement, ProFrac Services agreed to purchase certain quantities of sand from Vista. Vista filed a complaint against ProFrac Services in the United States Bankruptcy Court for the Northern District of Texas on March 15, 2021, in which it alleged that ProFrac Services breached the terms of the Vista Agreement by failing to purchase the required amount of sand or pay for the underpurchased amounts as required by the Vista Agreement. Vista was seeking damages of approximately $
We estimate and provide for potential losses that may arise out of legal proceedings and claims to the extent that such losses are probable and can be reasonably estimated. Significant judgment is required in making these estimates and our final liabilities may ultimately be materially different from these estimates. When preparing our estimates, we consider, among other factors, the progress of each legal proceeding and claim, our experience and the experience of others in similar legal proceedings and claims, and the opinions and views of legal counsel. Legal costs related to litigation contingencies are expensed as incurred.
101
ProFrac Holding Corp.
NOTES TO THE CONSOLIDATED FINANCIAL STATEMENTS
(Amounts in millions, except per share amounts, or where otherwise noted)
Tax Receivable Agreement
In connection with our IPO, ProFrac Corp. entered into a tax receivable agreement (the “TRA”) with certain Unit holders (the “TRA Holders”). The TRA generally provides for payment by ProFrac Corp. to the TRA Holders of
The term of the TRA commenced upon the completion of the IPO and will continue until all tax benefits that are subject to the TRA have been utilized or expired, unless we experience a Change of Control (as defined in the TRA, which includes certain mergers, asset sales, or other forms of business combinations) or the TRA otherwise terminates early (at our election or as a result of our breach or the commencement of bankruptcy or similar proceedings by or against us) and ProFrac Corp. makes the termination payments specified in the TRA in connection with such Change of Control or other early termination. In the event that the TRA is not terminated, the payments under the TRA could commence in 2023 and will continue for
Payments will generally be made under the TRA as we realize actual cash tax savings from the tax benefits covered by the TRA. However, if we experience a Change of Control or the TRA otherwise terminates early, ProFrac Corp.’s obligations under the TRA would accelerate and ProFrac Corp. would be required to make an immediate payment equal to the present value of the anticipated future payments to be made by it under the TRA. For example, if a Change of Control or other early termination event had occurred on December 31, 2022, we estimate the payment could have ranged up to more than $
Estimating the amount and timing of payments that may become due under the TRA is by its nature imprecise. For purposes of the TRA, net cash tax savings generally are calculated by comparing ProFrac Corp.’s actual tax liability (determined by using the actual applicable U.S. federal income tax rate and an assumed combined state and local income and franchise tax rate) to the amount ProFrac Corp. would have been required to pay had it not been able to utilize any of the tax benefits subject to the TRA. The actual increases in tax basis covered by the TRA, as well as the amount and timing of any payments under the TRA, will vary depending on a number of factors, including the timing of any redemption of Units, the price of ProFrac Corp.’s Class A Common Stock at the time of each redemption, the extent to which such redemptions are taxable transactions, the amount of the redeeming Unit holder’s tax basis in its Units at the time of the relevant redemption, the depreciation and amortization periods that apply to the increase in tax basis, the amount and timing of taxable income we generate in the future, the U.S. federal income tax rates then applicable, and the portion of ProFrac Corp.’s payments under the TRA that constitute imputed interest or give rise to depreciable or amortizable tax basis.
We account for amounts payable under the TRA when we determine that a liability is probable and the amount is reasonably estimable. As of December 31, 2022, the liability from the TRA was $
Purchase Commitments
During 2021, USWS entered into an Equipment Purchase and Sale Agreement to purchase hydraulic fracturing equipment. As of December 31, 2022, the purchase commitments under this agreement are $
During 2022, USWS placed orders for additional hydraulic fracturing equipment related to the buildout of its new Nyx Clean Fleets®. Under the terms of the purchase orders, the Company is subject to a penalty fee for any equipment canceled prior to delivery. As of December 31, 2022, total cost of equipment not yet received by the Company under the purchase orders was $
102
ProFrac Holding Corp.
NOTES TO THE CONSOLIDATED FINANCIAL STATEMENTS
(Amounts in millions, except per share amounts, or where otherwise noted)
14. FAIR VALUE OF FINANCIAL INSTRUMENTS
Nonrecurring Measurements
We have certain assets and liabilities that are not measured at fair value on an ongoing basis but were subjected to fair value adjustments at the time of acquisition. These include long-lived assets and liabilities acquired through our business combination activities and purchase consideration in the form of seller-financed long-term notes payable, the fair values of which were determined using applicable valuation models based on significant unobservable inputs classified as level 3 in the fair value hierarchy. See “Note 4 - Business Combinations and Asset Acquisition,” for additional information.
Recurring Measurements
The following table presents the placement in the fair value hierarchy of assets and liabilities that were measured at fair value on a recurring basis at December 31, 2022. There were
|
|
Fair value measurements using |
|
|||||||||
|
|
Level 1 |
|
|
Level 2 |
|
|
Level 3 |
|
|||
Assets: |
|
|
|
|
|
|
|
|
|
|||
BPC Investment |
|
$ |
- |
|
|
$ |
- |
|
|
$ |
|
|
Liabilities: |
|
|
|
|
|
|
|
|
|
|||
Earnout Payments |
|
$ |
- |
|
|
$ |
- |
|
|
$ |
|
|
Public warrants |
|
|
|
|
|
- |
|
|
|
- |
|
|
Total liabilities |
|
$ |
|
|
$ |
- |
|
|
$ |
|
||
The estimated fair value of the BPC Investment was determined using a combination of the market and income approaches.
The fair value of the earnout payment from the REV Acquisition has been estimated using a Black-Scholes model, adjusted for the capped amount as described in “Note 4 - Business Combinations and Asset Acquisition.” Furthermore, the adjusted earnout payment was discounted using a company-specific credit spread to account for the counterparty credit risk in making the payments. The significant inputs used in the fair value measurement include the risk free rate, credit spread of the acquirer, discount rate, EBITDA forecast, and volatility.
The fair value of the public warrants is determined using quoted market prices, as they are traded in active markets.
The following is a reconciliation of the beginning and ending balances for assets measured at fair value on a recurring basis using significant unobservable inputs (Level 3) from inception to December 31, 2022:
Fair value as of January 1, 2022 |
|
$ |
- |
|
Acquisition of Flotek Convertible Notes |
|
|
|
|
Acquisition of investment in BPC |
|
|
|
|
Transfer of cost method BPC investment to Level 3 fair value measurement |
|
|
|
|
Change in Flotek fair value up to acquisition date |
|
|
|
|
Elimination of Flotek Convertible Notes at acquisition date |
|
|
( |
) |
Change in BPC fair value |
|
|
|
|
Fair value as of December 31, 2022 |
|
$ |
|
The estimated fair value of the Flotek Convertible Notes prior to our consolidation of Flotek on May 17, 2022 was valued using a Monte Carlo simulation with inputs such as the market trading price of Flotek’s common stock, the expected volatility of the Flotek’s stock price based on historical trends, a risk-free rate of interest based on US Treasury note rates and the term of the debt, the time to liquidation based on the maturity date of the notes, and a discount rate adjusted based on the credit risk of Flotek.
The key inputs into the Monte Carlo simulation used to estimate the fair value the Flotek Convertible Notes were as follows:
|
|
May 17, |
|
|
Risk-free interest rate |
|
|
% |
|
Expected volatility |
|
|
% |
|
Term until liquidation (years) |
|
|
|
|
Stock price |
|
$ |
|
|
103
ProFrac Holding Corp.
NOTES TO THE CONSOLIDATED FINANCIAL STATEMENTS
(Amounts in millions, except per share amounts, or where otherwise noted)
15. BUSINESS SEGMENTS
Our business has
We account for intersegment transactions as if the transactions were with third parties, that is, at estimated current market prices. For the years ended December 31, 2022, 2021 and 2020, intersegment revenues for the proppant production segment were
The performance of our segments is evaluated primarily on Adjusted EBITDA. We define Adjusted EBITDA as our net income (loss), before (i) interest expense, net, (ii) income tax expense or benefit, (iii) depreciation, depletion and amortization, (iv) loss on disposal of assets, and (v) stock-based compensation, and (vi) other unusual or non-recurring charges, such as costs related to our initial public offering, non-recurring supply commitment charges, provision for credit losses, loss on extinguishment of debt and gain on investments.
Segment information, and a reconciliation of Adjusted EBITDA are as follows:
|
|
Year Ended December 31, |
|
|||||||||
|
|
2022 |
|
|
2021 |
|
|
2020 |
|
|||
Revenues: |
|
|
|
|
|
|
|
|
|
|||
Stimulation Services |
|
$ |
|
|
$ |
|
|
$ |
|
|||
Proppant Production |
|
|
|
|
|
|
|
|
|
|||
Manufacturing |
|
|
|
|
|
|
|
|
|
|||
Other |
|
|
|
|
|
- |
|
|
|
- |
|
|
Total segments |
|
|
|
|
|
|
|
|
|
|||
Eliminations |
|
|
( |
) |
|
|
( |
) |
|
|
( |
) |
Total revenues |
|
$ |
|
|
$ |
|
|
$ |
|
|||
Adjusted EBITDA: |
|
|
|
|
|
|
|
|
|
|||
Stimulation Services |
|
$ |
|
|
$ |
|
|
$ |
|
|||
Proppant Production |
|
|
|
|
|
|
|
|
|
|||
Manufacturing |
|
|
|
|
|
|
|
|
|
|||
Other |
|
|
( |
) |
|
|
- |
|
|
|
- |
|
Adjusted EBITDA for reportable segments |
|
|
|
|
|
|
|
|
|
|||
Interest expense, net |
|
|
( |
) |
|
|
( |
) |
|
|
( |
) |
Depreciation, depletion and amortization |
|
|
( |
) |
|
|
( |
) |
|
|
( |
) |
Income tax benefit (expense) |
|
|
( |
) |
|
|
|
|
|
( |
) |
|
Loss on disposal of assets, net |
|
|
( |
) |
|
|
( |
) |
|
|
( |
) |
Loss on extinguishment of debt |
|
|
( |
) |
|
|
( |
) |
|
|
- |
|
Accruals for legal contingencies |
|
|
( |
) |
|
|
- |
|
|
|
- |
|
Stock-based compensation |
|
|
( |
) |
|
|
- |
|
|
|
- |
|
Stock-based compensation related to deemed contributions |
|
|
( |
) |
|
|
- |
|
|
|
- |
|
Provision for credit losses, net of recoveries |
|
|
( |
) |
|
|
|
|
|
( |
) |
|
Loss on foreign currency transactions |
|
|
- |
|
|
|
( |
) |
|
|
- |
|
Reorganization costs |
|
|
- |
|
|
|
( |
) |
|
|
- |
|
Acquisition related expenses |
|
|
( |
) |
|
|
- |
|
|
|
- |
|
Severance charges |
|
|
- |
|
|
|
( |
) |
|
|
- |
|
Supply commitment charges |
|
|
- |
|
|
|
- |
|
|
|
( |
) |
Unrealized gain on investments, net |
|
|
|
|
|
- |
|
|
|
- |
|
|
Net income (loss) |
|
$ |
|
|
$ |
( |
) |
|
$ |
( |
) |
|
104
ProFrac Holding Corp.
NOTES TO THE CONSOLIDATED FINANCIAL STATEMENTS
(Amounts in millions, except per share amounts, or where otherwise noted)
Revenues related to external customers by segment are as follows:
|
|
Year Ended December 31, |
|
|||||||||
|
|
2022 |
|
|
2021 |
|
|
2020 |
|
|||
Revenues: |
|
|
|
|
|
|
|
|
|
|||
Stimulation Services |
|
$ |
|
|
$ |
|
|
$ |
|
|||
Proppant Production |
|
|
|
|
|
|
|
|
|
|||
Manufacturing |
|
|
|
|
|
|
|
|
|
|||
Other |
|
|
|
|
|
- |
|
|
|
- |
|
|
Total revenues |
|
$ |
|
|
$ |
|
|
$ |
|
|||
Total assets by segment are as follows:
|
|
December 31, |
|
|||||
|
|
2022 |
|
|
2021 |
|
||
Total assets: |
|
|
|
|
|
|
||
Stimulation Services |
|
$ |
|
|
$ |
|
||
Proppant Production |
|
|
|
|
|
|
||
Manufacturing |
|
|
|
|
|
|
||
Other |
|
|
|
|
|
- |
|
|
Total segment assets |
|
|
|
|
|
|
||
Eliminations |
|
|
( |
) |
|
|
( |
) |
Total assets |
|
$ |
|
|
$ |
|
||
16. RELATED PARTY TRANSACTIONS
In the normal course of business, the Company has entered into transactions with related parties where the Wilks Parties hold a controlling financial interest. During the years ended December 31, 2022, 2021 and 2020, the Company had related party transactions with the following related party entities:
Automatize, LLC (“Automatize”) is a logistics broker that facilitates the last-mile delivery of proppants on behalf of its customers, including the Company. Amounts paid to Automatize include costs passed through to third-party trucking companies and a commission retained by Automatize. These payments are recorded in cost of revenues, exclusive of depreciation and depletion on our consolidated statements of operations.
Cisco Logistics, LLC (“Cisco Logistics”) is a logistics company that delivers sand and equipment on behalf of its customers, including the Company. Amounts paid to Cisco Logistics are recorded in cost of revenues, exclusive of depreciation and depletion on our consolidated statements of operations. Additionally, during 2021 the Company incurred costs associated with the refurbishment of certain equipment owned by Cisco Logistics and recorded a receivable of $
Equify Risk Services, LLC (“Equify Risk”) is an insurance broker that negotiates and secures insurance policies on behalf of its customers, including the Company. Amounts paid to Equify Risk are recorded in selling, general and administrative expenses on our consolidated statements of operations.
Equify Financial, LLC (“Equify Financial”) is a finance company that provides equipment and other financing to its customers, including the Company. Amounts paid to Equify Financial are recorded in interest expenses on our consolidated statements of operations, and repayments of long-term debt on our consolidated statements of cash flows. See “Note 6 –Debt” for additional disclosures related to related party credit agreements.
Wilks Brothers, LLC (“Wilks Brothers”) is a management company which provides administrative support to various businesses within its portfolio. Wilks Brothers and certain entities under its control will at times incur expenses on behalf of the Company, billing the Company for these expenses at cost as well as certain management fees. Amounts paid to Wilks Brothers are generally recorded in selling, general and administrative expenses on our consolidated statements of operations.
Interstate Explorations, LLC (“Interstate”) is an exploration and development company for which the Company performs pressure pumping services, and from which the Company has a short-term lease for certain office space.
Flying A Pump Services, LLC (“Flying A”) is an oilfield services company which provides pressure pumping, acid, and cementing services, to which the Company rents and sells equipment and frac fleet components.
105
ProFrac Holding Corp.
NOTES TO THE CONSOLIDATED FINANCIAL STATEMENTS
(Amounts in millions, except per share amounts, or where otherwise noted)
MC Estates, LLC, The Shops at Willow Park, and FTSI Industrial, LLC (collectively, the “Related Lessors”) own various industrial parks and office space leased by the Company. Amounts paid to the Related Lessors are recorded in selling, general and administrative expenses on our consolidated statements of operations.
Wilks Construction Company, LLC (“Wilks Construction”) is a construction company that has built and made renovations to several buildings for the Company, including construction of a new sand plant. Amounts paid to Wilks Construction are recorded in capital expenditures on our consolidated statements of cash flows.
3 Twenty-Three, LLC (“3 Twenty-Three”) is a payroll administrator which performs payroll services on behalf of its customers, including the Company. Amounts paid to 3 Twenty-Three are recorded in cost of revenues, exclusive of depreciation and depletion and selling, general and administrative expenses on our consolidated statements of operations.
Carbo Ceramics Inc. (“Carbo”) is a provider of ceramic proppant which will at times purchase conventional proppant from the Company to act as a broker for its customers. Additionally, the Company will at times purchase manufactured proppant from Carbo for the stimulation services segment.
FHE USA LLC (“FHE”) is a provider of production and well completion equipment used at the wellsite. Its RigLock™ and FracLock systems remotely connect surface equipment to the wellhead that keeps crews safer and speeds up operations while also reducing the volume of high-pressure iron. Amounts paid to FHE are recorded in capital expenditures on our consolidated statements of cash flows.
The following table summarizes revenue from related parties:
|
|
Year Ended December 31, |
|
|||||||||
|
|
2022 |
|
|
2021 |
|
|
2020 |
|
|||
Flying A |
|
$ |
|
|
$ |
|
|
$ |
|
|||
Carbo |
|
|
|
|
|
|
|
|
|
|||
Wilks Brothers |
|
|
- |
|
|
|
|
|
|
- |
|
|
Interstate |
|
|
- |
|
|
|
|
|
|
- |
|
|
Automatize |
|
|
- |
|
|
|
- |
|
|
|
|
|
Other |
|
|
- |
|
|
|
- |
|
|
|
|
|
Total revenues—related party |
|
$ |
|
|
$ |
|
|
$ |
|
|||
The following table summarizes expenditures with related parties:
|
|
Year Ended December 31, |
|
|||||||||
|
|
2022 |
|
|
2021 |
|
|
2020 |
|
|||
Automatize |
|
$ |
|
|
$ |
|
|
$ |
|
|||
FHE |
|
|
|
|
|
- |
|
|
|
- |
|
|
Wilks Brothers |
|
|
|
|
|
|
|
|
|
|||
Related Lessors |
|
|
|
|
|
|
|
|
|
|||
Wilks Construction |
|
|
|
|
|
- |
|
|
|
|
||
Equify Financial |
|
|
|
|
|
|
|
|
|
|||
3 Twenty-Three |
|
|
|
|
|
|
|
|
|
|||
Carbo |
|
|
|
|
|
|
|
|
- |
|
||
Cisco Logistics |
|
|
- |
|
|
|
|
|
|
|
||
Interstate |
|
|
- |
|
|
|
|
|
|
- |
|
|
Equify Risk |
|
|
- |
|
|
|
- |
|
|
|
|
|
Other |
|
|
|
|
|
|
|
|
- |
|
||
Total expenditures—related party |
|
$ |
|
|
$ |
|
|
$ |
|
|||
The following table summarizes related party accounts receivable:
|
|
December 31, |
|
|||||
|
|
2022 |
|
|
2021 |
|
||
Flying A |
|
$ |
|
|
$ |
|
||
Cisco Logistics |
|
|
- |
|
|
|
|
|
Carbo |
|
|
|
|
|
|
||
Interstate |
|
|
|
|
|
- |
|
|
Other |
|
|
|
|
|
- |
|
|
Total accounts receivable—related party |
|
$ |
|
|
$ |
|
||
106
ProFrac Holding Corp.
NOTES TO THE CONSOLIDATED FINANCIAL STATEMENTS
(Amounts in millions, except per share amounts, or where otherwise noted)
The following table summarizes related party accounts payable:
|
|
December 31, |
|
|||||
|
|
2022 |
|
|
2021 |
|
||
Automatize |
|
$ |
|
|
$ |
|
||
Wilks Brothers |
|
|
|
|
|
|
||
Wilks Construction |
|
|
|
|
|
|
||
Carbo |
|
|
|
|
|
- |
|
|
Total accounts payable—related party |
|
$ |
|
|
$ |
|
||
Additionally, in January and February of 2021, ProFrac LLC executed two agreements with one of ProFrac LLC’s members for the sale of certain lots of equipment, in exchange for $
On February 4, 2022, THRC Holdings entered into a Rights Agreement with Encantor Properties LP, one of the sellers from whom the Company purchased the West Munger property, under which the related party was assigned rights to $
On January 11, 2023, the board of directors of ProFrac Corp. approved the appointment of Mr. Coy Randle, the then Chief Operating Officer of ProFrac Corp., to the board of directors of ProFrac Corp. Additionally, Mr. Randle entered into a consulting agreement with ProFrac Corp., effective as of January 13, 2023, pursuant to which Mr. Randle agreed to provide general operational advice to ProFrac Corp. and its direct and indirect operating subsidiaries for an annual fee of $
107
ProFrac Holding Corp.
NOTES TO THE CONSOLIDATED FINANCIAL STATEMENTS
(Amounts in millions, except per share amounts, or where otherwise noted)
17. SELECTED QUARTERLY DATA (UNAUDITED)
The table below presents our quarterly results for the year ended December 31, 2022. The financial information for each of the first three quarters in 2022 has been revised to correct an immaterial error. The net effect of this correction on operating income (loss) was a decrease of $
|
|
Year Ended December 31, 2022 |
|
|||||||||||||
|
|
First Quarter |
|
|
Second Quarter |
|
|
Third Quarter |
|
|
Fourth Quarter |
|
||||
Selected Financial Data: |
|
|
|
|
|
|
|
|
|
|
|
|
||||
Revenues |
|
$ |
|
|
$ |
|
|
$ |
|
|
$ |
|
||||
Operating costs and expenses: |
|
|
|
|
|
|
|
|
|
|
|
|
||||
Cost of revenues, exclusive of depreciation, depletion and amortization |
|
|
|
|
|
|
|
|
|
|
|
|
||||
Selling, general, and administrative |
|
|
|
|
|
|
|
|
|
|
|
|
||||
Depreciation, depletion and amortization |
|
|
|
|
|
|
|
|
|
|
|
|
||||
Acquisition related expenses |
|
|
|
|
|
|
|
|
|
|
|
|
||||
Other operating (income) expenses, net |
|
|
( |
) |
|
|
|
|
|
|
|
|
|
|||
Total operating costs and expenses |
|
|
|
|
|
|
|
|
|
|
|
|
||||
Operating income (loss) |
|
|
|
|
|
|
|
|
|
|
|
|
||||
Other (expense) income: |
|
|
|
|
|
|
|
|
|
|
|
|
||||
Interest expense, net |
|
|
( |
) |
|
|
( |
) |
|
|
( |
) |
|
|
( |
) |
Loss on extinguishment of debt |
|
|
( |
) |
|
|
( |
) |
|
|
( |
) |
|
|
( |
) |
Other (expense) income, net |
|
|
|
|
|
|
|
|
( |
) |
|
|
|
|||
Income (loss) before income taxes |
|
|
|
|
|
|
|
|
|
|
|
|
||||
Income tax (expense) benefit |
|
|
( |
) |
|
|
( |
) |
|
|
( |
) |
|
|
|
|
Net income (loss) |
|
|
|
|
|
|
|
|
|
|
|
|
||||
Less: net (income) loss attributable to ProFrac Predecessor |
|
|
( |
) |
|
|
( |
) |
|
|
- |
|
|
|
- |
|
Less: net loss attributable to noncontrolling interests |
|
|
( |
) |
|
|
|
|
|
|
|
|
|
|||
Less: net income attributable to redeemable noncontrolling interests |
|
|
- |
|
|
|
( |
) |
|
|
( |
) |
|
|
( |
) |
Net income attributable to ProFrac Holding Corp. |
|
$ |
- |
|
|
$ |
|
|
$ |
|
|
$ |
|
|||
Earnings per Class A common share: |
|
|
|
|
|
|
|
|
|
|
|
|
||||
Basic and diluted |
|
$ |
- |
|
|
$ |
|
|
$ |
|
|
$ |
|
|||
Weighted average Class A common shares outstanding: |
|
|
|
|
|
|
|
|
|
|
|
|
||||
Basic |
|
|
|
|
|
|
|
|
|
|
|
|
||||
Diluted |
|
|
|
|
|
|
|
|
|
|
|
|
||||
18. SUBSEQUENT EVENTS
Acquisition of Producers Services Holdings LLC
On
The accounting for this acquisition is in process.
108
ProFrac Holding Corp.
NOTES TO THE CONSOLIDATED FINANCIAL STATEMENTS
(Amounts in millions, except per share amounts, or where otherwise noted)
Debt Financings
On December 30, 2022, the 2022 Term Loan Credit Facility was amended to provide the option to request borrowings of delayed draw term loans, in an aggregate principal amount not to exceed $
In January and February 2023, we repaid all amounts outstanding under the 2022 ABL Credit Facility with the proceeds from the additional borrowings under the 2022 Term Loan Credit Facility discussed above. On February 23, 2023, the 2022 ABL Credit Facility was amended to, among other things, provide for more flexibility in debt financing, increase the maximum availability to $
Acquisition of Performance Proppants
On
The accounting for this acquisition is in process.
109
Item 9. Changes in and Disagreements With Accountants on Accounting and Financial Disclosure.
None.
Item 9A. Controls and Procedures
Evaluation of Disclosure Controls and Procedures
We maintain a system of disclosure controls and procedures (as defined in Exchange Act Rules 13a-15(e) and 15d-15(e)) designed to ensure that the information required to be disclosed by us in the reports that we file or submit under the Exchange Act is recorded, processed, summarized and reported within the time periods specified in the rules and forms of the SEC, and is accumulated and communicated to our management, including our Executive Chairman (our principal executive officer) and Chief Financial Officer (our principal financial officer), as appropriate, to allow timely decisions regarding required disclosure. In designing and evaluating the disclosure controls and procedures, management recognized that any controls and procedures, no matter how well designed and operated, can provide only reasonable assurance of achieving the desired control objectives, as ours are designed to do, and management necessarily was required to apply its judgment in evaluating the cost-benefit relationship of possible controls and procedures.
This Annual Report on Form 10-K does not include a report of management’s assessment regarding internal control over financial reporting or an attestation report of our independent registered public accounting firm due to a transition period established by rules of the SEC for newly public companies.
Limitations on Controls and Procedures
In designing and evaluating our disclosure controls and procedures, management recognizes that disclosure controls and procedures, no matter how well conceived and operated, can provide only reasonable, not absolute, assurance that the objectives of the disclosure controls and procedures are met. Additionally, in designing disclosure controls and procedures, our management necessarily was required to apply its judgment in evaluating the cost-benefit relationship of possible disclosure controls and procedures. The design of any system of controls also is based in part upon certain assumptions about the likelihood of future events, and there can be no assurance that any design will succeed in achieving its stated goals under all potential future conditions; over time, controls may become inadequate because of changes in conditions, or the degree of compliance with policies or procedures may deteriorate. Because of the inherent limitations in a control system, misstatements due to error or fraud may occur and not be detected.
Management’s Annual Report on Internal Control over Financial Reporting
This Annual Report on Form 10-K does not include a report of management's assessment regarding internal control over financial reporting or an attestation report of the company’s registered public accounting firm due to a transition period established by rules of the Securities and Exchange Commission for newly public companies.
Changes in Internal Control over Financial Reporting
There were no changes in our internal control over financial reporting during the fourth quarter of 2022, which were identified in connection with management’s evaluation required by paragraph (d) of Rules 13a-15 and 15d-15 under the Exchange Act, that have materially affected, or are reasonably likely to materially affect, our internal control over financial reporting.
Our independent registered public accounting firm is not required to formally attest to the effectiveness of our internal control over financial reporting until we become an accelerated filer or a large accelerated filer as defined in Rule 12b-2 of the Exchange Act. At such time, our independent registered public accounting firm may issue a report that is adverse in the event it is not satisfied with the level at which our internal control over financial reporting is documented, designed, or operating. Any failure to maintain effective disclosure controls and internal control over financial reporting could adversely affect our business and operating results and could cause a decline in the price of our securities.
Item 9B. Other Information.
Potential Redemption by Related Parties
Since the time of the Company’s IPO, pursuant to the Third Amended and Restated Limited Liability Company Agreement of ProFrac LLC (the “LLC Agreement”) and the Second A&R Charter, certain members of ProFrac LLC have had the right to cause ProFrac LLC to redeem (the “Redemption Right”) all or a portion of each such member’s Units (together with the surrender of the same number of each such member’s shares of Class B Common Stock) for an equivalent number of shares of Class A Common Stock or, at the election of the Company’s audit committee, cash as provided in the LLC Agreement.
110
The Company has had discussions with Unit holders, including the Wilks Parties, regarding the possibility that they may exercise their Redemption Rights. In light of the Company’s current and forecasted liquidity resources and needs, among other factors, the Company, acting through its audit committee, decided that it would not elect in the near term to pay cash in the event of any actual redemption. Accordingly, in the near term, the Company plans to settle any actual redemption in equity, by issuing shares of Class A Common Stock to any Unit holder who exercises the Redemption Right on the basis of one share of Class A Common Stock for each Unit redeemed. We can make no assurance that anyone will or will not exercise such Redemption Rights or, if they do, when such rights may be exercised or how many Units might be subject to the potential redemption.
Once the Company settles any redemption in shares of Class A Common Stock, the trading price of our Class A Common Stock may be subject to substantial additional market overhang depending on the number of shares issued. In addition, the Wilks Parties have registration rights they may exercise with respect to shares of Class A Common Stock they receive in connection with any redemption by them. For additional information, see “Risk Factors—The price of our Class A Common Stock may decline as a result of the large number of shares available for sale.”
Any redemption may have tax consequences for the Company, including, but not limited to, increasing our effective tax rate and giving rise to obligations under the Tax Receivable Agreement. For additional information, see “Risk Factors—ProFrac Holding Corp. is required to make payments under the Tax Receivable Agreement for certain tax benefits that it may claim, and the amounts of such payments could be significant” and see “Note 13. Commitments and Contingencies” in the notes to our consolidated financial statements.
For more detail on the redemption process, please see the LLC Agreement, which is filed as Exhibit 4.3 to this Annual Report.
Related Party Transactions
In the fourth quarter of 2022, we entered into two arrangements with related parties controlled by the Wilks Parties (the “Related Party Arrangements”), neither of which was reviewed or approved in advance by our audit committee in accordance with our policies and procedures that address related party transactions. The audit committee learned of the Related Party Arrangements during the ordinary course of its review of other, proposed related party transactions. Consequently, the audit committee caused the Related Party Arrangements to be renegotiated, to improve certain of their non-financial terms to the benefit of the Company. The audit committee also took other actions designed to improve our procedures regarding related party transactions, including instituting more robust processes for, and education to support, the timely identification of potential related party transactions.
One of the Related Party Arrangements was entered into by our subsidiary, Alpine, with Interstate Earthworks, LLC (“Earthworks”), pursuant to which Alpine engaged Earthworks to provide certain mining services to Alpine at our Lamesa Sand Mine, including mining, wet and dry loading, hauling, and furnishing certain equipment. We and Earthworks have since negotiated a new agreement for these services made effective retroactive to December 1, 2022. The new Earthworks agreement was reviewed, approved and ratified by our audit committee in accordance with our policies and procedures that address related party transactions taking into account, among other factors, an analysis of third-party mine contract invoices, pricing and scoping at other mines for services similar to those to be provided under the new Earthworks agreement.
The other Related Party Arrangement was entered into by our subsidiary, ProFrac II LLC, with Wilks Ranch Texas, LTD (“Wilks Ranch”), pursuant to which ProFrac II LLC leased an office facility from Wilks Ranch that we use for training purposes. We and Wilks Ranch have since negotiated a new lease agreement for this facility made effective retroactive to November 1, 2022. The new agreement was reviewed, approved and ratified by our audit committee in accordance with our policies and procedures that address related party transactions taking into account, among other factors, an analysis of third-party comparison information for office leases.
In the aggregate, we have incurred approximately $1.2 million in fees under the Related Party Arrangements to date.
Item 9C. Disclosure Regarding Foreign Jurisdictions that Prevent Inspections.
Not applicable.
111
PART III
Item 10. Directors, Executive Officers and Corporate Governance.
The information required by this Item is incorporated by reference to our Proxy Statement for the 2023 Annual Meeting of Stockholders, which is expected to be filed with the SEC within 120 days of December 31, 2022 (the “2023 Proxy Statement”).
Item 11. Executive Compensation.
The information required by this Item is incorporated by reference to our 2023 Proxy Statement, which is expected to be filed with the SEC within 120 days of December 31, 2022.
Item 12. Security Ownership of Certain Beneficial Owners and Management and Related Stockholder Matters.
The information required by this Item is incorporated by reference to our 2023 Proxy Statement, which is expected to be filed with the SEC within 120 days of December 31, 2022.
Item 13. Certain Relationships and Related Transactions, and Director Independence.
The information required by this Item is incorporated by reference to our 2023 Proxy Statement, which is expected to be filed with the SEC within 120 days of December 31, 2022.
Item 14. Principal Accountant Fees and Services.
The information required by this Item is incorporated by reference to our 2023 Proxy Statement, which is expected to be filed with the SEC within 120 days of December 31, 2022.
112
PART IV
Item 15. Exhibit and Financial Statement Schedules.
(a) The following documents are filed as part of this Annual Report on Form 10-K:
Reference is made to Part II, Item 8 of this Annual Report on Form 10-K.
The financial statement schedules have been omitted because they are either not required, not applicable or the information required to be presented is included in the Company’s consolidated financial statements and notes thereto.
Exhibit No. |
|
Description |
2.1 |
|
|
2.2 |
|
|
2.3† |
|
|
2.4 |
|
|
3.1 |
|
|
3.2 |
|
|
4.1 |
|
|
4.2 |
|
|
4.3 |
|
|
4.4 |
|
|
4.5 |
|
|
4.6 |
|
|
4.7 |
|
113
4.8 |
|
|
4.9 |
|
|
4.10 |
|
|
4.11 |
|
|
4.12* |
|
|
10.1 |
|
|
10.2 |
|
|
10.3 |
|
|
10.4 |
|
|
10.5 |
|
|
10.6 |
|
|
10.7 |
|
|
10.8 |
|
|
10.9 |
|
|
10.10 |
|
|
10.11 |
|
|
10.12 |
|
|
10.13# |
|
|
10.14 |
|
|
10.15 |
|
|
10.16^ |
|
|
10.17^ |
|
114
10.18 |
|
|
10.19 |
|
|
10.20 |
|
|
10.21 |
|
|
10.22 |
|
|
10.23 |
|
|
10.24 |
|
|
10.25 |
|
|
10.26 |
|
|
10.27 |
|
|
10.28 |
|
|
10.29# |
|
|
10.30# |
|
|
10.31#* |
|
|
10.32#* |
|
|
10.33#* |
|
|
10.34# |
|
115
10.35# |
|
|
10.36# |
|
|
10.37 |
|
|
10.38 |
|
|
10.39 |
|
|
10.40 |
|
|
10.41 |
|
|
10.42 |
|
|
10.43 |
|
|
10.44 |
|
|
10.45 |
|
|
10.46 |
|
|
10.47 |
|
|
10.48 |
|
|
10.49† |
|
116
10.50 |
|
|
10.51 |
|
|
10.52* |
|
|
10.53*^ |
|
|
10.54* |
|
|
21.1* |
|
|
23.1* |
|
|
23.2* |
|
|
31.1* |
|
|
31.2* |
|
|
32.1** |
|
|
95* |
|
|
101.INS* |
|
Inline XBRL Instance Document – The instance document does not appear in the interactive date file because its XBRL tags are embedded within the inline XBRL document. |
101.SCH* |
|
Inline XBRL Taxonomy Extension Schema Document. |
101.CAL* |
|
Inline XBRL Taxonomy Extension Calculation Linkbase Document. |
101.DEF* |
|
Inline XBRL Taxonomy Extension Definition Linkbase Document. |
101.LAB* |
|
Inline XBRL Taxonomy Extension Label Linkbase Document. |
101.PRE* |
|
Inline XBRL Taxonomy Extension Presentation Linkbase Document. |
104.0* |
|
Cover Page Interactive Date File (formatted as inline XBRL and contained in Exhibit 101). |
____________________________
* Filed herewith.
** Furnished herewith.
# Compensatory plan or arrangement.
† The schedules have been omitted pursuant to Item 601(a)(5) of Regulation S-K. The Company agrees to furnish supplementally a copy of such schedules, or any section thereof, to the SEC upon request.
^ Certain portions of this exhibit have been redacted pursuant to Item 601(b)(10)(iv) of Regulation S-K. The registrant agrees to furnish supplementally an unredacted copy of the exhibit to the Securities and Exchange Commission upon its request.
Item 16. Form 10-K Summary
None.
117
SIGNATURES
Pursuant to the requirements of Section 13 or 15(d) of the Securities Exchange Act of 1934, the registrant has duly caused this report to be signed on its behalf by the undersigned, thereunto duly authorized.
|
PROFRAC HOLDING CORP. |
|
|
|
|
|
By: |
/s/ Matthew D. Wilks |
|
|
Name: Matthew D. Wilks |
|
|
Title: Executive Chairman and Director (Principal Executive Officer) |
Pursuant to the requirements of the Securities Exchange Act of 1934, this Annual Report on Form 10-K has been signed below by the following persons on behalf of the registrant and in the capacities and on the dates indicated.
|
|
|
|
|
|
|
|
Signature |
|
Title |
Date |
|
|
|
|
/s/ Matthew D. Wilks Matthew D. Wilks |
|
Executive Chairman and Director (Principal Executive Officer) |
March 30, 2023 |
|
|
|
|
/s/Lance Turner Lance Turner
|
|
Chief Financial Officer (Principal Financial Officer and Principal Accounting Officer) |
March 30, 2023 |
|
|
|
|
/s/ Ladd Wilks Ladd Wilks
|
|
Chief Executive Officer |
March 30, 2023 |
|
|
|
|
/s/Sergei Krylov |
|
Director |
March 30, 2023 |
Sergei Krylov |
|
||
|
|
|
|
/s/Terry Glebocki |
|
Director |
March 30, 2023 |
Terry Glebocki |
|
||
|
|
|
|
/s/Stacy Nieuwoudt |
|
Director |
March 30, 2023 |
Stacy Nieuwoudt |
|
||
|
|
|
|
/s/Gerald Haddock |
|
Director |
March 30, 2023 |
Gerald Haddock |
|
||
|
|
|
|
/s/Coy Randle Coy Randle |
|
Director |
March 30, 2023 |
|
|
||
118