0001881487falseFYNasdaqhttp://fasb.org/us-gaap/2025#UsefulLifeTermOfLeaseMember11http://fasb.org/us-gaap/2025#ImpairmentOfLongLivedAssetsHeldForUseAugust 31, 2027October 31, 2027http://fasb.org/us-gaap/2025#PropertyPlantAndEquipmentNethttp://fasb.org/us-gaap/2025#PropertyPlantAndEquipmentNethttp://fasb.org/us-gaap/2025#LongTermDebtCurrenthttp://fasb.org/us-gaap/2025#LongTermDebtCurrenthttp://fasb.org/us-gaap/2025#LongTermDebthttp://fasb.org/us-gaap/2025#LongTermDebtone yearone year000http://profrac.com/20251231#ExecutiveChairmanMember0001881487us-gaap:RelatedPartyMemberacdc:WilksBrothersLLCMember2025-01-012025-12-310001881487us-gaap:RelatedPartyMember2024-01-012024-12-310001881487srt:ParentCompanyMemberus-gaap:CommonClassBMember2025-12-310001881487acdc:AlpineTwoThousandAndTwentyThreeTermLoanMember2025-12-302025-12-300001881487acdc:TwoThousandAndTwentyNineSeniorNotesMembersrt:MinimumMember2025-01-012025-01-010001881487us-gaap:AdditionalPaidInCapitalMember2024-12-310001881487us-gaap:RelatedPartyMemberacdc:EquifyFinancialLLCMember2023-01-012023-12-310001881487us-gaap:TechnologyBasedIntangibleAssetsMember2025-12-310001881487acdc:ExternalCustomersMemberus-gaap:OperatingSegmentsMemberacdc:StimulationServicesSegmentMemberus-gaap:ServiceMember2023-01-012023-12-310001881487acdc:ManufacturingSegmentMemberus-gaap:OperatingSegmentsMember2025-12-310001881487srt:ChiefOperatingOfficerMember2023-01-132023-01-1300018814872024-01-012024-12-310001881487us-gaap:RelatedPartyMemberacdc:EquifyFinancialLLCMember2024-01-012024-12-310001881487acdc:OfficeEquipmentSoftwareAndOtherMembersrt:MaximumMember2025-12-310001881487acdc:StimulationServicesSegmentMember2025-12-310001881487us-gaap:RelatedPartyMemberacdc:LogistixIQMember2025-12-310001881487acdc:OtherLongTermDebtMemberacdc:OtherSubsidiariesMember2025-12-310001881487acdc:PerformanceProppantsLlcMember2023-01-012023-12-310001881487acdc:AlpineTwoThousandAndTwentyThreeTermLoanMemberacdc:AlpineSubsidiaryMember2025-12-310001881487acdc:AlpineSubsidiaryMember2025-12-310001881487acdc:TwoThousandAndTwentyNineSeniorNotesMemberus-gaap:SubsequentEventMember2026-01-310001881487us-gaap:CustomerRelationshipsMembersrt:MaximumMember2025-12-310001881487us-gaap:SeriesAPreferredStockMember2025-12-310001881487acdc:PatentsAndLicenseMember2025-12-310001881487us-gaap:OperatingSegmentsMemberacdc:IntercompanyMemberacdc:StimulationServicesSegmentMember2025-01-012025-12-310001881487us-gaap:CommonClassAMemberus-gaap:RestrictedStockUnitsRSUMember2023-01-012023-12-310001881487srt:ParentCompanyMemberacdc:OtherLongTermDebtMember2025-12-310001881487acdc:BasinProductionAndCompletionLLCMember2022-02-092022-02-0900018814872022-01-012022-12-310001881487acdc:TwoThousandAndTwentyNineSeniorNotesMember2023-12-310001881487acdc:AdvancedStimulationTechnologiesIncMember2024-06-300001881487acdc:TwoThousandTwentyTwoABLCreditFacilityMemberus-gaap:SubsequentEventMemberus-gaap:SecuredOvernightFinancingRateSofrMember2026-03-030001881487stpr:TX2025-01-012025-12-310001881487acdc:FlotekPWRtekNoteMember2025-04-012025-04-300001881487srt:ParentCompanyMember2025-12-310001881487us-gaap:RelatedPartyMemberacdc:WilksEarthworksMember2023-01-012023-12-310001881487us-gaap:TechnologyBasedIntangibleAssetsMember2024-12-310001881487us-gaap:OperatingSegmentsMemberacdc:IntercompanyMemberacdc:StimulationServicesSegmentMember2024-01-012024-12-310001881487srt:MinimumMemberacdc:OfficeEquipmentSoftwareAndOtherMember2025-12-310001881487us-gaap:RetainedEarningsMember2023-12-310001881487acdc:TwoThousandAndTwentyNineSeniorNotesMemberus-gaap:SubsequentEventMember2026-01-142026-01-140001881487acdc:PriorBusinessCombinationsMember2024-12-310001881487acdc:TwoThousandTwentyTwoABLCreditFacilityMember2022-03-310001881487us-gaap:ServiceMember2025-01-012025-12-310001881487acdc:TimeBasedVestingRestrictedStockUnitsMembersrt:MinimumMemberacdc:TwentyTwentyTwoLongTermIncentivePlanMember2025-01-012025-12-310001881487us-gaap:OperatingSegmentsMemberacdc:ProppantProductionSegmentMember2025-12-310001881487acdc:FlotekIndustriesIncMemberacdc:StimulationServicesSegmentMember2025-04-012025-04-300001881487acdc:TwoThousandAndTwentyNineSeniorNotesMemberacdc:BealBankUSAAndWilksBrothersLLCMember2025-12-310001881487us-gaap:OperatingSegmentsMemberacdc:ProppantProductionSegmentMember2023-01-012023-12-310001881487us-gaap:AdditionalPaidInCapitalMember2024-01-012024-12-310001881487us-gaap:RelatedPartyMemberacdc:MCEstatesLLCAndShopsAtWillowParkLLCMember2025-12-310001881487acdc:AlpineTwoThousandAndTwentyThreeTermLoanMembersrt:MinimumMember2024-06-302024-06-300001881487srt:ParentCompanyMemberacdc:EquifyNotesMember2025-12-310001881487acdc:EquifyNoteTwoMember2022-11-012022-11-010001881487us-gaap:CommonStockMemberus-gaap:CommonClassBMember2022-12-310001881487us-gaap:CommonClassAMember2023-01-012023-12-310001881487srt:ParentCompanyMemberus-gaap:CommonClassAMember2024-12-310001881487acdc:A1B1PreferredUnitsMemberacdc:BasinProductionAndCompletionLLCMember2022-02-092022-02-090001881487us-gaap:SeriesAPreferredStockMember2025-01-012025-12-310001881487srt:ParentCompanyMember2023-12-310001881487us-gaap:SubsequentEventMemberus-gaap:SecuredOvernightFinancingRateSofrMember2026-03-032026-03-030001881487acdc:EKUPowerDrivesMember2025-12-3100018814872025-01-012025-12-310001881487us-gaap:CommonClassAMember2024-01-012024-12-310001881487acdc:SandMineMember2025-12-310001881487acdc:SandMineMember2025-10-012025-12-310001881487acdc:TwoThousandAndTwentyNineSeniorNotesMembersrt:MaximumMember2025-01-012025-12-310001881487us-gaap:CustomerRelationshipsMembersrt:MaximumMember2024-12-310001881487us-gaap:MachineryAndEquipmentMember2025-12-310001881487acdc:AlpineTwoThousandAndTwentyThreeTermLoanMembersrt:ScenarioForecastMember2026-12-282027-12-270001881487acdc:BasinProductionAndCompletionLLCMemberacdc:SellingHoldersOfB1PreferredUnitsMember2022-02-092022-02-090001881487us-gaap:OperatingSegmentsMemberacdc:FlotekSegmentMember2025-01-012025-12-310001881487us-gaap:RelatedPartyMemberacdc:WilksBrothersLLCMember2024-12-310001881487us-gaap:OperatingSegmentsMemberacdc:StimulationServicesSegmentMember2025-12-310001881487acdc:AlpineTwoThousandAndTwentyThreeTermLoanMembersrt:MinimumMember2025-01-012025-01-010001881487acdc:PerformanceProppantsLlcMemberus-gaap:AdditionalPaidInCapitalMember2023-01-012023-12-310001881487srt:ConsolidationEliminationsMember2023-01-012023-12-310001881487acdc:ExternalCustomersMemberus-gaap:OperatingSegmentsMemberacdc:StimulationServicesSegmentMemberus-gaap:ServiceMember2024-01-012024-12-310001881487us-gaap:ProductMember2025-01-012025-12-310001881487acdc:ProFracLLCMember2025-12-310001881487us-gaap:OperatingSegmentsMember2024-12-310001881487srt:ParentCompanyMemberacdc:OtherLongTermDebtMember2024-12-310001881487us-gaap:RetainedEarningsMember2025-12-310001881487us-gaap:StateAndLocalJurisdictionMember2025-12-310001881487acdc:ExternalCustomersMemberus-gaap:OperatingSegmentsMemberacdc:ProppantProductionSegmentMemberus-gaap:ProductMember2024-01-012024-12-310001881487us-gaap:NoncontrollingInterestMember2022-12-310001881487srt:MinimumMemberacdc:TwoThousandTwentyTwoABLCreditFacilityMember2022-03-310001881487acdc:ProppantProductionSegmentMember2025-12-310001881487acdc:WestMungerMember2021-11-300001881487us-gaap:RelatedPartyMember2024-12-310001881487us-gaap:CommonClassAMember2025-01-012025-12-310001881487acdc:TwoThousandAndTwentyNineSeniorNotesMember2025-01-012025-12-310001881487acdc:FlyingAPumpServicesLLCMember2024-01-012024-12-310001881487us-gaap:AdditionalPaidInCapitalMember2025-12-310001881487acdc:ExternalCustomersMemberus-gaap:OperatingSegmentsMemberus-gaap:ServiceMember2025-01-012025-12-310001881487acdc:OtherLongTermDebtMemberacdc:AlpineSubsidiaryMember2025-12-310001881487acdc:SeriesARedeemableConvertiblePreferredStockMember2024-12-310001881487acdc:TwoThousandAndTwentyNineSeniorNotesMembersrt:ParentCompanyMember2024-12-310001881487acdc:PerformanceBasedVestingRsuMember2024-01-012024-12-310001881487us-gaap:MachineryAndEquipmentMembersrt:MinimumMember2025-12-310001881487acdc:WestMungerMemberus-gaap:IPOMember2022-05-172022-05-170001881487us-gaap:RelatedPartyMemberacdc:WilksConstructionCompanyLLCMember2025-12-310001881487acdc:WilksBrothersLLCMember2025-01-012025-12-310001881487srt:MinimumMemberacdc:TwoThousandTwentyTwoABLCreditFacilityMemberacdc:SecuredOvernightFinancingRateMember2022-03-310001881487acdc:PerformanceBasedVestingRsuMembersrt:MinimumMemberacdc:TwentyTwentyTwoLongTermIncentivePlanMember2025-01-012025-12-310001881487acdc:AlpineTwoThousandAndTwentyThreeTermLoanMembersrt:MinimumMember2025-01-012025-12-310001881487acdc:TwoThousandAndTwentyNineSeniorNotesMembersrt:MinimumMember2025-01-012025-12-310001881487us-gaap:RelatedPartyMemberacdc:MCEstatesLLCAndShopsAtWillowParkLLCMember2024-12-310001881487us-gaap:CommonClassAMemberacdc:ContingentlyIssuableSharesMember2025-01-012025-12-310001881487us-gaap:CommonClassAMemberacdc:TwentyTwentyTwoLongTermIncentivePlanMember2025-12-310001881487us-gaap:ForeignCountryMember2025-12-310001881487acdc:FlotekSubsidiaryMemberacdc:FlotekABLCreditFacilityMember2024-12-310001881487us-gaap:CommonStockMemberus-gaap:CommonClassAMember2023-12-310001881487us-gaap:RelatedPartyMemberacdc:LogistixIQMember2025-01-012025-12-310001881487srt:ParentCompanyMemberacdc:EquifyNoteMember2025-12-310001881487us-gaap:CommonStockMemberus-gaap:CommonClassAMember2025-01-012025-12-310001881487acdc:BasinProductionAndCompletionLLCMember2023-12-310001881487srt:ParentCompanyMemberacdc:TwoThousandTwentyTwoABLCreditFacilityMember2024-12-310001881487acdc:AdvancedStimulationTechnologiesIncMember2024-06-012024-06-300001881487us-gaap:SellingGeneralAndAdministrativeExpensesMember2023-01-012023-12-310001881487us-gaap:NoncontrollingInterestMember2024-12-310001881487us-gaap:BaseRateMemberacdc:TwoThousandAndTwentyNineSeniorNotesMember2025-01-012025-12-310001881487acdc:FinanceLeaseObligationsMembersrt:ParentCompanyMember2024-12-310001881487acdc:ExternalCustomersMemberus-gaap:OperatingSegmentsMemberus-gaap:ServiceMemberus-gaap:AllOtherSegmentsMember2025-01-012025-12-310001881487us-gaap:RelatedPartyMemberacdc:LogistixIQMember2024-12-310001881487us-gaap:OperatingSegmentsMemberacdc:ProppantProductionSegmentMember2024-01-012024-12-310001881487us-gaap:MachineryAndEquipmentMember2024-12-310001881487us-gaap:OperatingSegmentsMemberacdc:IntercompanyMemberacdc:FlotekSegmentMember2025-01-012025-12-310001881487acdc:TimeBasedVestingRestrictedStockUnitsMember2025-12-310001881487acdc:TimeBasedVestingRestrictedStockUnitsMember2024-01-012024-12-310001881487srt:ParentCompanyMember2022-12-310001881487acdc:OtherLongTermDebtMemberacdc:AlpineSubsidiaryMember2024-12-310001881487acdc:FinanceLeaseObligationsMemberacdc:FlotekSubsidiaryMember2025-12-310001881487us-gaap:RelatedPartyMemberacdc:LogistixIQMember2023-01-012023-12-310001881487us-gaap:RelatedPartyMemberacdc:InterstateMember2025-12-310001881487acdc:AlpineTwoThousandAndTwentyThreeTermLoanMemberacdc:AlpineSubsidiaryMember2024-12-310001881487acdc:ExternalCustomersMemberus-gaap:OperatingSegmentsMemberus-gaap:ProductMemberus-gaap:AllOtherSegmentsMember2024-01-012024-12-310001881487us-gaap:OperatingSegmentsMember2025-01-012025-12-310001881487acdc:TwoThousandAndTwentyNineSeniorNotesMember2025-12-310001881487us-gaap:BuildingAndBuildingImprovementsMember2025-12-310001881487acdc:OtherStatesMember2025-01-012025-12-310001881487us-gaap:RelatedPartyMemberacdc:WilksBrothersLLCMember2025-12-310001881487us-gaap:OperatingSegmentsMemberacdc:IntercompanyMemberus-gaap:AllOtherSegmentsMember2025-01-012025-12-310001881487us-gaap:OperatingSegmentsMemberacdc:IntercompanyMemberacdc:FlotekSegmentMember2023-01-012023-12-310001881487acdc:AlpineTwoThousandAndTwentyThreeTermLoanMembersrt:ScenarioForecastMember2026-03-312026-03-310001881487us-gaap:BuildingAndBuildingImprovementsMember2024-12-310001881487acdc:FlotekMember2025-01-012025-12-310001881487acdc:PerformanceBasedVestingRsuMember2023-01-012023-12-310001881487acdc:TimeBasedVestingRestrictedStockUnitsMember2025-01-012025-12-310001881487acdc:ProducersServiceHoldingsLlcMember2023-01-132023-01-1300018814872025-08-012025-08-310001881487acdc:TimeBasedVestingRestrictedStockUnitsMember2024-12-310001881487acdc:AlpineTwoThousandAndTwentyThreeTermLoanMember2025-09-292025-09-290001881487acdc:AdvancedStimulationTechnologiesIncMember2024-01-012024-06-300001881487acdc:TwoThousandTwentyTwoABLCreditFacilityMembersrt:MaximumMemberacdc:SecuredOvernightFinancingRateMember2022-03-310001881487acdc:THRCHoldingsMember2023-09-012023-09-300001881487us-gaap:RelatedPartyMemberacdc:WilksConstructionCompanyLLCMember2025-01-012025-12-310001881487us-gaap:OperatingSegmentsMemberacdc:IntercompanyMemberacdc:FlotekSegmentMember2024-01-012024-12-310001881487acdc:MiningPropertyAndMineDevelopmentMember2024-12-310001881487us-gaap:LandMember2024-12-310001881487us-gaap:TechnologyBasedIntangibleAssetsMembersrt:MinimumMember2024-12-310001881487us-gaap:AccumulatedOtherComprehensiveIncomeMember2023-01-012023-12-310001881487srt:ConsolidationEliminationsMember2025-12-310001881487us-gaap:RelatedPartyMemberacdc:WilksEarthworksMember2024-01-012024-12-310001881487us-gaap:RelatedPartyMemberacdc:MCEstatesLLCAndShopsAtWillowParkLLCMember2023-01-012023-12-310001881487us-gaap:AccumulatedOtherComprehensiveIncomeMember2025-01-012025-12-310001881487acdc:FlotekIndustriesIncMember2024-01-012024-12-310001881487acdc:MonteCarloSimulationMethodMember2025-01-012025-12-310001881487acdc:ChiefExecutiveOfficerAndChairmanMemberacdc:ProFracLLCMemberus-gaap:CommonClassBMember2025-12-310001881487acdc:TimeBasedVestingRestrictedStockUnitsMember2023-01-012023-12-310001881487acdc:FinanceLeaseObligationsMemberacdc:AlpineSubsidiaryMember2025-12-3100018814872023-01-012023-12-310001881487acdc:TwoThousandAndTwentyNineSeniorNotesMembersrt:MinimumMember2025-12-312025-12-310001881487us-gaap:CommonClassAMemberus-gaap:PerformanceSharesMember2023-01-012023-12-310001881487acdc:TwoThousandAndTwentyNineSeniorNotesMembersrt:MinimumMember2025-03-312025-03-310001881487acdc:TwoThousandTwentyTwoABLCreditFacilityMembersrt:MaximumMember2022-03-310001881487acdc:FlotekSubsidiaryMember2025-12-310001881487acdc:TwoThousandAndTwentyNineSeniorNotesMember2025-12-012025-12-310001881487stpr:PA2025-01-012025-12-310001881487us-gaap:CommonClassAMember2024-12-310001881487us-gaap:DomesticCountryMember2025-01-012025-12-310001881487us-gaap:OperatingSegmentsMemberacdc:StimulationServicesSegmentMember2024-01-012024-12-310001881487us-gaap:OperatingSegmentsMemberacdc:FlotekSegmentMember2024-01-012024-12-3100018814872026-03-030001881487srt:ParentCompanyMemberus-gaap:CommonClassAMember2025-12-310001881487acdc:AlpineTwoThousandAndTwentyThreeTermLoanMemberacdc:SecuredOvernightFinancingRateMember2025-12-310001881487acdc:RedeemableNoncontrollingInterestsMember2023-01-012023-12-3100018814872025-12-310001881487acdc:BasinProductionAndCompletionLLCMember2024-06-012024-06-300001881487us-gaap:OperatingSegmentsMemberacdc:FlotekSegmentMember2024-12-3100018814872023-04-012023-04-300001881487acdc:FlotekPWRtekNoteMember2025-04-300001881487acdc:ProppantProductionSegmentMember2023-01-012023-12-310001881487acdc:ProducersServiceHoldingsLlcMemberus-gaap:AdditionalPaidInCapitalMember2023-01-012023-12-310001881487us-gaap:AccumulatedOtherComprehensiveIncomeMember2023-12-310001881487acdc:TwoThousandAndTwentyNineSeniorNotesMembersrt:MinimumMember2025-06-302025-06-300001881487us-gaap:RelatedPartyMemberacdc:WilksBrothersLLCMember2023-01-012023-12-310001881487acdc:PerformanceBasedVestingRsuMember2025-12-310001881487us-gaap:OperatingSegmentsMember2023-01-012023-12-310001881487acdc:ManufacturingSegmentMember2024-12-310001881487acdc:TwoThousandAndTwentyNineSeniorNotesMembersrt:ScenarioForecastMember2027-01-142027-01-140001881487acdc:LimitationUnderSectionThreeEightTwoMemberus-gaap:StateAndLocalJurisdictionMember2025-12-3100018814872025-06-300001881487acdc:ManufacturingSegmentMemberus-gaap:OperatingSegmentsMemberacdc:IntercompanyMember2024-01-012024-12-310001881487us-gaap:NoncontrollingInterestMember2023-12-310001881487us-gaap:OperatingSegmentsMemberacdc:ProppantProductionSegmentMember2025-01-012025-12-310001881487us-gaap:CommonClassAMemberacdc:WestMungerMemberus-gaap:IPOMember2021-11-012021-11-300001881487us-gaap:OperatingSegmentsMemberacdc:IntercompanyMemberacdc:ProppantProductionSegmentMember2025-01-012025-12-310001881487acdc:StimulationServicesSegmentMember2023-01-012023-12-310001881487us-gaap:AllOtherSegmentsMember2025-12-310001881487acdc:FlotekSubsidiaryMemberacdc:FlotekABLCreditFacilityMember2025-12-310001881487acdc:BasinProductionAndCompletionLLCMember2025-10-012025-12-310001881487us-gaap:RelatedPartyMemberacdc:WilksConstructionCompanyLLCMember2023-01-012023-12-310001881487srt:ConsolidationEliminationsMember2024-01-012024-12-310001881487acdc:OfficeEquipmentSoftwareAndOtherMember2025-12-310001881487us-gaap:CustomerRelationshipsMember2024-12-310001881487srt:MinimumMemberus-gaap:CustomerRelationshipsMember2024-12-310001881487acdc:EKUPowerDrivesMember2024-01-012024-12-310001881487acdc:TwoThousandAndTwentyNineSeniorNotesMembersrt:MinimumMember2025-09-302025-09-300001881487acdc:ManufacturingSegmentMemberus-gaap:OperatingSegmentsMemberacdc:IntercompanyMember2025-01-012025-12-310001881487acdc:FlotekPWRtekNoteMember2025-12-310001881487acdc:FlyingAPumpServicesLLCMember2023-01-012023-06-300001881487us-gaap:SeriesAPreferredStockMember2023-01-012023-09-300001881487us-gaap:CommonClassAMemberacdc:TwentyTwentyTwoLongTermIncentivePlanMember2022-05-310001881487us-gaap:OperatingSegmentsMember2025-12-310001881487acdc:ExternalCustomersMemberus-gaap:OperatingSegmentsMemberus-gaap:ProductMember2025-01-012025-12-310001881487srt:ConsolidationEliminationsMember2024-12-310001881487acdc:OtherSubsidiariesMember2025-12-310001881487acdc:ExternalCustomersMemberus-gaap:OperatingSegmentsMemberus-gaap:ServiceMemberacdc:StimulationServicesSegmentMember2025-01-012025-12-310001881487acdc:IntercompanyMembersrt:ConsolidationEliminationsMember2025-01-012025-12-310001881487acdc:WestMungerMember2021-11-012021-11-300001881487acdc:FinanceLeaseObligationsMemberacdc:OtherSubsidiariesMember2025-12-310001881487acdc:PerformanceBasedVestingRsuMembersrt:MinimumMember2025-12-310001881487acdc:PerformanceProppantsLlcMember2023-02-240001881487acdc:FlotekIndustriesIncMember2025-12-310001881487acdc:FlotekSubsidiaryMemberacdc:FlotekPWRtekMember2025-12-310001881487acdc:ProducersServiceHoldingsLlcMember2023-01-030001881487acdc:PerformanceBasedVestingRsuMembersrt:MaximumMember2025-12-310001881487acdc:ExternalCustomersMemberus-gaap:OperatingSegmentsMemberacdc:FlotekSegmentMemberus-gaap:ProductMember2024-01-012024-12-310001881487acdc:ProducersServiceHoldingsLlcMember2023-01-310001881487us-gaap:OperatingSegmentsMemberacdc:FlotekSegmentMember2023-01-012023-12-310001881487us-gaap:SeriesAPreferredStockMember2023-09-300001881487us-gaap:AllOtherSegmentsMember2025-01-012025-12-310001881487srt:ParentCompanyMemberacdc:EquifyNoteMember2024-12-310001881487acdc:TwoThousandAndTwentyNineSeniorNotesMember2024-12-310001881487acdc:HaynesvilleProppantMember2024-04-012024-06-300001881487acdc:BasinProductionAndCompletionLLCMember2022-02-090001881487acdc:ManufacturingSegmentMemberus-gaap:OperatingSegmentsMember2025-01-012025-12-310001881487us-gaap:CommonClassAMemberacdc:WilksPartiesMember2025-08-310001881487acdc:ProducersAndPerformanceProppantsMember2025-01-012025-12-310001881487us-gaap:LandMember2025-12-310001881487us-gaap:RelatedPartyMemberacdc:CarboCeramicsIncMember2023-01-012023-12-310001881487us-gaap:CommonStockMemberus-gaap:CommonClassAMember2023-01-012023-12-310001881487acdc:TwoThousandTwentyTwoABLCreditFacilityMemberus-gaap:SubsequentEventMemberus-gaap:SecuredOvernightFinancingRateSofrMember2026-03-032026-03-030001881487srt:MaximumMemberus-gaap:BuildingAndBuildingImprovementsMember2025-12-310001881487acdc:AlpineTwoThousandAndTwentyThreeTermLoanMember2025-06-292025-06-290001881487acdc:ManufacturingSegmentMemberus-gaap:OperatingSegmentsMember2024-12-310001881487us-gaap:ForeignCountryMembersrt:MaximumMember2025-01-012025-12-310001881487us-gaap:RelatedPartyMemberacdc:WilksEarthworksMember2024-12-310001881487us-gaap:CommonClassAMemberus-gaap:NoncontrollingInterestMember2025-01-012025-12-310001881487us-gaap:RevolvingCreditFacilityMemberacdc:OtherSubsidiariesMember2024-12-310001881487us-gaap:RelatedPartyMemberacdc:FlyingAPumpServicesLLCMember2025-01-012025-12-310001881487acdc:TwoThousandAndTwentyNineSeniorNotesMemberacdc:AdvancedStimulationTechnologiesIncMember2024-06-300001881487acdc:RedeemableNoncontrollingInterestsMember2022-12-310001881487us-gaap:BaseRateMemberacdc:TwoThousandTwentyTwoABLCreditFacilityMembersrt:MaximumMember2022-03-310001881487acdc:PerformanceProppantsLlcMemberus-gaap:IncomeApproachValuationTechniqueMember2023-02-240001881487acdc:ExternalCustomersMemberus-gaap:OperatingSegmentsMemberacdc:FlotekSegmentMemberus-gaap:ProductMember2023-01-012023-12-310001881487us-gaap:RelatedPartyMemberacdc:CarboCeramicsIncMember2024-01-012024-12-310001881487acdc:ProFracLLCMembersrt:ChiefExecutiveOfficerMemberacdc:BlackScholesMertonOptionPricingModelMember2025-01-012025-12-310001881487acdc:StimulationServicesSegmentMember2024-12-310001881487acdc:ManufacturingSegmentMember2025-12-310001881487us-gaap:TechnologyBasedIntangibleAssetsMembersrt:MaximumMember2025-12-310001881487acdc:WilksBrothersLLCMember2025-01-012025-12-310001881487acdc:OtherSubsidiariesMember2024-12-310001881487us-gaap:RelatedPartyMemberacdc:WilksEarthworksMember2025-01-012025-12-310001881487us-gaap:CommonClassAMemberus-gaap:PerformanceSharesMember2024-01-012024-12-310001881487us-gaap:InterestRateFloorMemberacdc:TwoThousandAndTwentyNineSeniorNotesMember2025-01-012025-12-310001881487srt:ParentCompanyMember2024-01-012024-12-310001881487us-gaap:CommonClassAMember2023-04-112023-04-110001881487us-gaap:OperatingSegmentsMemberacdc:ProppantProductionSegmentMember2024-12-310001881487acdc:ProppantProductionSegmentMember2025-01-012025-12-310001881487acdc:ThreeTwentyThreeLLCMemberus-gaap:RelatedPartyMember2023-01-012023-12-310001881487us-gaap:RevolvingCreditFacilityMemberacdc:OtherSubsidiariesMember2025-12-310001881487us-gaap:RelatedPartyMemberacdc:FlyingAPumpServicesLLCMember2025-12-310001881487acdc:TwoThousandTwentyTwoABLCreditFacilityMember2022-03-012022-03-310001881487srt:ParentCompanyMemberacdc:TwoThousandTwentyTwoABLCreditFacilityMember2025-12-310001881487acdc:ProFracLLCMember2023-01-012023-12-310001881487us-gaap:MachineryAndEquipmentMembersrt:MaximumMember2025-12-310001881487acdc:FinanceLeaseObligationsMembersrt:ParentCompanyMember2025-12-310001881487acdc:PriorBusinessCombinationsMember2025-12-310001881487us-gaap:SubsequentEventMembersrt:MaximumMemberus-gaap:SecuredOvernightFinancingRateSofrMember2026-03-032026-03-030001881487acdc:ExternalCustomersMembersrt:ConsolidationEliminationsMemberus-gaap:ServiceMember2025-01-012025-12-3100018814872023-09-300001881487srt:MinimumMemberacdc:TwoThousandTwentyTwoABLCreditFacilityMember2022-03-012022-03-310001881487srt:MinimumMemberus-gaap:StateAndLocalJurisdictionMember2025-01-012025-12-310001881487acdc:ManufacturingSegmentMemberus-gaap:OperatingSegmentsMemberacdc:IntercompanyMember2023-01-012023-12-310001881487acdc:SeriesARedeemableConvertiblePreferredStockMember2025-12-310001881487us-gaap:RelatedPartyMemberacdc:WilksBrothersLLCMember2024-01-012024-12-310001881487acdc:RedeemableNoncontrollingInterestsMember2023-12-310001881487acdc:ProducersServiceHoldingsLlcMember2023-01-032023-01-030001881487acdc:EquifyNoteTwoMember2025-12-310001881487us-gaap:CommonStockMemberus-gaap:CommonClassAMember2024-12-310001881487us-gaap:VariableInterestEntityPrimaryBeneficiaryMember2025-12-310001881487srt:ParentCompanyMemberus-gaap:CommonClassBMember2024-12-310001881487acdc:EquifyNoteOneMember2022-11-012022-11-010001881487acdc:EquifyNotesMember2022-11-0100018814872023-12-310001881487us-gaap:NoncontrollingInterestMember2025-12-310001881487acdc:TimeBasedVestingRestrictedStockUnitsMemberacdc:TwentyTwentyTwoLongTermIncentivePlanMembersrt:MaximumMember2025-01-012025-12-310001881487us-gaap:RelatedPartyMemberacdc:LogistixIQMember2024-01-012024-12-310001881487us-gaap:OperatingSegmentsMemberacdc:StimulationServicesSegmentMember2023-01-012023-12-310001881487acdc:StimulationServicesSegmentMember2024-01-012024-12-310001881487us-gaap:RelatedPartyMemberacdc:InterstateMember2024-12-310001881487acdc:OfficeEquipmentSoftwareAndOtherMember2024-12-310001881487us-gaap:RetainedEarningsMember2024-01-012024-12-310001881487acdc:ExternalCustomersMemberus-gaap:OperatingSegmentsMemberacdc:ProppantProductionSegmentMemberus-gaap:ProductMember2023-01-012023-12-310001881487acdc:AlpineTwoThousandAndTwentyThreeTermLoanMember2025-06-302025-06-300001881487acdc:FlyingAPumpServicesLLCMember2023-01-012023-12-310001881487us-gaap:RelatedPartyMemberacdc:MCEstatesLLCAndShopsAtWillowParkLLCMember2024-01-012024-12-310001881487acdc:IntercompanyMembersrt:ConsolidationEliminationsMember2023-01-012023-12-310001881487us-gaap:TechnologyBasedIntangibleAssetsMembersrt:MinimumMember2025-12-310001881487acdc:AlpineTwoThousandAndTwentyThreeTermLoanMembersrt:ScenarioForecastMember2025-12-272026-12-270001881487us-gaap:RelatedPartyMemberacdc:MCEstatesLLCAndShopsAtWillowParkLLCMember2025-01-012025-12-3100018814872025-10-012025-12-310001881487acdc:EKUPowerDrivesMember2023-01-012023-12-310001881487acdc:FlotekMember2023-01-012023-12-310001881487acdc:FlotekIndustriesIncMember2023-01-012023-12-310001881487acdc:TwoThousandTwentyTwoABLCreditFacilityMembersrt:MaximumMember2022-03-012022-03-310001881487us-gaap:ConvertibleCommonStockMember2025-12-310001881487acdc:ManufacturingSegmentMemberus-gaap:OperatingSegmentsMember2023-01-012023-12-310001881487acdc:AlpineTwoThousandAndTwentyThreeTermLoanMembersrt:MaximumMember2025-01-012025-12-310001881487us-gaap:TradeNamesMember2024-12-3100018814872024-12-310001881487us-gaap:AccumulatedOtherComprehensiveIncomeMember2024-12-310001881487acdc:PerformanceBasedVestingRsuMember2024-12-310001881487us-gaap:OperatingSegmentsMember2024-01-012024-12-310001881487us-gaap:RelatedPartyMemberacdc:FlyingAPumpServicesLLCMember2023-01-012023-12-310001881487us-gaap:CommonStockMemberus-gaap:CommonClassAMember2024-01-012024-12-310001881487us-gaap:SeriesAPreferredStockMembersrt:ParentCompanyMember2025-01-012025-12-310001881487us-gaap:CommonClassAMember2023-04-102023-04-100001881487acdc:AlpineTwoThousandAndTwentyThreeTermLoanMember2025-12-312025-12-3100018814872025-09-012025-09-300001881487acdc:BasinProductionAndCompletionLLCMemberacdc:FHEUSALLCMember2022-02-132022-02-140001881487us-gaap:CommonClassAMemberus-gaap:AdditionalPaidInCapitalMember2025-01-012025-12-310001881487acdc:EquifyNoteOneMember2025-12-310001881487acdc:MiningPropertyAndMineDevelopmentMember2025-12-310001881487us-gaap:RelatedPartyMemberacdc:CarboCeramicsIncMember2024-12-310001881487acdc:ExternalCustomersMemberus-gaap:OperatingSegmentsMemberus-gaap:ProductMember2023-01-012023-12-310001881487us-gaap:CommonClassBMember2024-12-310001881487acdc:ManufacturingSegmentMemberacdc:ExternalCustomersMemberus-gaap:OperatingSegmentsMemberus-gaap:ProductMember2023-01-012023-12-310001881487acdc:TwoThousandAndTwentyNineSeniorNotesMembersrt:ScenarioForecastMember2028-01-142028-01-140001881487acdc:StimulationServicesSegmentMember2025-01-012025-12-310001881487srt:MinimumMemberus-gaap:BuildingAndBuildingImprovementsMember2025-12-310001881487acdc:ExternalCustomersMemberus-gaap:OperatingSegmentsMemberacdc:ProppantProductionSegmentMemberus-gaap:ProductMember2025-01-012025-12-310001881487acdc:FlotekPWRtekNoteMemberacdc:FlotekIndustriesIncMemberacdc:StimulationServicesSegmentMemberacdc:WilksRelatedPartyMember2025-11-012025-11-300001881487us-gaap:DomesticCountryMember2025-12-310001881487acdc:FinanceLeaseObligationsMemberacdc:AlpineSubsidiaryMember2024-12-310001881487us-gaap:RelatedPartyMemberacdc:CarboCeramicsIncMember2025-01-012025-12-310001881487acdc:PerformanceBasedVestingRsuMember2025-01-012025-12-310001881487acdc:AlpineTwoThousandAndTwentyThreeTermLoanMember2025-12-310001881487us-gaap:CommonStockMemberus-gaap:CommonClassAMemberacdc:ProducersServiceHoldingsLlcMember2023-01-012023-12-310001881487us-gaap:OperatingSegmentsMemberacdc:StimulationServicesSegmentMember2025-01-012025-12-310001881487acdc:TwoThousandAndTwentyNineSeniorNotesMembersrt:MinimumMember2024-06-302024-06-300001881487acdc:PatentsAndLicenseMember2024-12-310001881487acdc:ProFracLLCMember2024-12-310001881487us-gaap:ServiceMember2024-01-012024-12-310001881487acdc:TwoThousandTwentyTwoABLCreditFacilityMember2025-12-310001881487us-gaap:SeriesAPreferredStockMembersrt:ParentCompanyMember2023-01-012023-12-310001881487acdc:PermianProppantAndEagleFordProppantMember2024-01-012024-09-300001881487us-gaap:NoncontrollingInterestMember2025-01-012025-12-310001881487acdc:TwoThousandAndTwentyNineSeniorNotesMembersrt:MinimumMember2024-12-312024-12-310001881487us-gaap:SeriesAPreferredStockMembersrt:ParentCompanyMember2024-01-012024-12-310001881487us-gaap:CommonStockMemberus-gaap:CommonClassAMember2025-12-310001881487acdc:FlotekMember2025-12-310001881487us-gaap:SellingGeneralAndAdministrativeExpensesMember2024-01-012024-12-310001881487acdc:TwoThousandAndTwentyNineSeniorNotesMembersrt:MinimumMember2024-09-302024-09-300001881487srt:ParentCompanyMember2023-01-012023-12-310001881487us-gaap:OperatingSegmentsMemberacdc:IntercompanyMemberacdc:ProppantProductionSegmentMember2023-01-012023-12-310001881487acdc:AlpineTwoThousandAndTwentyThreeTermLoanMember2025-06-012025-06-300001881487us-gaap:RetainedEarningsMember2025-01-012025-12-310001881487us-gaap:RetainedEarningsMember2022-12-310001881487us-gaap:RelatedPartyMemberacdc:CarboCeramicsIncMember2025-12-310001881487us-gaap:RetainedEarningsMember2024-12-310001881487acdc:BasinProductionAndCompletionLLCMember2024-04-012024-04-300001881487acdc:ManufacturingSegmentMember2025-01-012025-12-310001881487us-gaap:ProductMember2024-01-012024-12-310001881487srt:ConsolidationEliminationsMember2025-01-012025-12-310001881487acdc:ExternalCustomersMemberus-gaap:OperatingSegmentsMemberus-gaap:ServiceMember2023-01-012023-12-310001881487acdc:ExternalCustomersMemberus-gaap:OperatingSegmentsMemberus-gaap:ServiceMember2024-01-012024-12-310001881487acdc:PerformanceBasedVestingRsuMemberacdc:TwentyTwentyTwoLongTermIncentivePlanMembersrt:MaximumMember2025-01-012025-12-310001881487srt:ParentCompanyMember2025-01-012025-12-310001881487us-gaap:CommonStockMemberus-gaap:CommonClassAMember2022-12-310001881487acdc:AlpineTwoThousandAndTwentyThreeTermLoanMember2025-09-302025-09-300001881487acdc:ProppantProductionSegmentMember2024-12-310001881487us-gaap:RetainedEarningsMember2023-01-012023-12-310001881487acdc:FlotekSubsidiaryMemberacdc:FlotekOtherMember2024-12-310001881487us-gaap:CommonClassAMemberus-gaap:RestrictedStockUnitsRSUMember2024-01-012024-12-310001881487us-gaap:FairValueInputsLevel3Memberacdc:MungerMakeWholeProvisionMember2024-12-310001881487us-gaap:CommonClassBMember2025-12-310001881487acdc:PerformanceProppantsLlcMember2023-02-242023-02-240001881487srt:MinimumMemberus-gaap:SubsequentEventMemberus-gaap:SecuredOvernightFinancingRateSofrMember2026-03-032026-03-0300018814872022-12-310001881487acdc:ChiefExecutiveOfficerAndChairmanMemberacdc:ProFracLLCMember2025-12-310001881487srt:MaximumMemberus-gaap:StateAndLocalJurisdictionMember2025-01-012025-12-310001881487acdc:TwoThousandAndTwentyNineSeniorNotesMembersrt:ParentCompanyMember2025-12-310001881487acdc:NRGMember2024-01-012024-12-310001881487srt:MinimumMemberacdc:TwoThousandTwentyTwoABLCreditFacilityMemberus-gaap:SubsequentEventMemberus-gaap:SecuredOvernightFinancingRateSofrMember2026-03-032026-03-030001881487us-gaap:CommonClassAMember2023-04-072023-04-070001881487acdc:PerformanceProppantsLlcMembersrt:ConsolidationEliminationsMember2023-01-012023-12-310001881487acdc:EquifyNoteTwoMember2022-11-010001881487us-gaap:AdditionalPaidInCapitalMember2025-01-012025-12-310001881487us-gaap:RelatedPartyMember2025-01-012025-12-310001881487srt:MinimumMember2023-01-012025-12-310001881487acdc:OtherLongTermDebtMemberacdc:OtherSubsidiariesMember2024-12-310001881487acdc:TwoThousandAndTwentyNineSeniorNotesMemberacdc:SecuredOvernightFinancingRateMember2025-01-012025-12-310001881487us-gaap:RelatedPartyMemberacdc:FlyingAPumpServicesLLCMember2024-01-012024-12-310001881487acdc:FlotekSubsidiaryMember2024-12-310001881487acdc:NRGMember2024-06-300001881487us-gaap:SeriesAPreferredStockMembersrt:ParentCompanyMember2024-12-310001881487us-gaap:AccumulatedOtherComprehensiveIncomeMember2024-01-012024-12-310001881487us-gaap:RelatedPartyMember2025-12-310001881487acdc:TwoThousandAndTwentyNineSeniorNotesMemberus-gaap:SubsequentEventMember2026-01-012026-01-310001881487us-gaap:OperatingSegmentsMemberacdc:FlotekSegmentMember2025-12-310001881487acdc:AlpineTwoThousandAndTwentyThreeTermLoanMemberus-gaap:InterestRateFloorMember2025-01-012025-12-310001881487acdc:AlpineTwoThousandAndTwentyThreeTermLoanMembersrt:MinimumMember2024-09-302024-09-3000018814872025-07-042025-07-040001881487us-gaap:SeriesAPreferredStockMember2023-01-012023-12-310001881487acdc:EKUPowerDrivesMember2025-01-012025-12-310001881487acdc:PermianProppantAndEagleFordProppantMember2024-07-012024-09-300001881487us-gaap:OperatingSegmentsMemberacdc:IntercompanyMemberacdc:StimulationServicesSegmentMember2023-01-012023-12-310001881487srt:ParentCompanyMember2024-12-310001881487acdc:ManufacturingSegmentMemberus-gaap:OperatingSegmentsMember2024-01-012024-12-3100018814872026-01-012025-12-310001881487acdc:LimitationUnderSectionThreeEightTwoMemberus-gaap:DomesticCountryMember2025-12-310001881487acdc:ProducersServiceHoldingsLlcMember2023-01-012023-12-310001881487us-gaap:CustomerRelationshipsMember2025-12-310001881487us-gaap:OperatingSegmentsMemberacdc:StimulationServicesSegmentMember2024-12-310001881487us-gaap:SubsequentEventMemberacdc:TwoThousandTwentyTwoABLCreditFacilityMembersrt:MaximumMemberus-gaap:SecuredOvernightFinancingRateSofrMember2026-03-032026-03-030001881487acdc:SandMineMember2025-01-012025-12-310001881487acdc:ManufacturingSegmentMemberacdc:ExternalCustomersMemberus-gaap:OperatingSegmentsMemberus-gaap:ProductMember2025-01-012025-12-310001881487acdc:FinanceLeaseObligationsMemberacdc:OtherSubsidiariesMember2024-12-310001881487acdc:EquifyNoteOneMember2022-11-010001881487acdc:NRGMember2024-06-012024-06-300001881487acdc:AlpineSubsidiaryMember2024-12-310001881487us-gaap:ServiceMember2023-01-012023-12-310001881487acdc:FlyingAPumpServicesLLCMember2025-09-012025-09-300001881487us-gaap:TradeNamesMember2025-12-310001881487us-gaap:TechnologyBasedIntangibleAssetsMembersrt:MaximumMember2024-12-310001881487acdc:ExternalCustomersMemberus-gaap:OperatingSegmentsMemberus-gaap:ProductMember2024-01-012024-12-310001881487acdc:ProppantProductionSegmentMember2024-01-012024-12-310001881487us-gaap:SeriesAPreferredStockMembersrt:ParentCompanyMember2025-12-310001881487acdc:FlotekIndustriesIncMember2025-01-012025-12-310001881487us-gaap:ProductMember2023-01-012023-12-310001881487us-gaap:OperatingSegmentsMemberus-gaap:AllOtherSegmentsMember2024-01-012024-12-310001881487us-gaap:NoncontrollingInterestMember2024-01-012024-12-310001881487us-gaap:RelatedPartyMemberacdc:WilksEarthworksMember2025-12-310001881487acdc:FlyingAPumpServicesLLCMember2025-01-012025-12-310001881487acdc:FlotekPWRtekNoteMemberacdc:FlotekIndustriesIncMemberacdc:StimulationServicesSegmentMember2025-04-012025-04-300001881487us-gaap:RelatedPartyMember2023-01-012023-12-310001881487us-gaap:CommonClassAMemberacdc:WilksPartiesMember2025-08-012025-08-310001881487acdc:WestMungerMember2024-01-012024-12-310001881487us-gaap:CommonStockMemberus-gaap:CommonClassAMemberacdc:PerformanceProppantsLlcMember2023-01-012023-12-310001881487acdc:AlpineTwoThousandAndTwentyThreeTermLoanMembersrt:MinimumMember2024-12-312024-12-310001881487us-gaap:AdditionalPaidInCapitalMember2023-12-310001881487acdc:EKUPowerDrivesMember2025-06-012025-06-300001881487srt:MinimumMemberus-gaap:CustomerRelationshipsMember2025-12-310001881487us-gaap:RelatedPartyMemberacdc:EquifyFinancialLLCMember2025-01-012025-12-310001881487us-gaap:VariableInterestEntityPrimaryBeneficiaryMember2024-12-310001881487acdc:TwoThousandTwentyTwoABLCreditFacilityMember2025-01-012025-12-310001881487acdc:AlpineTwoThousandAndTwentyThreeTermLoanMembersrt:ScenarioForecastMember2026-06-302026-06-300001881487acdc:FlotekIndustriesIncMemberacdc:WilksRelatedPartyMember2025-11-012025-11-300001881487acdc:FlotekPWRtekNoteMemberacdc:FlotekSubsidiaryMember2025-12-310001881487us-gaap:NoncontrollingInterestMember2023-01-012023-12-310001881487us-gaap:CommonClassAMember2025-08-310001881487acdc:TwoThousandTwentyTwoABLCreditFacilityMemberus-gaap:SubsequentEventMember2026-03-030001881487acdc:AlpineTwoThousandAndTwentyThreeTermLoanMemberus-gaap:SecuredOvernightFinancingRateSofrOvernightIndexSwapRateMember2025-01-012025-12-310001881487stpr:LA2025-01-012025-12-310001881487acdc:BasinProductionAndCompletionLLCMember2024-06-300001881487us-gaap:SellingGeneralAndAdministrativeExpensesMember2025-01-012025-12-310001881487us-gaap:BaseRateMembersrt:MinimumMemberacdc:TwoThousandTwentyTwoABLCreditFacilityMember2022-03-310001881487us-gaap:OperatingSegmentsMemberus-gaap:AllOtherSegmentsMember2025-01-012025-12-310001881487acdc:FlotekMember2024-01-012024-12-3100018814872027-01-012025-12-310001881487us-gaap:OperatingSegmentsMemberus-gaap:AllOtherSegmentsMember2024-12-310001881487us-gaap:CommonStockMemberus-gaap:CommonClassBMember2023-01-012023-12-310001881487acdc:IntercompanyMembersrt:ConsolidationEliminationsMember2024-01-012024-12-310001881487acdc:FlyingAPumpServicesLLCMember2024-01-012024-01-310001881487us-gaap:OperatingSegmentsMemberacdc:IntercompanyMemberacdc:ProppantProductionSegmentMember2024-01-012024-12-310001881487acdc:ManufacturingSegmentMemberacdc:ExternalCustomersMemberus-gaap:OperatingSegmentsMemberus-gaap:ProductMember2024-01-012024-12-310001881487us-gaap:CommonClassAMember2025-12-310001881487us-gaap:CommonClassBMember2023-04-070001881487us-gaap:AdditionalPaidInCapitalMember2023-01-012023-12-310001881487acdc:BasinProductionAndCompletionLLCMemberacdc:FHEUSALLCMember2022-02-140001881487us-gaap:OperatingSegmentsMemberus-gaap:AllOtherSegmentsMember2025-12-310001881487acdc:WilksDevelopmentLLCMemberacdc:StimulationServiceEquipmentMember2024-12-012024-12-310001881487acdc:RedeemableNoncontrollingInterestsMemberus-gaap:IPOMember2023-01-012023-12-310001881487us-gaap:CommonClassAMember2025-08-012025-08-310001881487acdc:ExternalCustomersMemberus-gaap:OperatingSegmentsMemberacdc:FlotekSegmentMemberus-gaap:ProductMember2025-01-012025-12-310001881487us-gaap:RelatedPartyMemberacdc:FlyingAPumpServicesLLCMember2024-12-310001881487us-gaap:RelatedPartyMemberacdc:FHEUSALLCMember2023-01-012023-12-310001881487srt:MinimumMemberus-gaap:ForeignCountryMember2025-01-012025-12-310001881487acdc:WilksDevelopmentLLCMember2024-07-012024-07-010001881487us-gaap:AllOtherSegmentsMember2024-12-310001881487us-gaap:CommonClassAMemberus-gaap:PerformanceSharesMember2025-01-012025-12-310001881487us-gaap:OperatingSegmentsMemberacdc:IntercompanyMemberus-gaap:AllOtherSegmentsMember2024-01-012024-12-31utr:acrexbrli:pureacdc:Entityacdc:Segmentxbrli:sharesacdc:Agreementiso4217:USD
UNITED STATES
SECURITIES AND EXCHANGE COMMISSION
Washington, D.C. 20549
(Mark One)
☒ ANNUAL REPORT PURSUANT TO SECTION 13 OR 15(d) OF THE SECURITIES EXCHANGE ACT OF 1934
For the fiscal year ended: December 31, 2025
or
☐ TRANSITION REPORT PURSUANT TO SECTION 13 OR 15(d) OF THE SECURITIES EXCHANGE ACT OF 1934
For the transition period from __________ to __________
Commission file number: 001-41388
|
|
|
|
|
|
ProFrac Holding Corp. (Exact name of registrant as specified in its charter) |
|
|
|
|
|
|
Delaware (State or other jurisdiction of incorporation or organization) |
|
87-2424964 (I.R.S. Employer Identification No.) |
333 Shops Boulevard, Suite 301, Willow Park, Texas 76087
(Address of principal executive offices) (Zip Code)
Registrant’s telephone number, including area code: (254) 776-3722
Securities registered pursuant to Section 12(b) of the Act:
|
|
|
|
|
Title of each class |
|
Trading Symbol(s) |
|
Name of each exchange on which registered |
Class A common stock, par value $0.01 per share |
|
ACDC |
|
The Nasdaq Global Select Market Nasdaq Texas, LLC |
|
|
|
|
|
Securities registered pursuant to Section 12(g) of the Act: None
Indicate by check mark if the registrant is a well-known seasoned issuer, as defined in Rule 405 of the Securities Act.
Yes ☐ No ☒
Indicate by check mark if the registrant is not required to file reports pursuant to Section 13 or Section 15(d) of the Act.
Yes ☐ No ☒
Indicate by check mark whether the registrant (1) has filed all reports required to be filed by Section 13 or 15(d) of the Securities Exchange Act of 1934 during the preceding 12 months (or for such shorter period that the registrant was required to file such reports), and (2) has been subject to such filing requirements for the past 90 days.
Yes ☒ No ☐
Indicate by check mark whether the registrant has submitted electronically every Interactive Data File required to be submitted pursuant to Rule 405 of Regulation S-T (§ 232.405 of this chapter) during the preceding 12 months (or for such shorter period that the registrant was required to submit such files).
Yes ☒ No ☐
Indicate by check mark whether the registrant is a large accelerated filer, an accelerated filer, a non-accelerated filer, a smaller reporting company, or an emerging growth company. See the definitions of “large accelerated filer,” “accelerated filer,” “smaller reporting company,” and “emerging growth company” in Rule 12b-2 of the Exchange Act.
|
|
|
|
|
|
|
Large accelerated filer |
|
☐ |
|
Accelerated filer |
|
☑ |
Non-accelerated filer |
|
☐ |
|
Smaller reporting company |
|
☑ |
Emerging growth company |
|
☐ |
|
|
|
|
If an emerging growth company, indicate by check mark if the registrant has elected not to use the extended transition period for complying with any new or revised financial accounting standards provided pursuant to Section 13(a) of the Exchange Act. ☐
Indicate by check mark whether the registrant has filed a report on and attestation to its management’s assessment of the effectiveness of its internal control over financial reporting under Section 404(b) of the Sarbanes-Oxley Act (15 U.S.C. 7262(b)) by the registered public accounting firm that prepared or issued its audit report. ☒
If securities are registered pursuant to Section 12(b) of the Act, indicate by check mark whether the financial statements of the registrant included in the filing reflect the correction of an error to previously issued financial statements. ☐
Indicate by check mark whether any of those error corrections are restatements that required a recovery analysis of incentive-based compensation received by any of the registrant’s executive officers during the relevant recovery period pursuant to §240.10D-1(b). ☐
Indicate by check mark whether the registrant is a shell company (as defined in Rule 12b-2 of the Act). Yes ☐ No ☒
The aggregate market value of the registrant’s Class A common stock, $0.01 par value per share, held by non-affiliates of the registrant as of June 30, 2025, the last business day of the registrant’s most recently completed second fiscal quarter, was $116,271,456 based on the closing price of $7.76 per share of the Class A common stock, as reported on The Nasdaq Global Select Market on that date.
As of March 3, 2026, the registrant had 180,920,753 shares of Class A common stock, $0.01 par value per share, outstanding.
DOCUMENTS INCORPORATED BY REFERENCE
Portions of the registrant’s definitive proxy statement for the 2026 Annual Meeting of Stockholders, which will be filed with the U.S. Securities and Exchange Commission within 120 days after December 31, 2025, are incorporated by reference into Part III of this Annual Report on Form 10-K.
CAUTIONARY NOTE REGARDING FORWARD-LOOKING STATEMENTS
This Annual Report on Form 10-K (this “Annual Report”) contains certain “forward-looking statements” within the meaning of Section 27A of the Securities Act of 1933, as amended (the “Securities Act”), and Section 21E of the Securities Exchange Act of 1934, as amended (the “Exchange Act”). Forward-looking statements include those that express a belief, expectation or intention, as well as those that are not statements of historical fact. Forward-looking statements include information regarding our future plans and goals, as well as our expectations with respect to:
•our business strategy and future growth prospects;
•integration of acquired businesses;
•our future profitability, cash flows and liquidity;
•our financial strategy, budget, projections and operating results;
•the amount, nature and timing of our capital expenditures and the impact of such expenditures on our performance;
•the availability and terms of capital;
•our exploration, development and production activities;
•the market for our existing and future products and services;
•competition and government regulations; and,
•general economic conditions.
These forward-looking statements may be accompanied by words such as “anticipate,” “believe,” “estimate,” “expect,” “intend,” “may,” “outlook,” “plan,” “potential,” “predict,” “project,” “will,” “should,” “could,” “would,” “likely,” “future,” “budget,” “pursue,” “target,” “seek,” “objective,” or similar expressions that are predictions of or indicate future events or trends that do not relate to historical matters.
The forward-looking statements in this Annual Report speak only as of the date of this Annual Report, or such other date as specified herein. We disclaim any obligation to update these statements unless required by law, and we caution you not to place undue reliance on them. Forward-looking statements are not assurances of future performance and involve risks and uncertainties. We have based these forward-looking statements on our current expectations and assumptions about future events. While our management considers these expectations and assumptions to be reasonable, they are inherently subject to significant business, economic, competitive, regulatory and other risks, contingencies and uncertainties, most of which are difficult to predict and many of which are beyond our control. These risks, contingencies and uncertainties include, but are not limited to, the following:
•our ability to finance, consummate, integrate and realize the benefits expected from our past or future acquisitions, including any related synergies;
•uncertainty regarding the timing, pace and extent of economic growth in the United States and elsewhere, which in turn may affect demand for crude oil and natural gas and the demand for our services;
•the level of production of crude oil, natural gas and other hydrocarbons and the resultant market prices of crude oil, natural gas, natural gas liquids and other hydrocarbons;
•a further decline or future decline in domestic spending by the onshore oil and natural gas industry;
•actions by members of the Organization of Petroleum Exporting Countries, Russia and other oil-producing countries with respect to oil production levels and announcements of potential changes in such levels;
•the political and economic environment in oil and natural gas producing regions is uncertain and subject to instability from civil disorder, terrorism, war, armed conflict, and other geopolitical tensions;
•competitive conditions in our industry;
•changes in the long-term supply of and demand for oil and natural gas;
•actions taken by our customers, competitors and third-party operators;
•technological advances affecting energy consumption;
•a decline in demand for proppant;
•our ability as well as the ability of our customers to obtain permits, approvals and authorizations from governmental and third parties, and the effects of or changes to U.S. government regulation;
•changes in the availability and cost of capital;
•inflationary factors, such as increases in the labor costs, material costs and overhead costs;
•large or multiple customer defaults, including defaults resulting from actual or potential insolvencies;
•the effects of consolidation on our customers or competitors;
•the price and availability of debt and equity financing including changes in interest rates;
•our ability to complete growth projects on time and on budget;
•introduction of new drilling or completion techniques, or services using new technologies subject to patent or other intellectual property protections;
•operating hazards, natural disasters, weather-related delays, casualty losses and other matters beyond our control;
•acts of terrorism, war or political or civil unrest in the United States or elsewhere;
•loss or corruption of our information or a cyberattack on our computer systems;
•the price and availability of alternative fuels and energy sources;
•risks relating to launching new businesses;
•federal, state and local regulation of hydraulic fracturing and other oilfield service activities, as well as exploration and production activities, including public pressure on governmental bodies and regulatory agencies to regulate the industry;
•the availability of water resources, suitable proppant and chemicals in sufficient quantities for use in hydraulic fracturing fluids;
•the effects of existing and future laws and governmental regulations (or the interpretation thereof) on us and our customers;
•the severity and duration of widespread health events and related economic repercussions on the oil and gas industry and on demand for oil and gas; and
•the effects of future litigation.
These and other important factors that could affect our operating results and performance are described in (i) Part I, Item 1A “Risk Factors” and in Part II, Item 7 “Management’s Discussion and Analysis of Financial Condition and Results of Operations” of this Annual Report, and elsewhere within this Annual Report, (ii) our other reports and filings we make with the SEC from time to time, and (iii) other announcements we may make from time to time. Should one or more of the risks or uncertainties described in the documents above or in this Annual Report occur, or should underlying assumptions prove incorrect, our actual results, performance, achievements or plans could differ materially from those expressed or implied in any forward-looking statements. All such forward-looking statements in this Annual Report are expressly qualified in their entirety by the cautionary statements in this section.
Summary of Principal Risk Factors
Our business is subject to a number of risks and uncertainties. The following is a summary of the principal risk factors that could materially adversely affect our business, financial condition and results of operations. A more complete statement of those risks and uncertainties is set forth in “Risk Factors” in Item 1A of Part I of this Annual Report.
•Our business and financial performance depends on the level of capital spending by oil and gas companies operating within the areas we service.
•Our business depends upon our ability to obtain specialized equipment, parts and key raw materials from third-party suppliers, and we may be vulnerable to delayed deliveries and future price increases.
•Our reliance upon a few large customers may adversely affect our revenue and operating results.
•Oil and natural gas companies’ operations using hydraulic fracturing are substantially dependent on the availability of water, as are our frac sand mining and processing operations. Restrictions on the ability to obtain water and the disposal of flowback and produced water may impact their and our operations and have a corresponding adverse effect on our business, results of operations and financial condition.
•Our operations are subject to unforeseen interruptions and hazards inherent in the oil and natural gas industry, for which we may not be adequately insured, and which could cause us to lose customers and substantial revenue.
•To achieve our growth and vertical integration objectives, our management relies on a rapid succession of strategic acquisitions, investments or procurement arrangements the pace and scope of which may have the potential to adversely affect the day-to-day operation of our business, and our cash flows, financial condition and results of operations.
•Our growth and vertical integration objectives require substantial capital that we may be unable to obtain, or may only obtain at a cost or under terms that adversely affect our cash flows, financial condition and results of operations.
•We may have difficulty managing growth in our business, which could adversely affect our financial condition and results of operations.
•We may experience difficulties in integrating acquired assets into our business and in realizing the expected benefits of an acquisition.
•Our indebtedness could adversely affect our financial flexibility and competitive position and make us more vulnerable to adverse economic conditions.
•We have and are continuing to undertake initiatives to improve our liquidity. These initiatives may not be as successful as expected and our business may deteriorate further.
•Restrictions in our debt agreements and any future financing agreements may limit our ability to finance future operations, meet capital needs or capitalize on potential acquisitions and other business opportunities.
•An increase in interest rates would increase the cost of servicing our indebtedness and could reduce our profitability, decrease our liquidity and impact our solvency.
•We may not be able to generate sufficient cash flow to service all of our obligations, including our obligations under our credit and other financing facilities.
•Our operations and the operations of our customers are subject to environmental, health and safety laws and regulations, and future compliance, claims, and liabilities relating to such matters may have a material adverse effect on our results of operations, financial position or cash flows.
•Federal, state, and local legislative and regulatory initiatives relating to hydraulic fracturing, as well as governmental reviews and investment practices for such activities, may serve to limit future oil and natural gas E&P activities and could have a material adverse effect on our results of operations and business.
•The Issuer is a holding company and its only material asset is its equity interest in ProFrac LLC; accordingly the Issuer is entirely dependent upon distributions from ProFrac LLC to meet its obligations, including the payment of taxes and covering its corporate and other overhead expenses.
•Conflicts of interest could arise between us, on the one hand, and Dan Wilks and Farris Wilks and entities owned by or affiliated with them (collectively, the “Wilks Parties”), on the other hand, concerning among other things, business transactions, competitive business activities or business opportunities.
•The Wilks Parties have the ability to direct the voting of a majority of our voting stock, and their interests may conflict with those of our other stockholders.
•A significant reduction by the Wilks Parties of their ownership interests in ProFrac could adversely affect us.
•Our certificate of incorporation and bylaws, as well as Delaware law, contain provisions that could discourage acquisition bids or merger proposals, which may adversely affect the market price of our Class A Common Stock and could deprive our investors of the opportunity to receive a premium for their shares.
•Our certificate of incorporation designates the Court of Chancery of the State of Delaware as the sole and exclusive forum for certain types of actions and proceedings that may be initiated by our stockholders, which
could limit our stockholders’ ability to obtain a favorable judicial forum for disputes with us or our directors, officers, employees or agents.
•We do not presently anticipate paying cash dividends on our Class A Common Stock and our existing debt agreements, as well as the Series A Certificate of Designation, place restrictions on our ability to do so. Consequently, your only opportunity to achieve a return on your shares of Class A Common Stock is if the price of our Class A Common Stock appreciates.
•The price of our Class A Common Stock may decline as a result of the large number of shares available for sale.
•ProFrac Holding Corp. is required to make payments under the Tax Receivable Agreement for certain tax benefits that it may claim, and the amounts of such payments could be significant.
•In certain cases, payments under the Tax Receivable Agreement may be accelerated and/or significantly exceed the actual benefits, if any, we realize in respect of the tax attributes subject to the Tax Receivable Agreement.
•In the event that payment obligations under the Tax Receivable Agreement are accelerated in connection with certain mergers, other forms of business combinations or other changes of control, the consideration payable to holders of our Class A Common Stock could be substantially reduced.
•We will not be reimbursed for any payments made under the Tax Receivable Agreement in the event that any tax benefits are subsequently disallowed.
•We may issue preferred stock whose terms could adversely affect the voting power or value of our Class A Common Stock.
•We are a “controlled company” within the meaning of the Nasdaq rules and, as a result, qualify for and intend to rely on exemptions from certain corporate governance requirements.
PART I
ITEM 1. BUSINESS
Unless the context otherwise requires or is otherwise indicated, references in this Annual Report to the “Company,” “ProFrac,” “we,” “our” and “us,” or like terms, refer to (i) before the completion of the Corporate Reorganization, ProFrac Holdings, LLC, a Texas limited liability company (“ProFrac LLC”), and its consolidated subsidiaries; and (ii) following the completion of the Corporate Reorganization, ProFrac Holding Corp., a Delaware corporation (the “Issuer” or “ProFrac Corp.”), and its consolidated subsidiaries.
When we refer to a “fleet” or a “frac fleet,” we are referring to the pumping units, truck tractors, data trucks, storage tanks, chemical additive and hydration units, blenders and other equipment necessary to perform well stimulation services, including back-up pumping capacity.
Overview and Strategy
ProFrac Holding Corp. is a technology-focused, vertically integrated, innovation-driven energy services holding company providing hydraulic fracturing, proppant production, other completion services and other complementary products and services including distributed power generation to leading upstream oil and natural gas companies engaged in the exploration and production ("E&P") of North American unconventional oil and natural gas resources throughout the United States. Founded in 2016, ProFrac was built to be the go-to service provider for E&P companies' most demanding hydraulic fracturing needs. ProFrac Corp. operates in four business segments: Stimulation Services, Proppant Production, Manufacturing, and Flotek Industries, Inc., (“Flotek”).
We employ a differentiated business model, focused on vertical integration, technological innovation and actively acquiring assets and businesses that expand our capabilities. In combination with our technical expertise, our ability to design and manufacture equipment and produce proppant positions us to custom tailor our products and services to meet the needs of our customers.
We believe our combined technical and operational capabilities integrated across our four segments uniquely position us to capitalize on the demand for well stimulation services to support the ongoing development of American oil and gas reserves.
Our operations are focused on the most active unconventional regions in the United States, where we have cultivated deep and longstanding customer relationships with some of those regions’ leading E&P companies. We believe we are among the largest well stimulation services providers in the United States, with 22 active fleets as of December 31, 2025. We operate throughout nearly all major unconventional oil and gas basins in the United States and our scale and geographical footprint provide us with both operating leverage as well as exposure to a diversified customer and commodity mix.
We are also among the largest producers of in-basin frac sand in the United States, with approximately 21.5 million tons of annual nameplate capacity across eight frac sand mines (including our idled Merryville Sand Mine) in the Haynesville Shale in East Texas, Louisiana and Arkansas (the “Haynesville”), the Permian Basin in West Texas and New Mexico (the “Permian”) and the Eagle Ford Shale in South Texas (the “Eagle Ford”). In addition to the significant quantitative and qualitative benefits that our Proppant Production segment provides to our Stimulation Services Segment, our scale, reach and proximity of our mines to customers’ well sites enable reliable, low-cost sand production for third party proppant customers.
Our business combines a young fleet of modern, technologically advanced pressure pumping equipment with vertically integrated proppant, chemicals and manufacturing, enabling us to deliver premium products and service quality while maintaining an advantaged cost structure.
Operating Segments
Stimulation Services Segment
ProFrac is one of the largest providers of well stimulation services in the United States. As of December 31, 2025, we had 22 active fleets. Of our active fleets 16 are Tier IV fleets (all of which are dual fuel or DGB equipment), two are Tier II (none of which are dual fuel equipment) and four are electric fleets. Currently, our operations are focused on the Permian, Eagle Ford, Haynesville, Appalachia, the Bakken and the Rockies. With our broad operating footprint, we are able to serve a diversified base of E&P customers that are developing both oil and natural gas reserves.
Our hydraulic fracturing fleets have been designed to handle the most demanding well completions, which are characterized by higher pumping pressures, higher pumping volumes and longer horizontal wellbores. Through our integrated asset management program we continue to upgrade and overhaul our fleets. This program is designed to deliver field-ready equipment that is engineered for reliability, purpose-built to meet customer requirements, and standardized in both appearance and operation. By centralizing asset management, we are able to manage equipment availability holistically, which enables our operating regions to focus on executing operations efficiently at the wellhead.
In addition to our diesel-burning and dual-fuel fleets, we are one of the largest providers of electric powered fleets in the industry. This technology utilizes electric motors powered by lower-cost, lower-emission power solutions, primarily using on-site generation from natural gas produced and conditioned in the field or compressed natural gas (“CNG”). We believe that this fuel supply can provide our customers with additional tools to meet their emissions and sustainability goals by reducing their reliance on diesel fuel, as well as offer significant fuel cost savings. These fleets are intended to provide our customers a suite of options to satisfy their ESG objectives while maximizing operating efficiency.
Our Stimulation Services competitors include Halliburton Company, Liberty Energy Inc., ProPetro Holding Corp., and Patterson-UTI Energy, Inc., among others.
Proppant Segment
We are among the largest producers of in-basin frac sand in the United States, with approximately 21.5 million tons of annual nameplate capacity across eight frac sand mines (including our idled Merryville Sand Mine) in the Haynesville, the Permian and the Eagle Ford. Our primary objective is to be the most reliable, cost-effective supplier of in-basin frac sand while maximizing value to our stakeholders through the generation of strong cash flow. We believe that our scale, our proximity to our customers’ operations in key markets and our commercial approach differentiates us from our competitors and positions us to meet our primary objective.
Our scale enables us to be a reliable, low-cost producer for customers in the areas in which we operate. Our mines are strategically located throughout some of the most active crude oil and natural gas production markets: the Haynesville, Permian and Eagle Ford. Our geographic diversification, as well as diversification across oil and natural gas production, allows us the flexibility to respond to market volatility. The proximity of our mines to the areas in which our customers operate allows them to lower transportation cost, reduce transportation time, improve reliability of delivery, reduce down time, store less proppant on-site and increase operational efficiencies.
Competitors to our Proppant Production segment include Atlas Energy Solutions Inc., Badger Mining Corporation, Iron Oak Energy Solutions, Freedom Proppant, Signal Peak Silica, U.S. Silica Inc., Vista Minerals and Capital Sand Company, among others.
Manufacturing Segment
We operate facilities in which we assemble new fleets, refurbish existing fleets, rebuild engines and transmissions, and manufacture many of the components used by our fleets, including pumps, fluid ends, power ends, flow iron and other consumables. These facilities perform substantially all of the maintenance, repair and servicing of our hydraulic fracturing fleets, as well as provide in-house manufacturing capacity that enables cost-advantaged growth and maintenance. Additionally, our internal manufacturing capabilities enable us to upgrade and modernize acquired fleets in a cost-efficient manner.
Vertical integration enables us to realize a lower capital investment and operating expense by capturing the margin of manufacturing and/or maintenance, and by enabling the ongoing improvement of our equipment and processes as part of a continuous research and development cycle. We believe our approach to growing, maintaining and modernizing our fleets helps us mitigate supply chain constraints that have disrupted competitors’ and customers’ operations in the past. Our in-house manufacturing capabilities also allow us to rapidly implement new technologies in a cost-effective manner.
Our manufacturing capabilities and control over the manufacturing process have allowed us to design and build hydraulic fracturing fleets to uniform specifications intended for deployment in resource basins requiring high levels of pressure, flow rate and sand intensity. We believe the standardized, modular configuration of our equipment provides us with several competitive advantages, including reduced repair and maintenance costs, reduced downtime, reduced inventory costs, reduced complexity in our operations, training efficiencies and the ability to redeploy equipment among operating basins.
Competitors to our Manufacturing segment include Caterpillar, Inc., Gardner Denver, and EnQuest Energy Solutions, among others.
Flotek Segment
Flotek is a leading chemistry and data technology company focused on servicing the E&P industry. Flotek creates unique solutions to reduce the environmental impact of energy on air, water, land and people. As a technology-driven, specialty green chemistry and data company, Flotek helps customers across industrial and commercial markets improve their environmental performance. Flotek serves specialty chemistry needs for both domestic and international energy markets. Flotek’s Chemistry Technologies segment designs, develops, manufactures, packages and distributes green, specialty chemicals that help customers improve their return on invested capital, lower operational costs and realize tangible environmental benefits aimed at enhancing the profitability of hydrocarbon producers. Flotek’s Data Analytics segment aims to enable users to maximize the value of their hydrocarbon associated processes by providing analytics associated with their
hydrocarbon streams in seconds rather than minutes or days. The real-time access to information prevents waste, reduces reprocessing and allows users to pursue automation of their hydrocarbon streams to increase their profitability.
Competitors of Flotek include various small and large companies that provide chemical and data analysis products and services for domestic and international energy markets.
Other Business Activities
The Company’s other business activities include Livewire Power, LLC (“Livewire”), which began operations in October 2024. Livewire enables onsite power generation services for oilfield and non-oilfield customers that require off-grid power solutions. Livewire’s power generation equipment is comprised of owned and leased natural gas reciprocating engines and turbine assets.
Competitors include Life Cycle Power, Voltagrid LLC, Solaris Energy Infrastructure, Inc., Liberty Energy Inc. and Gensystems Power Solutions, among others.
2025 Significant Events
Sale-Leaseback Transaction
In April 2025, we sold certain gas conditioning equipment to Flotek for total consideration of $107.5 million. We now lease these assets back from Flotek through April 2031. Part of the $107.5 million consideration was a $40.0 million intercompany note payable from Flotek to us (“Flotek PWRtek Note”). In November 2025, we assigned the Flotek PWRtek Note receivable to PC Energy Credit I, LLC, a related party to the Company controlled by the Wilks Parties, in exchange for cash consideration of $40.4 million.
EKU Disposition
In June 2025, we disposed of our interest in EKU Power Drives GmbH and its wholly-owned subsidiary EKU Power Drives, Inc., previously in our Manufacturing Segment.
Amendment to Alpine Term Loan Credit Agreement
In June and December 2025, we amended the senior secured term loan credit agreement (the “Alpine Term Loan Credit Agreement”) between our Alpine subsidiary and CLMG Corp., as administrative agent and collateral agent, and the several lenders thereto. Under the terms of the June 2025 amendment, the amortization payments required to be made on June 30, 2025, September 30, 2025 and December 31, 2025 were reduced from $15.0 million to $5.0 million and we will pay an exit fee of $3.4 million when the term loan is repaid. Under the terms of the December 2025 amendment, the amortization payments required to be made on March 31, 2026 and June 30, 2026 were reduced from $15.0 million to $7.5 million. Additionally, the Alpine 2023 Term Loan Credit Agreement contained a covenant commencing with the fiscal quarter ending March 31, 2026, requiring Alpine not to exceed a maximum Total Net Leverage Ratio (as defined in the Alpine Term Loan Credit Agreement) of 2.00 to 1.00. This covenant was amended to commence testing compliance with the Total Net Leverage Ratio with the fiscal quarter ending on March 31, 2028.
Issuance of Additional Senior Secured Notes
In June 2025, we entered into a purchase agreement with Beal Bank USA and Wilks Brothers, LLC, pursuant to which we agreed to issue and sell $60.0 million in additional senior secured floating rate notes due 2029 (“2029 Senior Notes”) in a private placement. An aggregate of $20.0 million of new notes was purchased by Wilks Brothers, LLC on June 30, 2025, and an aggregate of $40.0 million of new notes was purchased by Wilks Brothers, LLC and Beal Bank USA on December 15, 2025. The net proceeds from these transactions were used to fund capital expenditures and support ongoing operations and working capital requirements.
Equity Offering
In August 2025, we completed an underwritten public offering of 18,750,000 shares of our Class A common stock. The underwriters subsequently partially exercised their 30-day overallotment option to purchase an additional 1,840,998 shares, which closed on August 27, 2025. The net proceeds from the offering, after underwriting fees and commissions, were approximately $79.0 million and used primarily to repay borrowings under our asset-based revolving credit facility and for general corporate purposes, including working capital.
2024 Significant Events
Acquisition of Basin Production and Completion LLC
In April 2024, we acquired all of the remaining equity interests of Basin Production and Completion LLC (“BPC”). BPC is the parent company of FHE USA LLC, which manufactures equipment used in the hydraulic fracturing industry. The total purchase consideration was $39.8 million, consisting of cash consideration of $14.9 million and our pre-existing investment of $24.9 million.
Acquisition of Advanced Stimulation Technologies, Inc.
In June 2024, we acquired 100% of the issued and outstanding capital stock of Advanced Stimulation Technologies, Inc. (“AST”), a pressure pumping services provider serving the Permian Basin, for total purchase consideration of $173.4 million in cash.
Acquisition of NRG Manufacturing, Inc.
In June 2024, we acquired 100% of the issued and outstanding common stock of NRG Manufacturing, Inc., which manufactures equipment used in the hydraulic fracturing industry, and its affiliate, AMI US Holdings, Inc., which develops commercial software used in hydraulic fracturing industry (collectively, “NRG”), for total purchase consideration of $6.0 million in cash.
Sale-Leaseback Transaction
In December 2024, we sold certain stimulation service equipment to the Wilks Parties in exchange for cash consideration of approximately $40.0 million. We now lease such equipment from the Wilks Parties in exchange for aggregate monthly lease payments totaling $44.8 million through December 2028. The cash consideration received was $26.5 million more than the carrying value of these assets. Because this sale was to an affiliate under common control, we accounted for the $26.5 million as an equity transaction recorded as a deemed contribution within our consolidated statements of changes in equity.
2023 Significant Events
Acquisition of Producers Service Holdings LLC
On January 3, 2023, we acquired 100% of the issued and outstanding membership interest of Producers Service Holdings LLC (“Producers”), a Delaware limited liability company, an employee-owned pressure pumping services provider serving Appalachia and the Mid-Continent, for approximately $36.5 million of total transaction value, of which approximately half was payable in shares of ProFrac’s Class A common stock, par value $0.01 per share (the “Class A Common Stock”), with the remainder consisting of cash and debt assumption. A portion of the cash consideration was subject to certain customary post-closing adjustments. Through this transaction, we added three fleets, of which two are currently active, totaling 200,000 HHP as well as a 50,000 square foot manufacturing facility located near Zanesville, OH, through which we plan to expand our manufacturing footprint to support Northeast operations.
Acquisition of Performance Proppants
On February 24, 2023, we acquired 100% of the issued and outstanding membership interests in (i) Performance Proppants, LLC, a Texas limited liability company, (ii) Red River Land Holdings, LLC, a Louisiana limited liability company, (iii) Performance Royalty, LLC, a Louisiana limited liability company, (iv) Performance Proppants International, LLC, a Louisiana limited liability company, and (v) Sunny Point Aggregates, LLC, a Louisiana limited liability company (together, “Performance Proppants”) for a total purchase consideration of approximately $462.8 million, consisting of (x) $452.4 million in cash, (y) a number of shares of Class A Common Stock equal to $6.2 million, and (z) the settlement of a pre-existing receivable of $4.2 million. Performance Proppants is a frac sand provider in the Haynesville basin.
Redemption of ProFrac LLC Units
Pursuant to the Third Amended and Restated Limited Liability Company Agreement of ProFrac Holdings, LLC, a Texas limited liability company (“ProFrac LLC”) (the “LLC Agreement”) and the Second Amended and Restated Certificate of Incorporation of ProFrac, certain members of ProFrac LLC had the right (the “Redemption Right”) to cause ProFrac LLC to redeem all or a portion of each such member’s units in ProFrac LLC (the “ProFrac LLC Units”), together with the surrender of the same number of each such member’s shares of ProFrac’s Class B common stock, par value $0.01 per share (the “Class B Common Stock”), for an equivalent number of shares of Class A Common Stock or, at the election of ProFrac’s audit committee, cash as provided for in the LLC Agreement.
Pursuant to redemption notices delivered in accordance with the LLC Agreement, all of the eligible holders of ProFrac LLC Units (the “Redeeming Members”) exercised their Redemption Right with respect to all of their ProFrac LLC Units, representing an aggregate of 104,195,938 ProFrac LLC Units (collectively, the “Redeemed Units”), together with the surrender and delivery of the same number of shares of Class B Common Stock (the “Redemption”). The Redeeming
Members included entities owned by or affiliated with ProFrac’s controlling stockholders, Dan Wilks and Farris Wilks, as well as Matt Wilks, ProFrac’s Executive Chairman, an entity affiliated with Ladd Wilks, ProFrac’s Chief Executive Officer, and Coy Randle, a former member of the ProFrac board of directors.
On April 7, 2023, in accordance with the LLC Agreement, ProFrac delivered a written notice to ProFrac LLC and the Redeeming Members setting forth the Company’s election to exercise its right to purchase directly and acquire the Redeemed Units (together with the surrender and delivery of the same number of shares of Class B Common Stock) from the Redeeming Members.
We subsequently acquired the Redeemed Units from the Redeeming Members by issuing an aggregate of 101,133,202 shares of Class A common stock on or about April 10, 2023 and the remaining 3,062,736 shares of Class A Common Stock on or about April 13, 2023. The surrendered shares of Class B common stock were canceled, and after giving effect to the Redemption, no shares of our Class B Common Stock remain issued and outstanding.
Issuance and Sale of Newly Designated Series A Redeemable Convertible Preferred Stock
On September 29, 2023, ProFrac entered into a purchase agreement (“Series A Purchase Agreement”) with THRC Holdings, LP, a Texas limited partnership (“THRC Holdings”) and FARJO Holdings, LP, a Texas limited partnership (“FARJO Holdings” and, together with THRC Holdings, the “Series A Investors”), pursuant to which ProFrac agreed to issue and sell shares of its new series of preferred stock, designated as Series A Redeemable Convertible Preferred Stock, par value $0.01 per share (the “Series A Preferred Stock”), in a private placement transaction (“Private Placement”). At the closing of the Private Placement on September 29, 2023, ProFrac issued and sold to the Series A Investors 50,000 shares of the Series A Preferred Stock at a purchase price of $1,000.00 per share. The gross proceeds to the Company from the sale of the Series A Preferred Stock were $50.0 million. The shares of Series A Preferred Stock are convertible into shares of Class A Common Stock. Holders of the Series A Preferred Stock are entitled to cumulative paid-in-kind dividends at a rate per share equal to eight percent per annum. Such dividends shall compound and be payable quarterly in arrears. The foregoing description of the Series A Preferred Stock does not purport to be complete and is qualified in its entirety by reference to the Series A Certificate of Designation, a copy of which is filed as Exhibit 3.3 to this Annual Report, and is incorporated by reference herein.
Flying A Pump Services, LLC Agreement
In June 2023, ProFrac arranged to sell certain surplus equipment and inventory components and to assign certain pre-orders for equipment to Flying A Pump Services, LLC (“Flying A”), at prices which are consistent with fair market value, for a total consideration of $36.3 million. ProFrac received the proceeds from this transaction in June 2023. Subsequent to June 30, 2023, Flying A requested changes to the mix of the assets being sold to it by the Company without altering the total consideration, and the Company and Flying A agreed to add to the transaction agreement a most favored nation clause on pricing and a condition to closing that the Company’s Audit Committee approve the final mix of assets to be transferred to Flying A. We delivered $28.9 million of these components to Flying A in 2023. In January 2024, we agreed to sell $8.4 million of additional equipment to Flying A under similar terms. We received the proceeds from this additional transaction in January 2024. We delivered $12.6 million and $2.4 million of product to Flying A in 2024 and 2025 respectively. We expect to deliver the remaining $0.8 million of product to Flying A in 2026.
Debt Refinancing
In December 2023, we completed the refinancing of our existing senior secured term loan and other debt with two new financings totaling $885 million, which will both mature in 2029. As a result of these transactions, we extended our significant debt maturities to 2029. For more information, see “Note 7. Debt” in the notes to our consolidated financial statements.
Customers
Our customers consist primarily of E&P companies in the continental United States. For the years ended December 31, 2025, December 31, 2024, and December 31, 2023 no individual customer represented more than 10% of our consolidated revenues. The loss of any of our largest customers could have a material adverse effect on our results of operations.
Seasonality
Historically, our operations have been subject to seasonal factors, and our historical financial results reflect seasonal variations. For example, we have observed a slowdown or pause by our customers around the holiday season in the fourth quarter, some of which may be related to our customers’ annual capital spending budgets. Additionally, our operating results may decline during periods of inclement weather conditions.
Human Capital Management
Our employees are a critical asset and are key to our innovative culture and overall success. We are focused on building upon our high-performance culture by attracting, engaging, developing, retaining and rewarding top talent. We strive to enhance the economic and social well-being of our employees. We are committed to providing a welcoming, inclusive environment for our workforce, with training and career development opportunities to enable employees to thrive and achieve their career goals.
As of December 31, 2025, we employed 2,280 people, none of whom are represented by labor unions or subject to collective bargaining agreements.
Health and Safety. The health, safety, and well-being of our employees is of utmost importance to us. We have a proven track record in safety performance with a Total Reportable Incident Rate of 0.35 for the year ended December 31, 2025, including our manufacturing division.
Employee Welfare and Development. We provide employees the option to participate in health and welfare plans, including medical, dental, life, accidental death and dismemberment and short-term and long-term disability insurance plans. We also offer a number of health and wellness programs, including telemedicine, health screens and fitness reimbursement as well as access to the Employee Assistance Program, which provides employees and their family members access to professional providers to help navigate challenging life events 24 hours a day, 365 days a year.
Intellectual Property
We have been granted over 187 patents worldwide, which begin to expire in late 2032. We have over 105 additional patent applications pending worldwide. Many of these patents were filed in an effort to protect USWS electric fleet technology from being duplicated by competitors. We also use proprietary technology to support our preventative maintenance program and prolong equipment useful life. Although in the aggregate, our trademarks and patents are important to us, we do not regard any single trademark, patent, or group of related trademarks or patents as critical or essential to our business as a whole. For information regarding litigation involving our intellectual property portfolio, see “Note 14. Commitments and Contingencies” in the notes to our consolidated financial statements.
Operating Risks and Insurance
Our operations are subject to hazards inherent in the energy services industry, such as accidents, breakdowns, blowouts, explosions, fires and spills and releases that can cause personal injury or loss of life, damage or destruction of property, equipment, natural resources and the environment and suspension of operations.
In addition, claims for loss of oil and natural gas production and damage to formations can occur in the oilfield services industry. If a serious accident were to occur at a location where our equipment and services are being used, it could result in our being named as a defendant in lawsuits asserting large claims.
Because our business involves the transportation of heavy equipment and materials, we may also experience traffic accidents which may result in spills, property damage and personal injury.
Despite what we view as our strong safety record and our efforts to maintain safety standards, we from time to time have suffered accidents in the past and anticipate that we could experience accidents in the future. In addition to the property damage, personal injury and other losses from these accidents, the frequency and severity of these incidents affect our operating costs and insurability and our relationships with customers, employees, regulatory agencies and other parties. Any significant increase in the frequency or severity of these incidents, or the general level of compensation awards, could adversely affect the cost of, or our ability to obtain, workers’ compensation and other forms of insurance, and could have other material adverse effects on our financial condition and results of operations.
We maintain commercial general liability, workers’ compensation, business auto, commercial property, excess liability, and directors and officers insurance policies providing coverage of risks and amounts that we believe to be customary in our industry. Further, we have pollution legal liability coverage for our business entities, which would cover, among other things, third-party liability and costs of clean-up relating to environmental contamination on our premises, while our equipment is in transit and while on our customers’ job site. With respect to our hydraulic fracturing operations, coverage would be available under our pollution legal liability policy for any surface environmental clean-up and liability to third parties arising from any surface contamination. We also have certain specific coverage for some of our business segments, including for our hydraulic fracturing services.
Although we maintain insurance coverage of types and amounts that we believe to be customary in the industry, we are not fully insured against all risks, either because insurance is not available or because of the high premium costs relative to perceived risk. Further, insurance rates have in the past been subject to wide fluctuation and changes in coverage could result in less coverage, increases in cost or higher deductibles and retention. Liabilities for which we are not insured, or which exceed the policy limits of our applicable insurance, could have a material adverse effect on our business and financial condition.
In addition, concerns over silicosis and other potential adverse health effects, as well as concerns regarding potential liability from the use of silica, may have the effect of discouraging our customers’ use of our frac sand and discouraging our insurers from covering this risk. The actual or perceived health risks of mining, processing and handling silica could adversely affect frac sand producers, including us, through reduced use of frac sand, the threat of product liability or employee lawsuits, increased scrutiny by federal, state and local regulatory authorities of us and our customers or reduced financing sources available to the silica industry.
Environmental and Occupational Health and Safety Regulations
Our operations are subject to stringent laws and regulations governing the discharge of materials into the environment or otherwise relating to environmental protection, compliance, and occupational health and safety. Numerous federal, state, and local governmental agencies issue regulations that often require difficult and costly compliance measures that could carry substantial administrative, civil, and criminal penalties for non-compliance and may result in injunctive action. In certain circumstances, states have the option of adopting more stringent environmental standards and regulations than are implemented on the federal level. These laws and regulations may, for example, restrict the types, quantities and concentrations of various substances that can be stored, transported, disposed or released into the environment; limit or prohibit construction or drilling activities on certain lands lying within wilderness, wetlands, ecologically or seismically sensitive areas and other protected areas; or require action to prevent, control, or remediate pollution from current or former operations. Also, these laws and regulations often require permits, authorizations, or licenses that impose operational restrictions and reporting obligations. Moreover, it is not uncommon for neighboring landowners and other third parties to file claims for personal injury and property damage allegedly caused by the release of hazardous substances, hydrocarbons or other waste products into the environment. Changes in environmental, health and safety (“EHS”) laws and regulations occur frequently, and any changes that result in more stringent and costly requirements could materially adversely affect our operations and financial position. However, a number of changes to regulations under the Trump administration has made environmental compliance more lenient. Specifically in February of 2026, the U.S. Environmental Protection Agency (“EPA”) issued a final rule eliminating the 2009 greenhouse gas (“GHG”) endangerment finding which will immediately impact vehicle regulations, but could have a ripple effect on any GHG compliance activities. Similarly, in January of 2026, the Trump administration formally withdrew from the Paris Agreement. As one more example, in November of 2025, the EPA finalized a rule to delay a requirement that oil and gas operators reduce methane pollution. It is likely that further deregulation will occur under the Trump administration. We have not experienced any material adverse effect from compliance with current EHS requirements; however, we cannot guarantee this will always be the case.
Below is an overview of some of the more significant environmental, health and safety requirements with which we must comply. Our customers’ operations are subject to similar laws and regulations. Any material adverse effect of these laws and regulations on our customers’ operations and financial position may also have an indirect material adverse effect on our operations and financial position.
Waste Handling. We handle, transport, store and dispose of wastes that are subject to the Resource Conservation and Recovery Act (“RCRA”) and comparable state laws and regulations, which affect our activities by imposing requirements regarding the generation, transportation, treatment, storage, disposal and cleanup of hazardous and non-hazardous wastes. With federal approval, the individual states administer some or all of the provisions of RCRA, sometimes in conjunction with their own, more stringent requirements. Although certain petroleum production wastes are exempt from regulation as hazardous wastes under RCRA, such wastes may constitute “solid wastes” that are subject to the less stringent requirements of non-hazardous waste provisions.
Administrative, civil and criminal penalties can be imposed for failure to comply with waste handling requirements. Moreover, the EPA or state or local governments may adopt more stringent requirements for the handling of non-hazardous wastes or re-categorize some non-hazardous wastes as “special waste” or hazardous wastes in the future. Indeed, legislation has been proposed from time to time in the U.S. Congress to re-categorize certain oil and natural gas exploration, development and production wastes as hazardous wastes. Several environmental organizations have also at times petitioned the EPA to modify existing regulations to re-categorize certain oil and natural gas exploration, development and production wastes as hazardous. Any such changes in these laws and regulations could have a material adverse effect on our capital expenditures and operating expenses. Although we do not believe the current costs of managing our wastes, as presently classified, to be significant, any legislative or regulatory reclassification of oil and natural gas E&P wastes could increase our costs to manage and dispose of such wastes.
Remediation of Hazardous Substances. The Comprehensive Environmental Response, Compensation and Liability Act (“CERCLA”) and analogous state laws generally impose liability without regard to fault or legality of the original conduct, on classes of persons who are considered to be responsible for the release of a hazardous substance into the environment. These persons can include the current owner (or lessee) or operator of a contaminated facility, a former owner (or lessee) or operator of the facility at the time of contamination, and those persons that disposed or arranged for the disposal of the hazardous substance at the facility. Liability for the costs of removing or remediating previously disposed wastes or
contamination, damages to natural resources, and the costs of conducting certain health studies, among other things, is strict and joint and several. In the course of our operations, we use materials that, if released, could be subject to regulation under CERCLA and comparable state laws. Therefore, governmental agencies or third parties may seek to hold us responsible under CERCLA and comparable state statutes for all or part of the costs to clean up sites at which such substances have been released. Such liability could require us to engage in expensive litigation to defend the claims, and to allocate our proportionate share of liability, if any. Further, we may need to make significant expenditures to investigate and remediate such contamination under such laws, which could have a material adverse effect on our results of operations, competitive position or financial condition.
NORM. In the course of our operations, some of our equipment may be exposed to naturally occurring radioactive materials (“NORM”) associated with oil and gas deposits and, accordingly, may result in the generation of wastes and other materials containing NORM. NORM exhibiting levels of radiation in excess of established state standards are subject to special handling and disposal requirements, and any storage vessels, piping and work area affected by NORM may be subject to remediation or restoration requirements.
Some of our operations involve equipment containing regulated radioactive materials that require federal and/or state permits, reporting, testing and proper management practices. Any releases from that equipment may result in liability and/or an obligation to complete remediation and restoration.
Water Discharges. The Clean Water Act (“CWA”), Safe Drinking Water Act (“SDWA”), Oil Pollution Act (“OPA”) and analogous state laws and regulations impose restrictions and strict controls regarding the unauthorized discharge of pollutants, including produced waters and other oil and gas wastes, into regulated waters. The discharge of pollutants into regulated waters is prohibited, except in accordance with the terms of a permit issued by the EPA or the state. Federal and state laws and regulations may also regulate the discharge of stormwater or discharge to groundwater, often necessitating additional permits and design criteria. The discharge of dredge and fill material into regulated waters, including wetlands, is also prohibited, unless authorized by a permit issued by the U.S. Army Corps of Engineers (the “Corps”). The scope of these regulated waters has been subject to controversy and revisions in recent years. To the extent any rule or regulation expands the scope of the CWA’s jurisdiction, we and our customers could face increased costs and delays with respect to obtaining permits for dredge and fill activities in wetland areas. Additionally, many states have similar requirements that apply to state waters where federal jurisdiction ends, and as a result, under most circumstances, discharges of pollutants reaching any permanent waterbodies will likely be regulated.
Noncompliance with the CWA, SDWA, OPA, or other laws or regulations relating to water discharges may result in substantial administrative, civil and criminal penalties, as well as injunctive obligations, for us or our customers. The process for obtaining or renewing permits also has the potential to delay operations. Additionally, spill prevention, control and countermeasure plan requirements require appropriate containment berms and similar structures to help prevent the contamination of regulated waters
Air Emissions. The Clean Air Act (“CAA”) and comparable state laws and regulations, regulate emissions of various air pollutants through the issuance of permits and the imposition of other emissions control requirements. The EPA has developed, and continues to develop, stringent regulations governing emissions of air pollutants from specified sources. New facilities may be required to obtain permits and meet more stringent design criteria before work can begin, and existing facilities may be required to obtain additional permits and incur capital costs in order to remain in compliance. For example, the EPA has established emission control requirements for crude oil and natural gas production and processing operations and established criteria for aggregating multiple small surface sites into a single source for air quality permitting purposes, which could cause small facilities, on an aggregate basis, to be deemed a major source subject to more stringent air permitting processes and requirements. These and other laws and regulations may increase the costs of compliance for some facilities where we operate. Obtaining or renewing permits also has the potential to delay the development of oil and natural gas projects. Additional costs or delays incurred by our customers could adversely affect demand for the oil and natural gas they produce, which could reduce demand for our services.
Climate Change. Climate change continues to attract considerable public and scientific attention. As a result, numerous proposals have been made and are likely to continue to be made at the international, national, regional and state levels of government to monitor and limit emissions of carbon dioxide, methane and other GHGs. These efforts have included consideration of cap-and-trade programs, carbon taxes, GHG reporting and tracking programs and regulations that directly limit GHG emissions from certain sources.
Separately, various states and groups of states have adopted or are considering adopting legislation, regulation or other regulatory initiatives that are focused on such areas as GHG cap and trade programs, carbon taxes, reporting and tracking programs, and restriction of GHG emissions. For example, several states, including Pennsylvania and New Mexico, have proposed or adopted regulations restricting the emission of methane from E&P activities. Additionally, domestic and international proposals aim to, among other things, cut global methane pollution, increase spending on promoting “clean energy,” and limit methane emissions from certain facilities, including certain oil and gas facilities. The full impacts of such
orders, pledges, agreements and any further legislation or regulation promulgated to fulfill the United States’ commitments under these initiatives cannot be predicted at this time.
Governmental, scientific, and public concern over the threat of climate change arising from GHG emissions has resulted in increasing political risks in the United States. For example, in April 2024, the U.S. Bureau of Land Management (“BLM”) finalized a rule intended to reduce natural gas waste from venting, flaring and leaks during oil and gas production activities on federal and Indian leases. Certain states have challenged the rule in federal court, and the timing, scope, and manner of its implementation remains uncertain. For more information, see our regulatory disclosure below titled “Regulation of Hydraulic Fracturing and Related Activities.” As a result, we cannot predict the full impact of these developments, including the possibility of additional regulatory restrictions. These regulatory developments could adversely affect our business to the extent they result in decreased demand for our products and services.
We may also be subject to evolving federal, state, and industry regulations and disclosure requirements related to climate change and GHG emissions. The full extent and timing of such requirements are uncertain, and we cannot predict the costs, if any, of compliance or the potential impact on our business. We or our customers could incur increased costs related to the assessment and disclosure of climate-related risks and enhanced climate disclosure requirements could influence stakeholders or lenders to impose more restrictive conditions on investments in carbon intensive sectors.
The adoption and implementation of new or more stringent international, federal or state legislation, regulations or other regulatory initiatives that impose more stringent standards for GHG emissions from the oil and natural gas sector or otherwise restrict the areas in which this sector may produce oil and natural gas or generate the GHG emissions could result in increased costs of compliance or costs of consuming, and thereby reduce demand for oil and natural gas, which could reduce demand for our services. While federal action increasing GHG standards are unlikely under the Trump administration (see discussion of the repeal of the endangerment finding above), international and state governments might seek to fill the void left at the federal level by seeking to regulate GHG. Additionally, political, litigation and financial risks may result in our customers restricting or canceling production activities, incurring liability for infrastructure damages as a result of climatic changes, or impairing their ability to continue to operate in an economic manner, which also could reduce the demand for our services. One or more of these developments could have a material adverse effect on our business, financial condition and results of operation.
Endangered and Threatened Species. Environmental laws such as the Endangered Species Act (“ESA”) and analogous state laws may impact exploration, development and production activities in areas where we operate. The ESA provides broad protection for species of fish, wildlife and plants that are listed as threatened or endangered. Similar protections are offered to migratory birds under the Migratory Bird Treaty Act (“MBTA”) and various state analogs. The U.S. Fish & Wildlife Service (“FWS”) may identify previously unidentified endangered or threatened species or may designate critical habitat and suitable habitat areas that it believes are necessary for survival of a threatened or endangered species. For example, the dunes sagebrush lizard, which is found only in the active and semi-stable shinnery oak dunes of southeastern New Mexico and adjacent portions of Texas (including areas where we and our customers operate), was listed as an endangered species by the FWS on May 20, 2024, although a critical habitat has not yet been designated. FWS has also developed a conservation agreement known as a Candidate Conservation Agreement with Assurances (“CCAA”) that would implement certain protective practices for the species and authorize incidental taking of the species resulting from certain covered activities, including exploration and development of oil and gas fields and excavation and processing of sand. We have joined the CCAA to help mitigate potential impacts on our business in the event that a critical habitat for the dunes sagebrush lizard is designated in the areas in which we operate. To the extent any protections are implemented or increased for certain species or habitat, it could cause us or our customers to incur additional costs or become subject to operating restrictions or operating bans in the affected areas. For more information regarding risks associated with compliance with endangered species laws and regulations, please see our “Risk Factors – Risks Related to Environmental and Regulatory Matters – Additional restrictions on drilling and mining activities intended to protect certain species of wildlife may adversely affect our ability to conduct completion activities or mining operations.”
Regulation of Hydraulic Fracturing and Related Activities. Our hydraulic fracturing operations are a significant component of our business. Hydraulic fracturing is an important and common practice used to stimulate production of hydrocarbons, particularly natural gas, from tight formations, including shales. The process, which involves the injection of water, sand and chemicals under pressure into formations to fracture the surrounding rock and stimulate production, is typically regulated by state oil and natural gas commissions. However, certain federal agencies have increased scrutiny and asserted regulatory authority over certain aspects of hydraulic fracturing. For example, in late 2016, the EPA released a final report on the potential impacts of hydraulic fracturing on drinking water resources, concluding that “water cycle” activities associated with hydraulic fracturing may impact drinking water resources under certain limited circumstances. To date, the EPA has taken no further action in response to the 2016 report. Additionally, hydraulic fracturing is currently generally exempt from federal regulation under the Safe Drinking Water Act Underground Injection Control (the “SDWA UIC”) program. However, legislation to amend the SDWA to repeal this exemption and require federal permitting and regulatory control of hydraulic fracturing, as well as legislative proposals to require disclosure of the chemical constituents of the fluids used in the
fracturing process, have previously been proposed in Congress. The EPA also previously issued a series of rules under the CAA that establish new emission control requirements for certain oil and natural gas production and natural gas processing operations and associated equipment.
In May 2024, the BLM finalized the Public Lands Rule, which increases royalty rates, rentals, and minimum bids, and interprets conservation as a use of federal land on equal footing with other uses. In September 2025, the U.S. Department of the Interior announced its proposal to rescind the Public Lands Rule. As a result, we cannot predict the final scope of regulations or restrictions that may apply to oil and gas operations on federal lands. Further action could be taken to curtail oil and gas development on federal lands. Any restrictions on new or existing production activities on federal land could adversely impact our customers’ operations and consequently reduce demand for our services. The increase in royalties associated with leasing on federal lands, and any future increases that may occur, may adversely impact exploration and production activities on federal lands and reduce demand for our services. Several states and local jurisdictions in which we or our customers operate also have adopted or are considering adopting regulations that could restrict or prohibit hydraulic fracturing in certain circumstances, impose more stringent operating standards and/or require the disclosure of the composition of hydraulic fracturing fluids.
Federal and state governments have also investigated whether the disposal of produced water into underground injection wells has caused increased seismic activity in certain areas. In response to concerns regarding induced seismicity, regulators in some states, including Oklahoma and Texas, have imposed, or are considering imposing, additional requirements in the permitting of produced water disposal wells or otherwise to assess any relationship between seismicity and the use of such wells. For example, Oklahoma has issued rules for wastewater disposal wells that impose permitting and operating restrictions and reporting requirements on disposal wells in proximity to faults and also, from time to time, has implemented plans directing certain wells where seismic incidents have occurred to restrict or suspend disposal well operations. The Texas Railroad Commission has suspended produced water handling permits and introduced injection volume curtailment within the boundaries of certain seismic response areas.
Increased regulation of hydraulic fracturing and related activities could make it more difficult or costly to perform our fracturing operations. In addition, if hydraulic fracturing is further regulated at the federal or state level, fracturing activities could become subject to additional permitting and financial assurance requirements, more stringent construction specifications, increased monitoring, reporting and record keeping obligations, plugging and abandonment requirements, attendant permitting delays, and potential cost increases. Such legislative changes could cause us to incur substantial compliance costs, and compliance or the consequences of any failure to comply could have a material adverse effect on our financial condition and results of operations.
OSHA Matters. The Occupational Safety and Health Act (“OSHA”) and comparable state statutes regulate the protection of the health and safety of workers. In addition, the OSHA hazard communication standard requires that information be maintained about hazardous materials used or produced in operations and that this information be provided to employees, state and local government authorities and the public. We are also subject to OSHA’s standards for worker exposure to silica, which went into effect on June 23, 2021 for hydraulic fracturing activities. As a result, we or our customers may be required to incur additional costs associated with compliance with these standards, which costs may be material.
Mining Activities. Our sand mining operations are subject to the oversight of the U.S. Mine Safety and Health Administration (“MSHA”), which is administered by the Department of Labor (“DOL”) and is the primary regulatory agency with jurisdiction over the commercial silica industry. In June 2022, the MSHA launched a new enforcement initiative to better protect miners in the United States from health hazards resulting from repeated overexposure to respirable crystalline silica. MSHA also administers and enforces the provisions of the Federal Mine Safety and Health Act of 1977, as amended by the Mine Improvement and New Emergency Response Act of 2006, which imposes stringent health and safety standards on numerous aspects of our operations inclusive of mineral extraction and processing operations, transportation and transloading of silica and delivery of silica sand to well sites. These standards include, among others, the training of personnel, operating procedures, operating and safety equipment, and other matters. As part of MSHA’s oversight, its representatives must perform at least two unannounced inspections annually for each surface mining facility in its jurisdiction. In April 2024, the DOL issued a final rule amending its existing standards and setting a permissible exposure limit of respirable crystalline silica and including other requirements to protect miner health, such as exposure sampling, corrective actions to be taken when miner exposure exceeds the permissible exposure limit, and medical surveillance for miners.
Environmental Reviews. If permits or other authorizations from the federal government are required, our future operations may be subject to broad environmental review under the National Environmental Policy Act (“NEPA”). NEPA requires federal agencies to evaluate the environmental impact of all “major federal actions” significantly affecting the quality of the human environment. The granting of a federal permit for a major development project, such as a proppant production operations, may be considered a “major federal action” that requires review under NEPA. As part of this evaluation, the federal agency considers a broad array of environmental impacts, including, among other things, impacts on air quality, water quality, wildlife (including threatened and endangered species), historic and archeological resources, geology,
socioeconomics and aesthetics. NEPA also requires the consideration of alternatives to the project. The NEPA review process, especially the preparation of a full environmental impact statement, can be time consuming and expensive. The purpose of the NEPA review process is to inform federal agencies’ decision-making on whether federal approval should be granted for a project and to provide the public with an opportunity to comment on the environmental impacts of a proposed project. Though NEPA requires only that an environmental evaluation be conducted and does not mandate a particular result, a federal agency could decide to deny a permit or impose certain conditions on its approval, based on its environmental review under NEPA, or a third party could challenge the adequacy of a NEPA review and thereby delay the issuance of a federal permit or approval, which could have an adverse effect on our business.
Availability of Information
Our website is located at http://www.pfholdingscorp.com. Our Annual Report on Form 10-K, Quarterly Reports on Form 10-Q, Current Reports on Form 8-K and other reports and filings with the SEC are available free of charge on our website as soon as reasonably practicable after the reports are filed with or furnished to the SEC. Information contained on our website is not incorporated into this Annual Report or on our other filings with the SEC. Our filings are also available in hard copy, free of charge, by contacting us at 333 Shops Boulevard, Suite 301, Willow Park, Texas 76087, Attention: Investor Relations, telephone: (254) 776-3722. The SEC also maintains a website (www.sec.gov) that contains reports, proxy and information statements and other information regarding issuers that file electronically with the SEC. Additionally, we make available free of charge on our website:
•our Code of Business Conduct (including our Code of Ethics for Senior Executive Officers);
•our Corporate Governance Guidelines; and
•the charters of our Audit and Compensation Committees.
Item 1A. Risk Factors.
We face various risks and uncertainties in the industry in which we operate and in the course of our business. Investors in our securities should carefully consider the following risk factors and all of the other information set forth or incorporated into this Annual Report. Additional risks and uncertainties not currently known to us, or that we currently deem immaterial, may also adversely affect our business, financial condition, results of operations, or cash flows.
Risks Related to our Business
Our business and financial performance depends on the level of capital spending by oil and gas companies operating within the areas we service.
Demand for our services depends on the level of capital expenditures in the United States by companies in the oil and natural gas industry. A prolonged reduction in oil and gas prices would generally depress the level of oil and natural gas exploration, development, production, and well completion activity and would result in a corresponding decline in the demand for the hydraulic fracturing services that we provide. If prices decline, similar declines in our customers’ spending would have an adverse effect on our revenue.
Numerous factors beyond our control affect our customers’ decisions regarding their level of exploration and production activity at any given time and, therefore, have an impact on the level of demand for our services at such time, including:
•changes in U.S. energy policy;
•the global supply of, and demand for, oil and natural gas;
•the cost of exploring for, developing, producing and delivering oil and natural gas;
•the supply of and demand for drilling and hydraulic fracturing equipment;
•the expected decline of rates of current oil and gas production;
•the uncertainty in capital and commodities markets and the ability of oil and gas producers to access capital;
•any actual or perceived difficulty or inability to acquire or maintain necessary permits or mining or water rights;
•the social, political and economic conditions in oil and natural gas producing countries and regions, including developments related to the ongoing wars between Russia and Ukraine and conflicts in the Middle East, as well as the instability in Venezuela;
•the level of consumer acceptance of and demand for fossil fuel products;
•negative shifts in investor sentiment of the oil and gas industry;
•contractions in the credit market;
•the strength or weakness of the U.S. dollar;
•inflationary factors, such as increases in the labor costs, material costs and overhead costs;
•the availability of pipeline and other transportation capacity;
•the levels of oil and natural gas storage;
•any adverse weather conditions or natural disasters;
•any technological advances affecting energy consumption;
•the price and availability of alternative fuels and energy sources;
•merger and divestiture activity among oil and natural gas producers, including consolidation activity that may
eliminate some of our customers or increase their leverage in negotiations with us;
•competition among oilfield service and equipment providers;
•changes in transportation regulations that result in increased costs or administrative burdens; and
•overall domestic and global economic conditions.
These factors, together with the historical tendency of oil and gas companies to increase production in response to price increases, which typically leads to overproduction and a collapse in prices, have often contributed to the volatility of the energy markets and the cyclical nature of the energy business.
Our business depends upon our ability to obtain specialized equipment, parts and key raw materials from third-party suppliers, and we may be vulnerable to delayed deliveries and future price increases.
While we operate a vertically integrated business, each of our segments relies on specialized equipment, parts and raw materials supplied by third parties and affiliates. At times during the commodity price cycle, there is a high demand for hydraulic fracturing and other oilfield services and extended lead times to obtain equipment and raw materials needed to provide stimulation services. Similarly, our manufacturing business relies on a limited number of suppliers for major equipment to build our new electric-powered hydraulic fracturing fleets utilizing Clean Fleet® technology.
Should our current suppliers be unable or unwilling to provide the necessary equipment, parts or raw materials or otherwise fail to deliver the products timely and in the quantities required, any resulting delays in the provision of our services, or in the time needed to upgrade our fleet, could have a material adverse effect on our business, financial condition, results of operations and cash flows.
In addition, future price increases for the equipment, parts and raw materials we purchase from others could negatively impact our ability to update or expand our existing fleets, to timely repair equipment in our existing fleets or meet the demands of our customers.
Our reliance upon a few large customers may adversely affect our revenue and operating results.
The majority of our revenue is generated from the provision of hydraulic fracturing services to a discrete number of recurring customers. During the fiscal years ended on December 31, 2025, 2024 and 2023, our top ten customers represented 45%, 37% and 41% of our consolidated revenues, respectively.
It is likely that we will depend on a relatively small number of customers for a significant portion of our revenue in the future. If a major customer fails to pay us, cash flow from operations would be impacted and our operating results and financial condition could be harmed. Additionally, if we were to lose any material customer, we may not be able to redeploy our equipment at similar utilization or pricing levels and such loss could have an adverse effect on our business until the equipment is redeployed at similar utilization or pricing levels.
As a vertically integrated company, our Proppant Production segment and power generation business make significant intercompany sales to our Stimulation Services segment and could be adversely affected if our Stimulation Services segment fails to perform as expected.
Oil and natural gas companies’ operations using hydraulic fracturing are substantially dependent on the availability of water, as are our frac sand mining and processing operations. Restrictions on the ability to obtain water and the disposal of flowback and produced water may impact their and our operations and have a corresponding adverse effect on our business, results of operations and financial condition.
Water is an essential component of shale oil and natural gas production during both the drilling and hydraulic fracturing processes. Our oil and natural gas producing customers’ access to water to be used in these processes may be adversely affected due to reasons such as periods of extended drought, privatization, third party competition for water in localized areas or the implementation of local or state governmental programs to monitor or restrict the beneficial use of water subject to their jurisdiction for hydraulic fracturing to assure adequate local water supplies. The occurrence of these or similar developments may result in limitations being placed on allocations of water due to needs by third party businesses with more senior contractual or permitting rights to the water. Our customers’ inability to locate or contractually acquire and sustain the receipt of sufficient amounts of water could adversely impact their E&P operations and have a corresponding adverse effect on our business, results of operations and financial condition.
Moreover, the imposition of new environmental regulations and other regulatory initiatives could include increased restrictions on our producing customers’ ability to dispose of flowback and produced water generated by hydraulic fracturing
or other fluids resulting from E&P activities. Applicable laws impose restrictions and strict controls regarding the discharge of pollutants into waters of the United States and require that permits or other approvals be obtained to discharge pollutants to such waters. Additionally, regulations implemented under both federal and state laws prohibit the discharge of produced water and sand, drilling fluids, drill cuttings and certain other substances related to the natural gas and oil industry into coastal waters. These laws provide for civil, criminal and administrative penalties for any unauthorized discharges of pollutants and unauthorized discharges of reportable quantities of oil and hazardous substances. Compliance with current and future environmental regulations and permit requirements governing the withdrawal, storage and use of surface water or groundwater necessary for hydraulic fracturing of wells and any inability to secure transportation and access to disposal wells with sufficient capacity to accept all of our flowback and produced water on economic terms may increase our customers’ operating costs and could result in restrictions, delays, or cancellations of our customers’ operations, the extent of which cannot be predicted.
The frac sand excavation and processing activities in which we engage also require significant amounts of water, of which we seek to recycle a significant percentage in our operating process. As a result, securing water rights and water access to sufficient volumes of water and obtaining water discharge permits where required are necessary for the operation of our processing facilities.
Our frac sand operations are dependent on our rights and ability to mine our properties and on our having received or renewed the required permits and approvals from governmental authorities and other third parties.
We currently hold, and will seek, numerous environmental, mining and other permits from governmental authorities, as well as water rights and approvals authorizing our frac sand operations. For our extraction and processing, the permitting process is governed by federal, state, and local laws and regulations. For example, on the federal level, a Mine Identification Request (MSHA Form 7000-51) must be filed and obtained before mining commences. If wetlands are implicated, a wetlands permit may be required from the Corps. At the federal and state level, a series of permits and approvals are required related to air quality, wetlands, water quality (wastewater and stormwater), grading permits, threatened and endangered species, archaeological assessments and high capacity wells in addition to others depending upon site-specific factors and operational detail. At the local level, mining, zoning, building, stormwater, erosion control, road usage and access, among other matters, may be regulated and require permitting or approval from local governmental authorities. For example, Aggregate Production Operations permits are required for our Texas production facilities and similar permits may be required for our facilities in other states. A decision by a governmental agency or other third party to deny or delay issuing a new or renewed permit or approval, or to revoke or substantially modify an existing permit or approval, could have a material adverse effect on our ability to commence or continue related operations.
Title to, and the area of, mineral properties and water rights may also be disputed. Mineral properties sometimes contain claims or transfer histories that examiners cannot verify. Legal challenges claiming that we do not have title to our property or lack appropriate water rights could cause us to lose any rights to explore, develop and extract minerals without compensation for our prior expenditures relating to such property. Our business may suffer a material adverse effect in the event that any such claims are successful.
In some instances, we have received access rights or easements from third parties, which allow for more efficient operations. Such third party could take legal action to restrict or suspend the access or easement or could refuse to renew such rights or easements upon their contractual expiration, which could be materially adverse to our business, results of operations or financial condition.
Our operations are subject to unforeseen interruptions and hazards inherent in the oil and natural gas industry, for which we may not be adequately insured, and which could cause us to lose customers and substantial revenue.
Our operations are exposed to the risks inherent to our industry, such as equipment defects, vehicle accidents, fires, explosions, blowouts, surface cratering, uncontrollable flows of gas or well fluids, pipe or pipeline failures, abnormally pressured formations and various environmental hazards, such as oil spills and releases of, and exposure to, hazardous substances (including fracturing fluids and chemical additives). In addition, our operations are exposed to potential natural disasters, such as blizzards, tornadoes, storms, floods, other adverse weather conditions and earthquakes. The occurrence of any of these events could result in substantial losses to us due to injury or loss of life, severe damage to or destruction of property, natural resources and equipment, pollution or other environmental damage, clean-up responsibilities, regulatory investigations and penalties or other damage resulting in curtailment or suspension of our operations. The cost of managing such risks may be significant. The frequency and severity of such incidents will affect operating costs, insurability and relationships with customers, employees and regulators.
Our insurance may not be adequate to cover all losses or liabilities we may suffer. Furthermore, we may be unable to maintain or obtain insurance of the type and amount we desire at reasonable rates. As a result of market conditions, premiums and deductibles for certain of our insurance policies have increased and could escalate further. In addition, sub-limits have been imposed for certain risks. In some instances, certain insurance could become unavailable or available only for reduced
amounts of coverage. If we were to incur a significant liability for which we are not fully insured, it could have a material adverse effect on our business, results of operations and financial condition. In addition, we may not be able to secure additional insurance or bonding that might be required by new governmental regulations. This may cause us to restrict our operations, which might severely impact our financial position.
Since hydraulic fracturing activities are part of our operations, they are covered by our insurance against claims made for bodily injury, property damage and clean-up costs stemming from a sudden and accidental pollution event. However, we may not have coverage if we are unaware of the pollution event and unable to report the “occurrence” to our insurance company within the time frame required under our insurance policy. In addition, these policies do not provide coverage for all liabilities, and the insurance coverage may not be adequate to cover claims that may arise, or we may not be able to maintain adequate insurance at rates we consider reasonable. A loss not fully covered by insurance could have a material adverse effect on our financial position, results of operations and cash flows.
We rely on a few key employees whose absence or loss could adversely affect our business.
Many key responsibilities within our business have been assigned to a small number of employees. The loss of their services could adversely affect our business. In particular, the loss of the services of one or more members of our executive team, including our Chief Executive Officer, Executive Chairman, Chief Financial Officer and Chief Legal Officer, could disrupt our operations. We do not maintain “key person” life insurance policies on any of our employees. As a result, we are not insured against any losses resulting from the death of our key employees.
We rely on contractors to conduct a significant portion of our frac sand mining operations.
A significant portion of our frac sand mining operations are currently conducted in whole or in part by contractors, including services from related parties. Contractors provide us mining, wet and dry loading and hauling services at our Kermit, Lamesa, Monahans, San Antonio, and Merryville (when not idled) Sand Mines, and provide us certain related equipment. Wilks Earthworks, LLC (“Earthworks”), an affiliate of the Wilks Parties, provides us those services at our Kermit, Lamesa and San Antonio Sand Mines pursuant to a Master Services Agreement dated effective as of December 1, 2022. The initial term of the agreement expired on December 1, 2024, but it renews automatically for successive one-year terms unless earlier terminated. As a result of these arrangements, our operations are subject to a number of risks, some of which are outside our control and may negatively affect our operations and financial results, including:
•reduced control over those aspects of operations which are the responsibility of the contractor;
•failure of a contractor to perform under its agreement;
•interruption of operations or increased costs in the event that a contractor ceases its business due to insolvency or other unforeseen events;
•failure of a contractor to comply with applicable legal and regulatory requirements, to the extent it is responsible for such compliance;
•problems of a contractor with managing its workforce, labor unrest or other employment issues;
•liability to third parties as a result of the actions of our contractors;
•the inability to replace a contractor and its operating equipment in the event that either party terminates the agreement; and
•negotiating renewal terms or new agreements with contractors on acceptable terms.
Inaccuracies in our estimates of frac sand mineral reserves and resource deposits, or deficiencies in our title to those deposits, could result in our inability to mine the deposits or require us to pay higher than expected costs.
We base our frac sand mineral reserve and resource estimates on engineering, economic and geological data assembled and analyzed by our mining engineers, which are reviewed periodically by outside firms. However, frac sand reserve and resource estimates are necessarily imprecise and depend to some extent on statistical inferences drawn from available drilling data, which may prove unreliable. There are numerous uncertainties inherent in estimating quantities and qualities of frac sand reserves and resources, many of which are beyond our control and any of which could cause actual results to differ materially from our expectations. These uncertainties include:
•geological and mining conditions and/or effects from prior mining that may not be fully identified by available data or that may differ from experience;
•assumptions regarding the effectiveness of our mining, quality control and training programs;
•assumptions concerning future prices of frac sand products, operating costs, mining technology improvements, development costs and reclamation costs; and
•assumptions concerning future effects of regulation, including the issuance of required permits and taxes by governmental agencies.
In addition, title to, and the area of, mineral properties and water rights may also be disputed. Mineral properties sometimes contain claims or transfer histories that examiners cannot verify. A successful claim that we do not have title to one or more
of our properties or lack appropriate water rights could cause us to lose any rights to explore, develop and extract any minerals on that property, without compensation for our prior expenditures relating to such property. Any inaccuracy in our estimates related to our mineral reserves and resource mineral deposits, or our title to such deposits, could result in our inability to mine the deposits or require us to pay higher than expected costs.
Additionally, at our Kermit Sand Mine, a portion of our reserves are located on approximately 630 acres that we lease pursuant to a lease that terminates in 2052 and requires that we commence production from the leased premises by January 1, 2032. If we do not commence mining activities by January 1, 2032, our lease of this property would terminate and we would lose our interest in these reserves.
Our frac sand mining operations are dependent on our rights and ability to mine our properties and on our having received or renewed the required permits and approvals from governmental authorities and other third parties. A decision by a governmental agency or other third party to deny or delay issuing a new or renewed permit or approval, or to revoke or substantially modify an existing permit or approval, could have a material adverse effect on our ability to commence or continue related operations.
In some instances, we have received access rights or easements from third parties, which allow for more efficient operations. Such third party could take legal action to restrict or suspend the access or easement or could refuse to renew such rights or easements upon their contractual expiration, which could be materially adverse to our business, results of operations or financial condition.
We may be subject to claims for personal injury and property damage, which could materially adversely affect our financial condition and results of operations.
We operate with most of our customers under master service agreements (“MSAs”). We endeavor to allocate potential liabilities and risks between the parties in the MSAs. Generally, under our MSAs, including those relating to our hydraulic fracturing services, we assume responsibility for, including control and removal of, pollution or contamination which originates above surface and originates from our equipment or services. Our customer typically assumes responsibility for, including control and removal of, all other pollution or contamination which may occur during operations, including that which may result from seepage or any other uncontrolled flow of drilling fluids occurring below grade. We may have liability in such cases to the extent we were found to be grossly negligent or having committed willful acts. Generally, our customers also agree to indemnify us against claims arising from their employees’ personal injury or death to the extent that, in the case of our hydraulic fracturing operations, their employees are injured or their properties are damaged by such operations, unless resulting from our gross negligence or willful misconduct. Similarly, we generally agree to indemnify our customers for liabilities arising from personal injury to or death of any of our employees, unless resulting from gross negligence or willful misconduct of the customer. In addition, our customers generally agree to indemnify us for loss or destruction of customer-owned property or equipment and in turn, we agree to indemnify our customers for loss or destruction of property or equipment we own. This reciprocal or mirrored indemnity and risk allocation model is known as knock for knock indemnity and is common in oilfield services agreements. Losses due to catastrophic events, such as blowouts, are generally the responsibility of the customer. However, despite this general allocation of risk, we might not succeed in enforcing such contractual allocation, might incur an unforeseen liability falling outside the scope of such allocation or may be required to enter into an MSA with terms that vary from the above allocations of risk. Litigation arising from a catastrophic occurrence at a location where our equipment and services are being used may result in ProFrac being named as a defendant in lawsuits asserting large claims. As a result, we may incur substantial losses which could materially and adversely affect our financial condition and results of operation.
If we are unable to fully protect our intellectual property rights, we may suffer a loss in our competitive advantage or market share.
If we are not able to protect our patents or maintain the confidentiality of our trade secrets, or if our competitors are able to replicate our technology or services, our competitive advantage would be diminished. We also cannot ensure that any patents we currently own or may obtain in the future would provide us with any significant commercial benefit or would allow us to prevent our competitors from employing comparable technologies or processes.
If we fail to respond to our customers’ growing demand for environmentally sensitive equipment, our business will be adversely affected.
As our customers have become more focused on the reductions of their emissions footprint, we have introduced products and services (such as our electric-powered hydraulic fracturing fleets) to meet their needs. As of December 31, 2025, approximately 70% of our pumps rely on electric frac or natural gas burning engine technology (which we consider to be currently the most environmentally friendly available technologies used in our industry). In addition to being less attractive to customers, the legacy portion of our fleet is less efficient, and often requires additional maintenance and capital expenditures to be kept in good operating condition and may, therefore, be subject to longer or more frequent periods of unavailability.
If we fail to upgrade and replace our fleet with the higher efficiency and more environmentally friendly equipment the industry increasingly demands, our competitive position may deteriorate, which may have a material adverse effect on our financial position, results of operations and cash flows.
Our financial results may be materially adversely affected by the inclusion of Flotek’s financial statements in our consolidated financial statements, and we do not have the benefit of Flotek’s cash or liquidity.
Due to our determination that Flotek is a variable interest entity of which ProFrac is the primary beneficiary, Flotek’s financial statements have been included in our consolidated financial statements from May 17, 2022. Consequently, our financial results may be materially adversely affected if Flotek reports poor or worsened financial results. Any delays in Flotek’s reporting of its financial results or material inaccuracies in Flotek’s financial statements could negatively impact ProFrac’s ability to timely or accurately report its financial results. In addition, we do not have the ability to access or deploy Flotek’s cash or liquidity in our operations, which may limit our ability to mitigate the impact of the inclusion of Flotek’s financial statements in our consolidated financial statements.
Risks Related to our Growth Strategy
To achieve our growth and vertical integration objectives, our management relies on a rapid succession of strategic acquisitions, investments and procurement arrangements the pace and scope of which may have the potential to adversely affect the day-to-day operation of our business, and our cash flows, financial condition and results of operations.
Since the beginning of 2022, we have aggressively pursued our growth and vertical integration strategies through a series of acquisitions, investments and procurement arrangements that increased our total assets from $664.6 million at December 31, 2021, to $2.6 billion at the end of fiscal year 2025.
For a company of our size and resources, the rapid pace and volume of deal-making activity may create risks and uncertainties that can have a material adverse effect on the daily conduct of our business, and negatively impact our cash flows, financial condition and results of operations. For example, we are exposed to the risk that the day-to-day management, oversight, and operation of our business and our financial results may be adversely affected by:
•the time and attention spent by our senior management and leadership in the identification and evaluation of prospective strategic initiatives, and the negotiation, funding and closing of those we choose to pursue;
•the time, attention and resources diverted to the integration of acquired businesses;
•the need to secure funding for new acquisitions and strategic investments or transactions;
•the exposure to successor liabilities not sufficiently identified, quantified or understood prior to the closing of a strategic transaction; and
•the potential loss of valuable existing employees or customers as a result of our entering into a strategic transaction with a counterparty with whom they may not wish to continue in an employment or commercial relationship.
In addition, because the historical utilization rates of any acquired assets may be lower than ours, our utilization ratio could decrease during the course of an initial integration period. Accordingly, there can be no assurance the utilization for acquired assets will align with the utilization of our existing fleet or on our anticipated timeline or at all.
We have incurred and may continue to incur substantial indebtedness to finance acquisitions. We have also issued equity and may issue additional equity, or convertible securities in connection with such acquisitions. Debt service requirements could represent a significant burden on our results of operations and financial condition, and the issuance of additional equity or convertible securities could be dilutive to our existing shareholders.
Our growth and vertical integration objectives require substantial capital that we may be unable to obtain, or may only obtain at a cost or under terms that adversely affect our cash flows, financial condition and results of operations.
We have historically financed capital expenditures primarily with cash generated by operations, equipment and vendor financing, and borrowings under our credit facilities and other debt financing. As of the date of this annual report, however, the continued reliability of our traditional sources of funding has to be questioned. Any disruptions or continuing volatility in the global financial markets (including as a result of a potential U.S. government default) may lead to additional increases in interest rates, or to a contraction in credit availability that could impair our ability to finance our operations and acquisitions. In the event our capital expenditure requirements at any time are greater than the amounts then available to us, we may not be able to obtain funding from such alternative sources of capital, and may be required to curtail or eliminate contemplated activities. Even if we can obtain capital from alternative sources, the terms of such fundings may not be favorable to us. In particular, the terms of any debt financing may include covenants that significantly restrict our operations. Our inability to grow as planned may reduce our chances of maintaining and improving profitability.
We may have difficulty managing growth in our business, which could adversely affect our financial condition and results of operations.
Growth in accordance with our business strategy, if achieved, could place a significant strain on our financial, operational and management resources. As we expand the scope of our activities and our geographic coverage through both organic growth and acquisitions, there will be additional demands on our financial, legal, accounting, technical, operational and management resources. For example, in October 2024, Livewire commenced operations as a new line of our business intended to provide onsite power generation services for oilfield and non-oilfield customers that require off-grid power solutions. The failure to continue to upgrade our technical, administrative, operating and financial control systems or the occurrence of unexpected expansion difficulties, including the failure to recruit and retain experienced managers and other professionals, could have a material adverse effect on our business, liquidity positions, financial condition, results of operations and prospects and our ability to successfully or timely execute our business strategy.
We may experience difficulties in integrating acquired assets into our business and in realizing the expected benefits of an acquisition.
The success of an acquisition, if achieved, will depend in part on our ability to realize anticipated business opportunities and benefits from combining the acquired assets with our business in an effective and efficient manner. The integration process could take longer than anticipated and could result in the loss of key employees, the disruption of each company’s ongoing businesses, tax costs or inefficiencies or inconsistencies in standards, controls, information technology systems, procedures and policies, any of which could adversely affect our ability to maintain relationships with customers, employees or third parties or our ability to achieve the anticipated benefits, and could harm our financial performance. If we are unable to successfully or timely integrate acquired assets with our business, we may incur unanticipated liabilities and be unable to realize the anticipated benefits, and our business, results of operations and financial condition could be materially and adversely affected.
Our indebtedness could adversely affect our financial flexibility and competitive position and make us more vulnerable to adverse economic conditions.
As of December 31, 2025, we had outstanding principal indebtedness of $1,048.1 million. See “Note 7. Debt” in the notes to our consolidated financial statements for more details on our debt including the portion of our outstanding principal that matures in the year ending December 31, 2026. Our existing and future indebtedness and limited access to liquidity may adversely affect our operations and limit our growth, and we may have difficulty making debt service payments on such indebtedness as payments become due. Our level of indebtedness may affect our operations in several ways, including:
•increasing our vulnerability to general adverse economic and industry conditions including reduced or volatile customer activity;
•requiring us to dedicate a substantial portion of cash flow from operations to making payments on our indebtedness, thereby reducing the availability of cash flow to fund working capital, acquisitions and capital expenditures;
•restricting us from exploiting business opportunities;
•making it more difficult to satisfy our financial obligations, including payments on our indebtedness;
•placing us at a disadvantage compared to our competitors that have less debt obligations;
•limiting our ability to refinance our current indebtedness or borrow additional funds for working capital, capital expenditures, acquisitions or certain investments or execute on our business strategy; and
•limiting our flexibility in planning for, and reacting to, changes in the economy and in our industry.
In addition, any failure to comply with the financial or other debt covenants could result in an event of default, which could result in some or all of our indebtedness becoming immediately due and payable. That occurrence would substantially and adversely affect our ability to continue operating our business and would severely and adversely affect our cash flows and financial condition and results.
We have and are continuing to undertake initiatives to improve our liquidity. These initiatives may not be as successful as expected and our business may deteriorate further.
Our level of indebtedness and lack of liquidity has adversely affected our financial flexibility and competitive position and made us more vulnerable to adverse economic conditions. We have executed initiatives to optimize our cost structure with a focus on operational efficiency, including reducing our direct and indirect labor costs, reducing our selling, general and administrative expenses by reducing headcount and eliminating certain non-labor related costs, and reducing other operating expenses and capital expenditures. We have also extended the maturity date of our credit agreement by six months to allow time for a full refinancing on more favorable terms, although we may not be able to refinance the credit agreement on favorable terms or at all, in which case it would mature in September 2027.
We may be unable to successfully complete these initiatives or these initiatives, if completed, may not result in the cost savings or liquidity enhancements that we anticipate. Further, our business outlook may continue to deteriorate if our customers continue to reduce activity levels as a result of a depressed commodity price environment or otherwise, and our
results of operations and operating cash flows may correspondingly further decline. As a result, we may need to take other actions to improve our liquidity, which may include selling assets or seeking additional sources of capital. We may not be successful in these efforts, and additional capital may not be available, or if available, may not be on terms acceptable to us.
Restrictions in our debt agreements and any future financing agreements may limit our ability to finance future operations, meet capital needs or capitalize on potential acquisitions and other business opportunities.
Our debt agreements contain, and any future financing agreements we may enter into will likely contain, operating and financial restrictions and covenants that may restrict our ability to finance future operations or capital needs, or to engage in, expand or pursue our business activities. For example, our credit agreements restrict or limit our ability to:
•incur additional indebtedness;
•engage in a merger, consolidation or other fundamental transactions;
•enter into transactions with affiliates, including financings, or amend material agreements;
•sell or otherwise dispose of assets, businesses and operations;
•make acquisitions, investments and capital expenditures; and
•declare and pay distributions and dividends.
Our compliance with these provisions may materially adversely affect our ability to react to changes in market conditions, take advantage of business opportunities we believe to be desirable, obtain future financing, fund needed capital expenditures, finance acquisitions, equipment purchases and development expenditures, or withstand a future downturn in our business.
Furthermore, our debt agreements contain certain other operating and financial covenants. Our ability to comply with the covenants and restrictions contained in our debt agreements may be affected by events beyond our control, including prevailing economic, financial and industry conditions. If market or other economic conditions deteriorate, our ability to comply with these covenants may be impaired.
If we violate any of the restrictions, covenants, ratios or tests in our credit agreements, a significant portion of our indebtedness may become immediately due and payable. We might not have, or be able to obtain, sufficient funds to make these accelerated payments. Any subsequent replacement or amendment of our debt agreements or any new indebtedness could have similar or greater restrictions.
An increase in interest rates would increase the cost of servicing our indebtedness and could reduce our profitability, decrease our liquidity and impact our solvency.
We have exposure to increases in interest rates under certain of our debt agreements, some of which accrue interest at a variable rate. As a result, increases in interest rates could increase the cost of servicing such indebtedness and materially reduce our profitability, financial condition and cash flows.
We may not be able to generate sufficient cash flow to service all of our obligations, including our obligations under our credit and other financing facilities.
Our ability to make payments on and to upsize our current facilities, refinance any of our outstanding indebtedness, obtain additional financing, and to fund planned capital expenditures, strategic transactions and expansion efforts will depend on, among other things, our financial and operating performance, including, our ability to generate cash in the future. This, to a certain extent, is subject to general economic, financial, competitive, legislative, regulatory and other factors that are beyond our control.
Our business may not be able to generate sufficient cash flows from operations and collect our receivables, and there is no assurance that our future cash flows from operations will be sufficient to enable us to make payments due on our current or future indebtedness and to fund our other liquidity needs. If this is the case, we will need to refinance all or a portion of our indebtedness on or before maturity, and we cannot assure that we will be able to refinance any of our indebtedness in a timely manner, on commercially reasonable terms, or at all. We may need to implement one or more alternatives, such as reducing or delaying planned business activities, expenses and capital expenditures, selling assets, restructuring debt, or obtaining additional equity or debt financing. While in the past, we have received financing support from certain of our secured lenders and from affiliates that have allowed for relief of covenants, refinancings and access to capital, such sources are under no obligation to provide new support in the future. These financing strategies may not be executed on satisfactory terms, if at all or on terms that would be advantageous to our stockholders. Our efforts to upsize our current facilities, refinance our indebtedness or obtain additional financing, and to do so on commercially reasonable terms, will depend on, among other things, our financial condition at the time, restrictions in agreements governing our indebtedness, and other factors, including the condition of the financial markets and the markets in which we will compete.
If we are unsuccessful in these efforts, it will have a material adverse effect on our business and financial position and we may choose to pursue a filing under Chapter 11 under the U.S. Bankruptcy Code. Seeking bankruptcy court protection could have a material adverse effect on our business, financial condition, results of operations and liquidity. While a bankruptcy proceeding continues, our senior management would spend substantial time and effort on the reorganization instead of business operations. Bankruptcy court protection also could make it more difficult to retain management and other key personnel necessary to the success and operation of our business. In addition, while we are involved in a bankruptcy proceeding, our customers might lose confidence in our ability to reorganize our business successfully and seek to establish alternative commercial relationships. Because our indebtedness is senior to our common shares in our capital structure, a bankruptcy proceeding could result in a limited recovery, if any, for our shareholders, and would place our shareholders at significant risk of losing all of their investment in our common shares.
As a result of our debt refinancing transaction in December 2023, we are required to segregate collateral associated with Alpine Holding, LLC, PF Proppant Holdings, LLC and their respective subsidiaries and may have limited ability to access or use Alpine’s cash to satisfy our obligations or the obligations of our other subsidiaries. We also have limited ability to provide Alpine with liquidity to satisfy its obligations. See “Note 7. Debt” in the notes to our consolidated financial statements for discussion of our debt financing.
If we do not generate sufficient cash flows from operations, and additional borrowings, refinancings or proceeds of asset sales are not available to us, we may not have sufficient cash to enable us to meet all of our obligations.
Risks Related to Environmental and Regulatory Matters
Our operations and the operations of our customers are subject to environmental, health and safety laws and regulations, and future compliance, claims, and liabilities relating to such matters may have a material adverse effect on our results of operations, financial position or cash flows.
We and our customers are subject to a variety of federal, state and local environmental laws and regulations affecting the hydraulic fracturing and mining and mineral processing industry, including, among others, those relating to employee health and safety, environmental permitting and licensing, plant and wildlife protection, wetlands protection, air and water emissions, greenhouse gas emissions, water pollution, waste management, including the transportation and disposal of waste and other materials, remediation of soil and groundwater contamination, land use, reclamation and restoration of properties, hazardous materials and natural resources. These laws and regulations have imposed, and will continue to impose, numerous obligations on our operations and the operations of our customers, including the acquisition of permits or other approvals to conduct regulated activities, the imposition of restrictions on the types, quantities and concentrations of various substances that may be released into the environment, the incurrence of capital expenditures to mitigate or prevent releases of hazardous materials from our equipment and facilities, and the application of specific health and safety criteria addressing worker protection. Some environmental laws impose substantial penalties for noncompliance, and others, such as CERCLA, impose strict, retroactive and joint and several liability for the remediation of releases of hazardous substances. Liability may be imposed as a result of our conduct that was lawful at the time it occurred or the conduct of, or conditions caused by, prior owners or operators or other third parties without regard to fault or the legality of the conduct at the time. Governmental agencies, citizen organizations, neighboring landowners and other third parties may file claims against us for personal injury or property damage allegedly caused by the release of pollutants into the environment. In addition, any failure by us to comply with applicable laws and regulations may cause governmental authorities to take actions that could adversely impact our operations and financial condition, including:
•assessment of sanctions including administrative, civil or criminal penalties;
•denial, modification, or revocation of permits or other authorizations;
•occurrence of restrictions, delays or cancellations in permitting or development or performance of projects or operations;
•imposition of injunctive obligations or other limitations on our operations, including cessation of operations; and
•requirements to perform site investigatory, remedial, or other corrective actions or the incurrence of capital expenditures.
Costs associated with compliance with these laws, defending against related claims, and any actual liabilities have been and will continue to be significant. Any changes in environmental laws and regulations or re-interpretation of enforcement policies that result in more stringent and costly pollution control equipment and operations, the occurrence of delays in the permitting or performance of projects, or waste handling, storage, transport, disposal, or remediation requirements could have a material adverse effect on our financial position and results of operations.
Changes in laws or government regulations could increase our costs of doing business.
Environmental, health and safety laws and regulations are constantly evolving, and they may change or become more stringent in the future. Current and future claims and liabilities may have a material adverse effect on us because of potential adverse outcomes, defense costs, diversion of management resources, unavailability of insurance coverage and other factors. The ultimate costs of these liabilities are difficult to determine and may exceed any reserves we may have established. If existing environmental, health and safety requirements or enforcement policies change, we may be required to make significant unanticipated capital and operating expenditures.
New and existing regulatory disclosure requirements may implicate our trade secrets and cause us competitive harm if such trade secrets become public.
Many states in which we operate require the disclosure of some or all the chemicals used in our pressure pumping operations. Certain aspects of one or more of these chemicals may be considered proprietary by us or our chemical suppliers. Disclosure of our proprietary chemical information to third parties or to the public, even if inadvertent, could diminish the value of our trade secrets or those of our chemical suppliers and could result in competitive harm to us, which could have an adverse impact on our business, financial condition, prospects and results of operations.
Supply chain issues, tariffs, moratoriums, and increased regulatory requirements on our suppliers may impact the cost and availability of raw materials necessary to our operations.
Our business could be affected by tariffs, moratoriums or increased regulation of other companies in the supply chain, such as sand mining by our proppant suppliers, or our chemical suppliers, which could limit our access to supplies and increase the costs of raw materials. At this time, it is not possible to estimate how these various restrictions could affect our ongoing operations.
Our operations, and those of our customers, are subject to a series of risks arising from climate change, which ultimately may result in increased GHG regulation, decreased demand for fossil fuels, and fewer oil and gas permits and licenses, all of which may affect our operations and profitability.
Climate change continues to attract considerable public and scientific attention. As a result, numerous proposals have been made and are likely to continue to be made at the international, national, regional and state levels of government to monitor and limit emissions of carbon dioxide, methane and other GHGs. These efforts have included significant public investment in zero-carbon energy production and storage, consideration of cap-and-trade programs, carbon taxes, GHG reporting and tracking programs and regulations that directly limit GHG emissions from certain sources. Although, under the current Trump administration, we expect less GHG regulation, the risk of these continued efforts to drive down carbon emissions may result in reduced business opportunities and profitability.
As a result of increased attention to combating climate change, various governmental and non-governmental groups have pledged to achieve reductions to GHG emissions. One development in this area, under the 2022 Inflation Reduction Act, involves significant investment over the next 10 years into solar and wind energy production and battery storage infrastructure in an effort to reduce U.S. GHGs to about 40 percent lower than 2005 levels by 2030. Such significant public investment in non-fossil fuel energy production may reduce demand for traditional fossil fuel electricity production which could negatively impact prices of natural gas and profitability of our operations.
The regulation of methane from oil and gas facilities stands to become more lenient under the current federal administration. The EPA already imposes limitations on methane emissions from new sources in the oil and gas sector through NSPS and the EPA’s final rule, announced on December 2, 2023, reduces emissions of methane and other air pollutants from both new and existing oil and natural gas operations and provides emissions guidelines for states to follow in designing and executing implementation plans to cover existing sources. Such regulation of methane emission for new sources and the promulgation of further requirements for existing oil and gas customers could result in increased operational costs and adversely affect demand for our products and services. The regulations are likely to be reevaluated under the current Trump administration and subject to legal challenges. The complete impacts of these pledges, investments, agreements, and the legislation or regulation promulgated to fulfill the United States’ commitments to reduce GHG emissions, cannot be predicted at this time. Additionally, we cannot predict any future reductions and restrictions beyond what is currently proposed.
Litigation risks are also increasing as a number of entities have sought to bring suit against various oil and natural gas companies in state or federal court, alleging among other things, that such companies created public nuisances by producing fuels that contributed to climate change or alleging that the companies have been aware of the adverse effects of climate change for some time but defrauded their investors or customers by failing to adequately disclose those impacts. Such litigation against our customers could reduce the demand for our products and services, which could have a material adverse effect on our business, financial condition and results of operation.
There are also increasing financial risks for fossil fuel producers as shareholders currently invested in fossil-fuel energy companies may elect in the future to shift some or all of their investments into non-fossil fuel related sectors. Institutional lenders who provide financing to fossil fuel energy companies also have become more attentive to sustainable lending
practices and some of them may elect not to provide funding for fossil fuel energy companies. There is also a risk that financial institutions will be required to adopt policies that have the effect of reducing the funding provided to the fossil fuel sector. Enhanced climate disclosure requirements could accelerate the trend of certain stakeholders and lenders restricting or seeking more stringent conditions with respect to their investments in certain carbon intensive sectors. Limitation of investments in and financing for fossil fuel energy companies could result in the restriction, delay or cancellation of drilling programs or development or production activities, which could reduce the demand for our services and products and have a material adverse effect on our business, financial condition and results of operation.
Additionally, political, litigation and financial risks may result in our customers restricting or canceling production activities, incurring liability for infrastructure damages as a result of climate change, or impairing their ability to continue to operate in an economic manner, which also could reduce the demand for our services and products. One or more of these developments could have a material adverse effect on our business, financial condition and results of operation.
Finally, many scientists have concluded that increasing concentrations of GHG in the atmosphere may have significant physical climate effects, such as increased frequency and severity of storms, droughts, and floods and other climate events that could have an adverse effect on our and our customers’ operations.
Federal, state, and local legislative and regulatory initiatives relating to hydraulic fracturing, as well as governmental reviews and investment practices for such activities, may serve to limit future oil and natural gas E&P activities and could have a material adverse effect on our results of operations and business.
Various federal, state and local legislative and regulatory initiatives have been, or could be undertaken which could result in additional requirements or restrictions being imposed on hydraulic fracturing operations. As discussed above, hydraulic fracturing is generally exempt from federal regulation under the SDWA UIC program and is typically regulated by state oil and gas commissions or similar agencies. However, certain federal agencies have increased scrutiny and regulation. Increased federal regulation of fracking operations would likely lead to increased compliance costs and a higher probability of enforcement actions and litigation.
Many states and local governments have also adopted regulations that impose more stringent permitting, disclosure, disposal and well-construction requirements on hydraulic fracturing operations, including states where we or our customers operate, such as Texas, Colorado and North Dakota. States could also elect to place prohibitions on hydraulic fracturing, as several states have already done. In addition, some states have adopted broader sets of requirements related to oil and gas development more generally that could impact hydraulic fracturing activities. Separately, state and federal regulatory agencies have at times focused on a possible connection between hydraulic fracturing related activities, including the underground injection of wastewater into disposal wells, and the increased occurrence of seismic activity. Regulators in some states have imposed, or are considering imposing, additional requirements in the permitting of produced water disposal wells or otherwise to assess any relationship between seismicity and the use of such wells. To the extent any new regulations are adopted to restrict hydraulic fracturing activities or the disposal of fluids associated with such activities, it may adversely affect our customers and, as a result, demand for our services.
Increased regulation and attention given to the hydraulic fracturing process could lead to greater opposition to, and litigation concerning, oil and natural gas production activities using hydraulic fracturing techniques. Additional legislation or regulation could also lead to operational delays for our customers or increased operating costs in the production of oil and natural gas, including from the developing shale plays, or could make it more difficult for us and our customers to perform hydraulic fracturing. The adoption of any additional laws or regulations regarding hydraulic fracturing or further restrictions on the availability of capital for hydraulic fracturing could potentially cause a decrease in the completion of new oil and natural gas wells and an associated decrease in demand for our services and increased compliance costs and time. Such a decrease could have a material adverse effect on our liquidity, consolidated results of operations, and consolidated financial condition. Moreover, as discussed above, the increased competitiveness and investment into non-fossil fuel energy sources (such as wind, solar, geothermal, hydrogen, tidal, battery storage technologies, and biofuels) or increased focus on reducing the use of combustion engines in transportation (such as governmental mandates that ban the sale of new gasoline-powered automobiles) could reduce demand for hydrocarbon fuels and our services, which would lead to a reduction in our revenues.
Oilfield anti-indemnity provisions enacted by many states may restrict or prohibit a party’s indemnification of us.
We typically enter into agreements with our customers governing the provision of our services, which usually include certain indemnification provisions for losses resulting from operations. Such agreements may require each party to indemnify the other against certain claims regardless of the negligence or other fault of the indemnified party; however, many states place limitations on contractual indemnity agreements, particularly agreements that indemnify a party against the consequences of its own negligence. Furthermore, certain states, including Louisiana, New Mexico, Texas, and Wyoming, have enacted statutes generally referred to as “oilfield anti-indemnity acts” expressly prohibiting certain indemnity agreements contained in or related to oilfield services agreements. Such oilfield anti-indemnity acts may restrict or void a party’s indemnification of us, which could have a material adverse effect on our business, financial condition, prospects, and results of operations.
Conservation measures, commercial development and technological advances could reduce demand for oil and natural gas and our services.
Fuel conservation measures, alternative fuel requirements, increasing consumer demand for alternatives to oil and natural gas, technological advances in fuel economy and energy generation devices could reduce demand for oil and natural gas, resulting in reduced demand for oilfield services. For example, the US Consumer Product Safety Commission has raised concerns about the potential for certain indoor gas appliances to emit harmful quantities of certain air pollutants. The impact of the changing demand for oil and natural gas services and products, and proposed laws and regulations, may have a material adverse effect on our business, financial condition, results of operations and cash flows.
The commercial development of economically viable non-fossil fuel energy sources and related products (such as electric vehicles, wind, solar, geothermal, tidal, fuel cells and biofuels) could have a similar effect. In addition, certain U.S. federal income tax deductions currently available with respect to oil and natural gas exploration and development, including the allowance of percentage depletion for oil and natural gas properties, may be eliminated by proposed legislation. Any future decreases in the rate at which oil and natural gas reserves are discovered or developed, whether due to the passage of legislation, increased governmental regulation leading to limitations, or prohibitions on exploration and drilling activity, including hydraulic fracturing, or other factors, could reduce demand for our products and services and have a material adverse effect on our business and financial condition, even in a stronger oil and natural gas price environment.
Additional restrictions on drilling and mining activities intended to protect certain species of wildlife may adversely affect our ability to conduct completion activities or mining operations.
In the United States, the ESA restricts activities that may affect endangered or threatened species or their habitats and similar protections are offered to migratory birds under the MBTA and other federal and state statutes. To the extent species that are listed and protected under the ESA or similar state laws, or under the MBTA, inhabit the areas where we or our customers operate, our operations and the operations of our customers could be adversely impacted. Moreover, drilling and mining activities may be delayed, restricted or precluded in protected habitat areas or during certain seasons, such as breeding and nesting seasons. The listing of new species under the ESA or the designation of previously unidentified species in the areas where we or our customers operate similarly has the potential to adversely impact our operations and the operations of our customers, including by causing our operations to become subject to operating restrictions or bans and limiting future development activity in affected areas. Changes to existing rules could increase the portion of our or our customers’ operating areas that could be designated as critical habitat. Such new species designations or more restrictive rules could materially restrict use of or access to federal, state and private lands.
For example, since May 20, 2024, the dunes sagebrush lizard, which is found only in the active and semi-stable shinnery oak dunes of southeastern New Mexico and adjacent portions of Texas (including areas where we and our customers operate), has been listed as endangered under the ESA. In the final rule, FWS determined that designating the dunes sagebrush lizard critical habitat was prudent, but not determinable at the time of issuance, thus triggering a one-year review period for the future designation of critical habitat. Legal challenges have been filed relating to the listing, and we cannot predict what actions, if any, the current Trump administration may take relating to the listing of the dunes sagebrush lizard as endangered. As discussed above, the decision to list the dunes sagebrush lizard as endangered could subject us and our customers to operating restrictions and/or limit areas of our current or future operations in any area that is later designated as a critical habitat. At this time, the effects of such designation on our or our customers’ operations or the operations of our peers are likewise uncertain.
Silica-related health issues and legislation, including compliance with existing or future regulations relating to respirable crystalline silica, or litigation could have an adverse effect on our business, reputation or results of operations.
We are subject to laws and regulations relating to human exposure to crystalline silica. For example, OSHA has implemented rules establishing a more stringent permissible exposure limit for exposure to respirable crystalline silica and provided other provisions to protect employees. These rules require compliance with engineering control obligations to limit exposures to respirable crystalline silica in connection with hydraulic fracturing activities. In June 2022, the DOL’s MSHA launched a new enforcement initiative to better protect U.S. miners from health hazards resulting from repeated overexposure to respirable crystalline silica. MSHA reports that silica dust affects thousands of miners each year and, without adequate protection, miners face risks of serious illnesses, many of which can be fatal. In April 2024, MSHA issued a final rule amending its existing standards and setting a permissible exposure limit of respirable crystalline silica.
As part of the DOL’s program, MSHA will conduct silica dust-related mine inspections and expand silica sampling at mines, while providing mine operators with compliance assistance and best practices to limit miners’ exposure to silica dust.
Specifically, the silica enforcement initiative includes:
•Spot inspections at mines with a history of repeated silica overexposures to closely monitor and evaluate health and safety conditions.
•Increased oversight and enforcement of known silica hazards at mines with previous citations for exposing miners to silica dust levels over the existing permissible exposure limit of 100 micrograms per cubic meter of air (μg/m3). For mines where the operator has not timely abated hazards, MSHA will issue a withdrawal order until the silica overexposure hazard has been abated.
•Expanded silica sampling at mines to ensure inspectors’ samples represent the mines, commodities and occupations known to have the highest risk for overexposure.
•A focus on sampling during periods of the mining process that present the highest risk of silica exposure for miners.
•Reminding miners about their rights to report hazardous health conditions, including any attempt to tamper with the sampling process.
In addition, the DOL’s Educational Field and Small Mine Services staff will provide compliance assistance and outreach to mine operators, unions and other mining community organizations to promote and advance protections for miners. The MSHA initiative is intended to take immediate action to reduce the risks of silica dust exposure as the DOL’s development of a mining industry standard continues.
If we are unable to satisfy these obligations, or are not able to do so in a manner that is cost effective or attractive to our customers, our business operations may be adversely affected or availability or demand for our frac sand could be significantly affected. Federal and state regulatory authorities, including OSHA, MSHA and analogous state agencies, may continue to propose changes in their regulations regarding workplace exposure to crystalline silica, such as permissible exposure limits and required controls and personal protective equipment, and we can provide no assurance that we will be able to comply with any future laws and regulations relating to exposure to crystalline silica that are adopted, or that costs of complying with such future laws and regulations would not have an adverse effect on our operating results by requiring us to modify or cease our operations.
In addition, the inhalation of respirable crystalline silica is associated with health risks, including the lung disease silicosis. There is evidence of an association between crystalline silica exposure or silicosis and lung cancer and possible association with other diseases, including immune system disorders such as scleroderma. These health risks have been, and may continue to be, a significant issue confronting the hydraulic fracturing industry. Concerns over silicosis and other potential adverse health effects, as well as concerns regarding potential liability from the use of frac sand, may have the effect of discouraging our customers’ use of frac sand. The actual or perceived health risks of handling frac sand could adversely affect hydraulic fracturing service providers, including us, through reduced use of frac sand, the threat of product liability or employee lawsuits naming us as a defendant, increased scrutiny by federal, state and local regulatory authorities of us and our customers or reduced financing sources available to the hydraulic fracturing industry.
Over the past few decades, a number of companies that utilize silica in their operations have been named as a defendant, usually among many defendants, in product liability lawsuits brought by or on behalf of current or former employees or customers alleging damages caused by silica exposure. The silica-related litigation brought against us to date, and associated litigation costs, settlements and verdicts, have not resulted in a material liability to us, and we presently maintain insurance policies where available. However, we may continue to have silica exposure claims filed against us in the future, including claims that allege silica exposure for periods or in areas not covered by insurance, and the costs, outcome and impact to us of any pending or future claims is not certain. Any such pending or future claims or inadequacies of our insurance coverage could have a material adverse effect on our business, reputation, financial condition and results of operations.
Risks Related to our Corporate Structure and our Class A Common Stock
The Issuer is a holding company and its only material asset is its equity interest in ProFrac LLC; accordingly the Issuer is entirely dependent upon distributions from ProFrac LLC to meet its obligations, including the payment of taxes and covering its corporate and other overhead expenses.
The Issuer, ProFrac Holding Corp., is a holding company that has no material assets other than its equity interest in ProFrac LLC and, accordingly, has no independent means of generating revenue. To the extent ProFrac LLC has available cash, it is required to make (i) generally pro rata distributions to the holders of Units, including the Issuer, in an amount at least sufficient to allow the Issuer to pay its taxes (and those of its wholly owned subsidiaries) and to make payments under the Tax Receivable Agreement and any subsequent tax receivable agreement that it may enter into in connection with future acquisitions and (ii) non-pro rata payments to the Issuer to reimburse it for its corporate and other overhead expenses. If the Issuer needs funds, and ProFrac LLC or its subsidiaries are unable to provide such funds, or are restricted from doing so by applicable law or regulation or by the terms of any current or future financing arrangements, there is no assurance that the Issuer will be able to secure funds from other sources.
ProFrac Holding Corp.’s ability to make tax payments and payments under the Tax Receivable Agreement will be dependent on the ability of ProFrac LLC to make distributions to ProFrac Holding Corp. in an amount sufficient to cover ProFrac Holding Corp.’s tax obligations (and those of its wholly owned subsidiaries) and obligations under the Tax Receivable
Agreement. This ability, in turn, may depend on the ability of ProFrac LLC’s subsidiaries to make distributions to it. We intend that such distributions from ProFrac LLC and its subsidiaries be funded with cash from operations or from future borrowings. The ability of ProFrac LLC, its subsidiaries and other entities in which it directly or indirectly holds an equity interest to make distributions is subject to, among other things, (i) the applicable provisions of Texas law (or other applicable jurisdiction) that may limit the amount of funds available for distribution and (ii) restrictions in relevant debt instruments issued by ProFrac LLC or its subsidiaries and other entities in which it directly or indirectly holds an equity interest. To the extent that ProFrac Holding Corp. is unable to make payments under the Tax Receivable Agreement for any reason, such payments will be deferred and will accrue interest until paid.
Conflicts of interest could arise between us, on the one hand, and Dan Wilks and Farris Wilks and entities owned by or affiliated with them and certain individuals affiliated with such entities (collectively, the “Wilks Parties”), on the other hand, concerning among other things, business transactions, competitive business activities or business opportunities.
Conflicts of interest could arise between us, on the one hand, and the Wilks Parties, on the other hand, concerning among other things, business transactions, competitive business activities or business opportunities. The Wilks Parties operate in the energy and oilfield services industries. In the normal course of business, we have engaged in transactions with some of these companies. Furthermore, the Wilks Parties now, and in the future may, directly or indirectly, compete with us for investment or business opportunities.
The Wilks Parties are not restricted from owning assets or engaging in businesses that compete directly or indirectly with us and do not have any duty to refrain from engaging, directly or indirectly, in the same or similar business activities or lines of business as us, including those business activities or lines of business deemed to be competing with us, or doing business with any of our clients, customers or vendors.
The Wilks Parties may become aware, from time to time, of certain business opportunities (such as acquisition opportunities) and may direct such opportunities to other businesses in which they have invested, in which case we may not become aware of or otherwise have the ability to pursue such opportunities. In addition, the Wilks Parties may dispose of their interests in energy or other oilfield services companies or other assets in the future, without any obligation to offer us the opportunity to purchase any of those interests or assets.
In any of these matters, the interests of Dan Wilks, Farris Wilks and their affiliates and other business owned by or affiliated with them may differ or conflict with the interests of our other shareholders. Any actual or perceived conflicts of interest with respect to the foregoing could have an adverse impact on the trading price of our Class A Common Stock.
The requirements of being a public company, including compliance with the reporting requirements of the Exchange Act and the requirements of the Sarbanes-Oxley Act of 2002 (“Sarbanes-Oxley”), may strain our resources, increase our costs and distract management, and we may be unable to comply with these requirements in a timely or cost-effective manner.
As a public company, we are required to comply with laws, regulations and requirements, including certain corporate governance provisions of Sarbanes-Oxley, and regulations of the Securities and Exchange Commission (“SEC”) and the requirements of Nasdaq. Complying with these statutes, regulations and requirements has and will continue to occupy a significant amount of time of our board of directors and management and significantly increase our costs and expenses. We are required to:
•maintain a comprehensive compliance function;
•comply with rules promulgated by Nasdaq;
•continue to prepare and distribute periodic public reports in compliance with our obligations under the federal securities laws;
•establish, maintain and update various internal policies, such as those relating to insider trading; and
•involve and retain to a greater degree outside counsel and accountants in the above activities.
Section 404 of Sarbanes-Oxley requires that our management assess the effectiveness of our internal control over financial reporting, and our independent registered public accounting firm issue an attestation report on those internal controls. Compliance with these provisions is onerous, and there is no assurance that we will continue to meet the applicable legal requirements of Section 404 of Sarbanes-Oxley, or that we or our independent registered public accounting firm will not identify material weaknesses in our internal control over financial reporting. If we fail to comply with the requirements of Section 404 or if we or our independent registered public accounting firm identify and report such material weaknesses, the accuracy and timeliness of the filing of our annual and quarterly reports may be materially adversely affected and could cause investors to lose confidence in our reported financial information, which could have a negative effect on the price of our Class A Common Stock. In addition, a material weakness in the effectiveness of our internal control over financial reporting could result in an increased chance of fraud and the loss of customers, reduce our ability to obtain financing and require additional expenditures to comply with these requirements, each of which could have a material adverse effect on our business, results of operations and financial condition.
The market price of our Class A Common Stock may be volatile, and your investment in our stock could suffer a decline in value.
The market price of our Class A Common Stock could vary significantly as a result of a number of factors, some of which are beyond ProFrac’s control.
The following is a non-exhaustive list of factors that could affect our stock price:
•our operating and financial performance;
•quarterly variations in our financial and operating results;
•the public reaction to our press releases, our other public announcements and our filings with the SEC;
•strategic actions by our competitors;
•our failure to meet revenue or earnings estimates by research analysts or other investors;
•changes in revenue or earnings estimates, or changes in recommendations or withdrawal of research coverage, by equity research analysts;
•speculation in the press or investment community;
•the failure of research analysts to cover our common stock;
•sales of our Class A Common Stock by ProFrac or other shareholders, or issuances of additional shares of our Class A Common Stock, or the perception that such sales or issuance may occur;
•changes in accounting principles, policies, guidance, interpretations or standards;
•additions or departures of key management personnel;
•actions by our stockholders;
•general market conditions, including fluctuations in commodity prices;
•domestic and international economic, legal and regulatory factors unrelated to our performance; and
•the realization of any risks described under this “Risk Factors” section.
The stock markets in general have experienced extreme volatility that has often been unrelated to the operating performance of particular companies. These broad market fluctuations may adversely affect the trading price of our Class A Common Stock. Securities class action litigation has often been instituted against companies following periods of volatility in the overall market and in the market price of a company’s securities. Such litigation, if instituted against us, could result in very substantial costs, divert our management’s attention and resources and materially harm our business, operating results and financial condition.
The current market price of our securities may not be indicative of future market prices or intrinsic value, and we may not be able to sustain or increase the value of an investment in our securities. Investors in our securities may experience a decrease, which could be substantial, in the value of their securities, including decreases unrelated to our operating performance, financial results or prospects. Your only opportunity to achieve a return on your investment in our securities may be if the market price of our securities appreciates and you sell your securities at a profit. The market price for our securities may never exceed, and may fall below, the price that you paid for such securities. You could lose all or part of your investment in us as a result.
The Wilks Parties have the ability to direct the voting of a majority of our voting stock, and their interests may conflict with those of our other stockholders.
As of December 31, 2025, the Wilks Parties controlled approximately 82.1% of our total voting power. As a result, the Wilks Parties are able to control matters requiring stockholder approval, including the election of directors, changes to our organizational documents and significant corporate transactions. This concentration of ownership makes it unlikely that any other holder or group of holders of our Class A Common Stock will be able to affect the way we are managed or the direction of our business. The interests of the Wilks Parties with respect to matters potentially or actually involving or affecting us, such as future acquisitions, financings and other corporate opportunities and attempts to acquire us, may conflict with the interests of our other stockholders.
For example, the Wilks Parties may have different tax and other positions from us, especially in light of the Tax Receivable Agreement, that could influence their decisions regarding whether and when to support the disposition of assets, the incurrence or refinancing of new or existing indebtedness, or the termination of the Tax Receivable Agreement and acceleration of our obligations thereunder. Certain Wilks Parties hold all of our Series A Preferred Stock, which could cause their interests to differ. In addition, the determination of future tax reporting positions, the structuring of future transactions and the handling of any challenge by any taxing authority to our tax reporting positions may take into consideration tax or other considerations of the Wilks Parties which may differ from the considerations of us or our other stockholders.
Furthermore, in connection with our IPO, ProFrac entered into a Stockholders’ Agreement, dated as of May 17, 2022, with certain of the Wilks Parties (as amended on January 13, 2023, the “ProFrac Stockholders’ Agreement”), which addresses the right to designate nominees for election to the ProFrac board of directors. The existence of significant stockholders may have the effect of deterring hostile takeovers, delaying or preventing changes in control or changes in management, or limiting the ability of ProFrac’s other stockholders to approve transactions that they may deem to be in the best interests of ProFrac. Moreover, the Wilks Parties’ concentration of stock ownership may adversely affect the trading price of ProFrac Class A Common Stock to the extent investors perceive a disadvantage in owning stock of a company with significant stockholders.
A significant reduction by the Wilks Parties of their ownership interests in ProFrac could adversely affect us.
We believe that the Wilks Parties’ substantial ownership interest in ProFrac provides them with an economic incentive to assist us to be successful. However, the Wilks Parties may elect at any time to sell all or a substantial portion of or otherwise reduce their ownership interest in us. If the Wilks Parties sell all or a substantial portion of their ownership interests in us, they may have less incentive to assist in our success. Such actions could adversely affect our ability to successfully implement our business strategies which could adversely affect our cash flows or results of operations.
The issuance of Class A Common Stock upon the conversion of the Series A Preferred Stock may cause dilution to our existing stockholders.
Our Series A Preferred Stock is convertible into our Class A Common Stock at a conversion ratio that is the quotient of: (i) the liquidation preference as of the date of the conversion and (ii) the then applicable conversion price (which is initially set at $20.00, but may be adjusted from time to time, in accordance with the terms of the Series A Certificate of Designation). It is likely that a larger amount of our Class A Common Stock will be issued the further into the future that our Series A Preferred Stock is converted into our Class A Common Stock. The Series A Preferred Stock is entitled to 8% dividends per annum, paid-in-kind and compounded quarterly on the then outstanding Liquidation Preference (as defined in the Series A Certificate of Designation). See “Note 9. Equity” in the notes to our consolidated financial statements for additional information. We cannot predict when, and how many, shares of our Class A Common Stock shall be issued upon the conversion of the Series A Preferred Stock, or predict or quantify any dilution existing holders of our Class A Common Stock may experience upon such conversion. The conversion of the Series A Preferred Stock into our Class A Common Stock could result in substantial dilution to existing holders of our Class A Common Stock. Holders of our Series A Preferred Stock also have liquidation rights that could affect the residual value of the Class A Common Stock.
Our certificate of incorporation and bylaws, as well as Delaware law, contain provisions that could discourage acquisition bids or merger proposals, which may adversely affect the market price of our Class A Common Stock and could deprive our investors of the opportunity to receive a premium for their shares.
Our certificate of incorporation authorizes our board of directors to issue preferred stock without stockholder approval (other than the approval in certain circumstances of the holders of the Series A Preferred Stock) in one or more series, designate the number of shares constituting any series, and fix the rights, preferences, privileges and restrictions thereof, including dividend rights, voting rights, rights and terms of redemption, redemption price or prices and liquidation preferences of such series. If our board of directors elects to issue preferred stock in addition to the Series A Preferred Stock, it could be more difficult for a third party to acquire us. In addition, some provisions of our certificate of incorporation and bylaws could make it more difficult for a third party to acquire control of us, even if the change of control would be beneficial to our stockholders. These provisions include, for example, the following:
•from and after such time as the parties to the ProFrac Stockholders’ Agreement (including their permitted transferees) cease to beneficially own more than 50% of our then-outstanding shares of common stock (which we refer to as the Trigger Date), dividing our board of directors into three classes of directors, with each class serving staggered three-year terms;
•from and after the Trigger Date, allowing the members of our board of directors designated by the parties to the ProFrac Stockholders’ Agreement to have a majority of the voting power of our board of directors;
•from and after the Trigger Date, and subject to the terms of our ProFrac Stockholders’ Agreement, providing that all vacancies, including newly created directorships, may, except as otherwise required by law or, if applicable, the rights of holders of a series of preferred stock, only be filled by the affirmative vote of a majority of directors then in office, even if less than a quorum (prior to such time, vacancies may also be filled by stockholders holding a majority of the outstanding shares);
•from and after the Trigger Date, permitting any action by stockholders to be taken only at an annual meeting or special meeting rather than by a written consent of the stockholders, subject to the rights of any series of preferred stock with respect to such rights;
•from and after the Trigger Date, permitting special meetings of our stockholders to be called only by our Chief Executive Officer, our Executive Chairman and our board of directors pursuant to a resolution adopted by the affirmative vote of a majority of the total number of authorized directors whether or not there exist any vacancies in previously authorized directorships;
•from and after the Trigger Date, and subject to the rights of the holders of shares of any series of our preferred stock and the terms of our ProFrac Stockholders’ Agreement, requiring the affirmative vote of the holders of at least 66 2/3% in voting power of all then outstanding common stock entitled to vote generally in the election of directors, voting together as a single class, to remove any or all of the directors from office at any time, and directors will be removable only for “cause”;
•prohibiting cumulative voting in the election of directors;
•establishing advance notice provisions for stockholder proposals and nominations for elections to the board of directors to be acted upon at meetings of stockholders; and
•providing that the board of directors is expressly authorized to adopt, or to alter or repeal our bylaws.
In addition, as a Delaware corporation we are governed by the Delaware General Corporation Law (as the same may be amended hereafter, the “DGCL”). In general, Section 203 of the DGCL, an anti-takeover law, prohibits a publicly held Delaware corporation from engaging in a business combination (as defined in Section 203 of the DGCL), such as a merger, with a person or group owning 15% or more of a company’s voting stock, which person or group is considered an interested stockholder under the DGCL, for a period of three years following the date the person became an interested stockholder, unless (with certain exceptions) the business combination or the transaction in which the person became an interested stockholder is approved in a prescribed manner. We have elected in our certificate of incorporation not to be subject to Section 203.
Our certificate of incorporation designates the Court of Chancery of the State of Delaware as the sole and exclusive forum for certain types of actions and proceedings that may be initiated by our stockholders, which could limit our stockholders’ ability to obtain a favorable judicial forum for disputes with us or our directors, officers, employees or agents.
Our certificate of incorporation provides that, unless we consent in writing to the selection of an alternative forum, the Court of Chancery of the State of Delaware, or, if such court does not have subject matter jurisdiction thereof, the federal district court of the State of Delaware, will, to the fullest extent permitted by applicable law, be the sole and exclusive forum for (i) any derivative action, suit or proceeding brought on our behalf, (ii) any action, suit or proceeding asserting a claim of breach of a fiduciary duty owed by any of our current or former directors, officers, employees or stockholders to us or our stockholders, (iii) any action, suit or proceeding asserting a claim arising pursuant to any provision of the Delaware General Corporation Law (the “DGCL”), our certificate of incorporation or our bylaws or as to which the DGCL confers jurisdiction on the Court of Chancery of the State of Delaware, or (iv) any action, suit or proceeding asserting a claim governed by the internal affairs doctrine, in each such case subject to such Court of Chancery having personal jurisdiction over the indispensable parties named as defendants therein. Investors in shares of our capital stock are bound by these provisions which may limit a stockholder’s ability to bring a claim in a judicial forum that it finds favorable for disputes with us or our directors, officers, employees or stockholders, which may discourage such lawsuits against us and such persons. However, these choice of forum limitations do not apply to suits brought to enforce a duty or liability created by the Securities Act or the Exchange Act.
Our amended and restated certificate of incorporation also provides that the federal district courts of the United States will be the exclusive forum for any complaint asserting a cause of action under the Securities Act. Section 22 of the Securities Act creates concurrent jurisdiction for federal and state courts over all suits brought to enforce any duty or liability created by the Securities Act or the rules and regulations thereunder. Accordingly, there is uncertainty as to whether a court would enforce this forum provision providing for exclusive jurisdiction of federal district courts with respect to suits brought to enforce any duty or liability created by the Securities Act. If a court were to find these provisions of our certificate of incorporation inapplicable to, or unenforceable in respect of, one or more of the specified types of actions or proceedings, we may incur additional costs associated with resolving such matters in other jurisdictions, which could adversely affect our business, financial condition or results of operations.
We do not presently anticipate paying cash dividends on our Class A Common Stock and our existing debt agreements, as well as the Series A Certificate of Designation, place restrictions on our ability to do so. Consequently, your only opportunity to achieve a return on your shares of Class A Common Stock is if the price of our Class A Common Stock appreciates.
While we look forward to the opportunity to pay dividends in the future, we do not presently anticipate paying any cash dividends on our Class A Common Stock in the foreseeable future. In addition, our Series A Certificate of Designation and our existing debt agreements place, and we expect our future debt agreements will place, restrictions on our ability to pay cash dividends. Consequently, unless we revise our dividend policy, receive permission from the holders of our Series A Preferred Stock pursuant to the Series A Certificate of Designation, and are released of the provisions in our loan agreements that restrict the payment of dividends, your only opportunity to achieve a return on your investment in us will be if you sell your Class A Common Stock at a price greater than the price that you paid for it. There is no guarantee that the price of our Class A Common Stock that will prevail in the market will ever exceed the amount that you paid for it.
The price of our Class A Common Stock may decline as a result of the large number of shares available for sale.
As of December 31, 2025, we had 180,871,183 shares of our Class A Common Stock outstanding, and approximately 756,173 shares of Class A Common Stock remained available for issuance under our long-term incentive plan. The Wilks Parties owned 148,503,480 shares of our outstanding Class A Common Stock at March 3, 2026. Under the Registration Rights Agreement dated as of May 17, 2022 by and among ProFrac and certain of the Wilks Parties and the Series A Purchase Agreement, the Wilks Parties have registration rights in accordance with which ProFrac must file a registration statement for resale of all the shares of Class A Common Stock and Series A Preferred Stock held by the Wilks Parties. We filed a registration statement, which became effective December 1, 2025, covering all of the Series A Preferred Stock and Class A Common Stock issuable upon conversion of the Series A Preferred Stock. In addition, the price of the Class A Common Stock may decline as a result of the conversion of the outstanding Series A Preferred Stock into Class A Common Stock. All of these shares are subject to the rights of the holders thereof to require ProFrac to file a registration statement for their resale.
The fact that many or all of these unissued shares may become issued and available for resale on very short notice may adversely affect the price at which our Class A Common Stock trades. In addition, we may issue in the future additional shares of our Class A Common Stock, or securities convertible into Class A Common Stock, which may further adversely affect the trading price of our shares and dilute existing shareholders.
ProFrac Holding Corp. is required to make payments under the Tax Receivable Agreement for certain tax benefits that it may claim, and the amounts of such payments could be significant.
We are party to the Tax Receivable Agreement with the TRA Holders. This agreement generally provides for the payment by ProFrac to the TRA Holders of 85% of the net cash savings, if any, in U.S. federal, state and local income tax and franchise tax (computed using simplifying assumptions to address the impact of state and local taxes) that ProFrac actually realizes (or is deemed to realize in certain circumstances) in periods after our IPO as a result of certain increases in tax basis available to ProFrac as a result of acquisitions of Units in connection with the IPO or pursuant to the exercise of the Redemption Right or the Call Right (as such terms are defined in the ProFrac LLC Agreement) and certain benefits attributable to imputed interest. We will retain the benefit of the remaining 15% of any actual net cash tax savings.
The term of the Tax Receivable Agreement will continue until all tax benefits that are subject to the Tax Receivable Agreement have been utilized or expired, unless we experience a change of control (as defined in the Tax Receivable Agreement, which includes certain mergers, asset sales, or other forms of business combinations) or the Tax Receivable Agreement otherwise terminates early (at our election or as a result of our breach or the commencement of bankruptcy or similar proceedings by or against us) and ProFrac makes the termination payments specified in the Tax Receivable Agreement in connection with such change of control or other early termination. In the event that the Tax Receivable Agreement is not terminated, the payments under the Tax Receivable Agreement are anticipated to continue for 15 years after the date of the last redemption of the Units, which occurred in April 2023, see “Item 1. Business – 2023 Significant Events - Redemption of ProFrac LLC Units” for additional information.
The payment obligations under the Tax Receivable Agreement are our obligations and not obligations of ProFrac LLC, and we expect that the payments required to be made under the Tax Receivable Agreement will be substantial. Estimating the amount and timing of payments that may become due under the Tax Receivable Agreement is by its nature imprecise. For purposes of the Tax Receivable Agreement, net cash tax savings generally are calculated by comparing our actual tax liability (determined by using the actual applicable U.S. federal income tax rate and an assumed combined state and local income and franchise tax rate) to the amount we would have been required to pay had we not been able to utilize any of the tax benefits subject to the Tax Receivable Agreement. The actual increases in tax basis covered by the Tax Receivable Agreement, as well as the amount and timing of any payments under the Tax Receivable Agreement, will vary depending on a number of factors, including the amount and timing of taxable income we generate in the future, the U.S. federal income tax rates then applicable, and the portion of our payments under the Tax Receivable Agreement that constitute imputed interest or give rise to depreciable or amortizable tax basis. Any distributions made by ProFrac LLC to ProFrac in order to enable us to make payments under the Tax Receivable Agreement could have an adverse impact on our liquidity.
The payments under the Tax Receivable Agreement are not conditioned upon a TRA Holder having a continued ownership interest in ProFrac or ProFrac LLC. For more information, see “Note 12. Income Taxes” in the notes to our consolidated financial statements for more information.
In certain cases, payments under the Tax Receivable Agreement may be accelerated and/or significantly exceed the actual benefits, if any, we realize in respect of the tax attributes subject to the Tax Receivable Agreement.
If we experience a change of control (as defined under the Tax Receivable Agreement, which includes certain mergers, asset sales and other forms of business combinations) or the Tax Receivable Agreement otherwise terminates early (at our election or as a result of our breach or the commencement of bankruptcy or similar proceedings by or against us), our obligations under the Tax Receivable Agreement would accelerate and we would be required to make an immediate payment equal to the present value of the anticipated future payments to be made by it under the Tax Receivable Agreement (determined by applying a discount rate equal to (i) the greater of (A) 0.25% and (B) the 180-Day Average Secured Overnight Financing Rate (“SOFR”), plus (ii) 150 basis points) and such payment is expected to be substantial. The calculation of anticipated future payments will be based upon certain assumptions and deemed events set forth in the Tax Receivable Agreement, including (i) that we have sufficient taxable income to fully utilize the tax benefits covered by the Tax Receivable Agreement, and (ii) that any Units (other than those held by ProFrac) outstanding on the termination date are deemed to be redeemed on the termination date. Any early termination payment may be made significantly in advance of, and may materially exceed, the actual realization, if any, of the future tax benefits to which the termination payment relates.
If we experience a change of control (as defined under the Tax Receivable Agreement) or the Tax Receivable Agreement otherwise terminates early, our obligations under the Tax Receivable Agreement could have a substantial negative impact on our liquidity and could have the effect of delaying, deferring or preventing certain mergers, asset sales, or other forms of business combinations or changes of control. For example, if we were to experience a change of control or the Tax Receivable Agreement had otherwise been terminated at December 31, 2025, the estimated termination payments could range up to approximately $86 million. The foregoing amount is an estimate and the actual payment could differ materially. There can be no assurance that we will be able to satisfy our obligations under the Tax Receivable Agreement.
In the event that payment obligations under the Tax Receivable Agreement are accelerated in connection with certain mergers, other forms of business combinations or other changes of control, the consideration payable to holders of our Class A Common Stock could be substantially reduced.
If we experience a change of control (as defined under the Tax Receivable Agreement, which includes certain mergers, asset sales and other forms of business combinations), we would be obligated to make a substantial immediate lump-sum payment, and such payment may be significantly in advance of, and may materially exceed, the actual realization, if any, of the future tax benefits to which the payment relates. As a result of this payment obligation, holders of our Class A Common Stock could receive substantially less consideration in connection with a change of control transaction than they would receive in the absence of such obligation. Further, any payment obligations under the Tax Receivable Agreement are not conditioned upon the TRA Holders’ having a continued interest in ProFrac or ProFrac LLC. Accordingly, the TRA Holders’ interests may conflict with those of the holders of our Class A Common Stock.
We will not be reimbursed for any payments made under the Tax Receivable Agreement in the event that any tax benefits are subsequently disallowed.
Payments under the Tax Receivable Agreement will be based on the tax reporting positions that we will determine. The U.S. Internal Revenue Service (“IRS”) or another taxing authority may challenge all or part of the tax basis increases covered by the Tax Receivable Agreement, as well as other related tax positions we take, and a court could sustain such challenge. The TRA Holders will not reimburse us for any payments previously made under the Tax Receivable Agreement if any tax benefits that have given rise to payments under the Tax Receivable Agreement are subsequently disallowed, except that excess payments made to any TRA Holder will be netted against future payments that would otherwise be made to such TRA Holder, if any, after our determination of such excess (which determination may be made a number of years following the initial payment and after future payments have been made). As a result, in such circumstances, we could make payments that are greater than our actual cash tax savings, if any, and we may not be able to recoup those payments, which could materially adversely affect our liquidity.
We may issue preferred stock whose terms could adversely affect the voting power or value of our Class A Common Stock.
Our certificate of incorporation authorizes us to issue, without the approval of our stockholders (other than the approval of the holders of the Series A Preferred Stock in certain circumstances), one or more classes or series of preferred stock in addition to our outstanding Series A Preferred Stock having the designations, preferences, limitations and relative rights, including preferences over our Class A Common Stock respecting dividends and distributions, that our board of directors may determine. The terms of one or more classes or series of preferred stock could adversely impact the voting power or value of our Class A Common Stock. For example, we might grant holders of preferred stock the right to elect some number of our directors in all events or on the happening of specified events or the right to veto specified transactions. Similarly, the repurchase or redemption rights or liquidation preferences we might assign to holders of preferred stock could affect the residual value of our Class A Common Stock, as they have with the currently outstanding Series A Preferred Stock.
If we were deemed to be an investment company under the Investment Company Act of 1940, as amended (the “1940 Act”), applicable restrictions could make it impractical for us to continue our business as contemplated and could have a material adverse effect on our business, financial condition and results of operations.
Under Sections 3(a)(1)(A) and (C) of the 1940 Act, a company generally will be deemed to be an “investment company” for purposes of the 1940 Act if (i) it is, or holds itself out as being, engaged primarily, or proposes to engage primarily, in the business of investing, reinvesting or trading in securities or (ii) it engages, or proposes to engage, in the business of investing, reinvesting, owning, holding or trading in securities and it owns or proposes to acquire investment securities having a value exceeding 40% of the value of its total assets (exclusive of U.S. government securities and cash items) on an unconsolidated basis. We do not believe that we are an “investment company,” as such term is defined in either of those sections of the 1940 Act.
As the sole shareholder of FTS International, Inc., which is the sole member of ProFrac LLC, the Issuer indirectly controls and operates ProFrac LLC. On that basis, we believe that the Issuer’s interest in ProFrac LLC is not an “investment security” as that term is used in the 1940 Act. However, if the Issuer were to cease participation in the management of ProFrac LLC, its interest in ProFrac LLC could be deemed to be an “investment security” for purposes of the 1940 Act.
Although the Issuer and ProFrac LLC intend to continue to conduct their operations so that the Issuer will not be deemed an investment company, if the Issuer were to be deemed an investment company, restrictions imposed by the 1940 Act, including limitations on our capital structure and our ability to transact with affiliates, would make it impractical for us to continue our business as contemplated and would have a material adverse effect on our business, financial condition and results of operations.
We are a “controlled company” within the meaning of the Nasdaq rules and, as a result, qualify for and intend to rely on exemptions from certain corporate governance requirements.
Because the Wilks Parties beneficially own more than a majority of the voting power of ProFrac, we are a controlled company under Sarbanes-Oxley and rules of Nasdaq. Additionally, the Wilks Parties are currently, and we expect that they will continue to be, deemed a group for purposes of certain rules and regulations of the SEC as a result of the ProFrac Stockholders’ Agreement. Under the Nasdaq rules, a company of which more than 50% of the voting power is held by another person or group of persons acting together is a controlled company and may elect not to comply with certain Nasdaq corporate governance requirements, including the requirements that:
•a majority of the board of directors consist of independent directors as defined under the rules of Nasdaq;
•the nominating and governance committee be composed entirely of independent directors with a written charter addressing the committee’s purpose and responsibilities; and
•the compensation committee be composed entirely of independent directors with a written charter addressing the committee’s purpose and responsibilities.
These requirements will not apply to us as long as we remain a controlled company. We currently intend to continue to utilize some or all of these exemptions. Accordingly, you may not have the same protections afforded to stockholders of companies that are subject to all of the corporate governance requirements of Nasdaq.
General Risk Factors
Our business could be adversely affected by a decline in general economic conditions or a weakening of the broader energy industry, and inflation or the imposition of tariffs may adversely affect our financial position and operating results.
A prolonged economic slowdown or recession, adverse events relating to the energy industry, or regional, national or global economic conditions and factors, particularly a slowdown in the E&P industry, could negatively impact our operations and therefore adversely affect our results. The risks associated with our business are more acute during periods of economic slowdown and recession because such periods may be accompanied by decreased exploration and development spending by our customers, decreased demand for oil and natural gas, and decreased prices for oil and natural gas.
Inflationary factors, such as increases in the labor costs, material costs, and overhead costs, may also adversely affect our financial position and operating results.
Potential changes in U.S. trade policy, including the imposition of tariffs and the consequences thereof have contributed to economic uncertainty in the global economy, which could precipitate an economic slowdown and adversely affect our supply chain, which could adversely materially impact our cost of operations. There is significant uncertainty about trade relationships between the U.S. and numerous other countries, including, for example, as a result of changes in U.S. trade policies, and the imposition of tariffs and taxes. If the economic climate of the U.S. remains uncertain, demand for oil and
natural gas could diminish, which could affect our customers’ continued operations and adversely affect our results of operations, liquidity and financial condition.
Developments related to the ongoing wars between Russia and Ukraine, conflicts in the Middle East, economic instability in Venezuela, and the global response thereto, could adversely affect our business, financial condition and results of operations.
The ongoing wars between Russia and Ukraine, conflicts in the Middle East, as well as the potential for disruption to strategic shipping routes such as the Strait of Hormuz, ongoing political and economic instability in Venezuela and other oil-producing regions, and the global response to such hostilities (including sanctions, export controls, and other governmental actions), could disrupt global energy markets, contribute to commodity price volatility, and adversely affect demand for our services.
We may be adversely affected by disputes regarding intellectual property rights of third parties.
Third parties from time to time may initiate litigation against us by asserting that the conduct of our business infringes, misappropriates or otherwise violates intellectual property rights. If we are sued for infringement and lose, we could be required to pay substantial damages and/or be enjoined from using or selling the infringing products or technology. Any legal proceeding concerning intellectual property could be protracted and costly regardless of the merits of any claim and is inherently unpredictable and could have a material adverse effect on our financial condition, regardless of its outcome.
If we were to discover that our technologies or products infringe valid intellectual property rights of third parties, we may need to obtain licenses from these parties or substantially re-engineer our products to avoid infringement. We may not be able to obtain the necessary licenses on acceptable terms, or at all, or be able to re-engineer our products successfully. If our inability to obtain required licenses for our technologies or products prevents us from selling our products, that could adversely impact our financial condition and results of operations.
We face significant competition that may cause a loss of market share.
The oilfield services industry is highly competitive and has relatively few barriers to entry. The principal competitive factors impacting sales of our services are price, reputation and technical expertise, equipment and service quality and health and safety standards. Numerous factors could cause us to lose our competitive position, including the nature of the markets we compete in, and the often-times price-based nature of the competition we face.
The market for hydraulic fracturing services is fragmented and includes, not only numerous small companies capable of competing effectively in our markets on a local basis, but also several large companies that possess substantially greater financial and other resources than we do. Our larger competitors’ greater resources could allow them to compete more effectively than we can. For instance, our larger competitors may offer services at below-market prices or bundle ancillary services at no additional cost to customers. We compete with large national and multi-national companies that have longer operating histories, greater financial, technical and other resources and greater name recognition than we do. Several of our competitors provide a broader array of services and have a stronger presence in more geographic markets.
Some jobs are awarded on a bid basis, which further increases competition based on price. Pricing is often the primary factor in determining which qualified contractor is awarded a job, and we have had in the past to lower our prices to remain competitive. For example, because of a combination of the increased competition which began during the second half of 2018 and 2019 and the decreased demand for our services in 2020 due to the COVID-19 pandemic, we had to lower our prices to remain competitive, which contributed to a 35% decrease in revenues from stimulation services for fiscal year 2020 (as compared to 2019). Although our industry and results of operations have seen a strong recovery since those times, the vitality characteristic of the energy business makes it impossible for us to rule out potential adverse changes in the competitive landscape that may force us, once again, to lower our prices, which would adversely affect our results of operations. In addition, we may lose market share or be unable to maintain or increase prices for our present services or to acquire additional business opportunities, which could also have a material adverse effect on our business, financial condition, results of operations and cash flows.
Our competitors may be able to respond more quickly to new or emerging technologies and services and changes in customer requirements. The amount of equipment available may exceed demand, which could result in active price competition. In addition, depressed commodity prices lower demand for hydraulic fracturing equipment, which results in excess equipment and lower utilization rates. In addition, some E&P companies have commenced completing their wells using their own hydraulic fracturing equipment and personnel. Any increase in the development and utilization of in-house fracturing capabilities by our customers could decrease the demand for our services and have a material adverse impact on our business.
If we are unable to employ a sufficient number of skilled and qualified workers, our capacity and profitability could be diminished and our growth potential could be impaired.
The delivery of our services requires skilled and qualified workers with specialized skills and experience who can perform physically demanding work. As a result of the volatility of the oilfield services industry and the demanding nature of the work, workers may choose to pursue employment in fields that offer a more desirable work environment at wage rates that are competitive. Our ability to be productive and profitable will depend upon our ability to employ and retain skilled workers. In addition, our ability to expand our operations depends in part on our ability to increase the size of our skilled labor force. The demand for skilled workers is high, and the supply is limited. As a result, competition for experienced oilfield service personnel is intense, and we face significant challenges in competing for crews and management with large and well-established competitors. A significant increase in the wages paid by competing employers could result in a reduction of our skilled labor force, increases in the wage rates that we must pay, or both. If either of these events were to occur, our capacity and profitability could be diminished and our growth potential could be impaired.
A negative shift in investor sentiment of the oil and gas industry has had and could in the future have adverse effects on our operations and ability to raise capital.
Certain segments of the investor community have developed negative sentiment towards investing in our industry. For example, certain sovereign wealth funds, pension funds, university endowments and family foundations, have stated policies to disinvest in the oil and gas sector based on their social and environmental considerations. Certain other stakeholders have also pressured commercial and investment banks and other lenders and investors to stop financing oil and gas production and related infrastructure projects, which adversely affects our customers. Such developments could result in downward pressure on the stock prices of oilfield service companies, including ours. This may also potentially result in a reduction of available capital funding for potential transactions, impacting our future financial results.
Negative public perception can lead to additional regulatory burdens and reduced business opportunities for us.
Increasing attention to climate change and natural capital, societal expectations on companies to address climate change, investor and societal expectations regarding voluntary ESG initiatives and disclosures, and consumer demand for alternative sources of energy may result in increased costs (including but not limited to increased costs associated with compliance, stakeholder engagement, contracting, and insurance), reduced demand for our customers’ hydrocarbon products and our product and services, reduced profits, increased legislative and judicial scrutiny, investigations and litigation, and negative impacts on our stock price and access to capital markets. Negative public perception regarding the oil and natural gas industry may lead to increased regulatory scrutiny, which may, in turn, lead to new state and federal safety and environmental laws, regulations, guidelines or enforcement interpretations. Additionally, environmental and other advocacy groups may oppose our or our customers’ operations through organized protests, attempt to block or sabotage our customers’ operations, intervene in regulatory or administrative proceedings involving our customers’ assets, or file lawsuits or other actions designed to prevent, disrupt or delay the development or operation of our and our customers’ assets. These actions may increase our costs and reduce our customers’ production levels over time which, as a result, may reduce demand for our products and services. Moreover, governmental authorities exercise considerable discretion in the timing and scope of permit issuance and the public may engage in the permitting process, including through intervention in the courts. Negative public perception could cause the permits that we or our customers require to conduct operations to be withheld, delayed or burdened by requirements that restrict our or our customers’ ability to profitably conduct business. Ultimately, this could make it more difficult to secure funding for our operations.
In addition, organizations that provide information to investors on corporate governance and related matters have developed ratings processes for evaluating companies on their approach to ESG matters. Such ratings are used by some investors to inform their investment and voting decisions. Unfavorable ESG ratings and recent activism directed at shifting funding away from companies with fossil fuel-related assets could lead to increased negative investor sentiment toward us, our customers and our respective industries and to the diversion of investment to other industries, which could have a negative impact on the price of our Class A Common Stock and our or our customers’ access to and cost of capital. Also, institutional lenders may decide not to provide funding for fossil fuel energy companies or their suppliers based on climate change-related concerns, which could affect our or our customers’ access to capital for potential growth projects. Moreover, to the extent ESG matters negatively impact our or the fossil fuel industry’s reputation, we may not be able to compete as effectively to recruit or retain employees, which may adversely affect our operations.
We are subject to cyber-security risks. A cyber incident could occur and result in information theft, data corruption, operational disruption and/or financial loss.
The oil and natural gas industry has become increasingly dependent on digital technologies to conduct certain processing activities. For example, we depend on digital technologies to perform many of our services and process and record operational and accounting data. At the same time, cyber incidents, including deliberate attacks or unintentional events, have increased. The U.S. government has issued public warnings that indicate that energy assets might be specific targets of cyber security threats. Our technologies, systems and networks, and those of our vendors, suppliers and other business partners, may become the target of cyberattacks or information security breaches that could result in the unauthorized release, gathering, monitoring, misuse, loss or destruction of proprietary and other information, or other disruption of our business operations. In addition, certain cyber incidents, such as surveillance, may remain undetected for an extended period. The potential for such security threats subjects our operations to increased risks that could have a material adverse effect on our business, financial condition and results of operations. For example, unauthorized access to our reserves information or other proprietary information could lead to data corruption, communication interruptions, or other disruptions to our operations. Our systems and insurance coverage for protecting against cyber security risks may not be sufficient. As cyber incidents continue to evolve, we may be required to expend additional resources to continue to modify or enhance our protective measures or to investigate and remediate any vulnerability to cyber incidents.
We are not able to anticipate, detect or prevent all cyber-attacks because the methods used by cyber-attackers frequently change or may be unrecognizable until an attack is already underway (or even significantly thereafter). Cyber-attackers are increasingly employing technologies that are specifically designed to circumvent cybersecurity measures and avoid detection. Cyber-attacks are expected to continue to become more sophisticated with prevalence of ransomware, credential stuffing, spear phishing, social engineering, use of deepfakes, artificial intelligence, and other methods of attempting to gain unauthorized access to data. A cyberattack or security breach could result in significant liability from data privacy or cybersecurity claims and regulation, regulatory penalties, damage to our reputation, loss of confidence in us, all of which could have a material and adverse effect on our business, financial condition and results of operations. Our insurance coverage for cyberattacks may not be sufficient to cover all the losses we may experience as a result of such cyberattacks. Despite our security measures, we acknowledge that no security measure is flawless, and there is no assurance that we will not suffer losses in connection with cyber-security risks in the future.
We may, in the future, incorporate artificial intelligence in our internal operations, and our third-party service providers may utilize artificial intelligence and machine learning technologies in furnishing services to us.
As with many technological innovations, artificial intelligence presents risks and challenges that could affect its adoption, and therefore our business. Although we have taken steps to be thoughtful in the use of artificial intelligence, it could pose certain risks to us and our customers, and there can be no assurance that regulators will agree with our approach to limiting these risks or to our compliance more generally. Risks can include, but are not limited to, the potential for errors or inaccuracies in the algorithms or models used by artificial intelligence, the potential for bias or inaccuracies in the data used to train the artificial intelligence, the potential for improper processing of personal information, and the potential for cybersecurity breaches that could compromise internal operations. Such risks could negatively affect the performance of our business, as well as our reputation and the reputations of our customers, and we could incur liability through the violation of laws or contracts to which we are a party or civil claims.
Adverse results of legal proceedings could materially adversely affect us.
We are, and may in the future be, subject to legal proceedings, claims, and controversies that arise out of the ordinary conduct of our business. The outcome of these matters may be difficult to assess or quantify, and there cannot be any assurance that such matters will be resolved in our favor. Irrespective of the merits, litigation and dispute resolution may be both lengthy and disruptive to our operations and may cause significant expenditure and diversion of management attention, or may require settlement payments. We may be faced with monetary damages or injunctive relief against us that could have an adverse impact on our business and results of operations should we fail to prevail in certain matters. For example, we assumed a sand contract in connection with our acquisition of a business and, in early August 2025, we and the acquired subsidiary were named as defendants in a suit alleging breach of contract related to a purported failure to purchase volumes under such contract. It is possible that cases in the future could result in damages that could adversely affect our ability to conduct our business or negatively impact our financial condition or results of operations.
The demand for our services has diversified as the use case for our power generation assets expands to encompass additional potential revenue streams, including the provision of power to companies not engaged in the production of hydrocarbons. In addition, we have historically engaged in, and may in the future pursue, acquisitions. Changing
industry dynamics and the integration of acquisitions may have a negative impact on our business if we do not effectively respond to market trends and incorporate acquired businesses.
The demand for power generation from data centers and utilities has expanded the use case for our power generation assets. In addressing these new areas of demand for our services, we may face challenges related to new regulatory regimes (including with respect to the sale of power), an expanded cohort of potential competitors and unforeseen obstacles related to servicing a business line which we have not historically addressed. In addition, we have pursued a number of acquisition opportunities and may continue to do so in the future—both in connection with our historical strategy and in connection with our strategy to expand into new areas of demand for our services. Integrating new assets presents challenges as management’s attention may be diverted as they work to effectively incorporate acquired operations into our business and legacy contracts of acquired entities may have unforeseen impacts on our business.
Item 1B. Unresolved Staff Comments.
None.
Item 1C. Cybersecurity.
We have implemented a cybersecurity program to assess, identify, and manage risks from cybersecurity threats that may result in material adverse effects on the confidentiality, integrity, and availability of our information systems.
Primary responsibility for our cybersecurity program rests with our Vice President of Information Technology, who has extensive cybersecurity and information technology knowledge and skills gained from over 30 years of work experience at the Company and elsewhere. The Vice President of Information Technology is responsible for implementing, monitoring and maintaining cybersecurity and data protection practices across our business and reports directly to our Chief Financial Officer. The Vice President of Information Technology at times attends meetings of the Board to report on any material developments and risk management practices.
The Vice President of Information Technology meets regularly with members of our information technology team, which includes a security architect whose responsibilities are dedicated solely to cybersecurity matters, a network engineer, and infrastructure director to discuss the risk management measures implemented by the Company to identify and mitigate data protection and cybersecurity risks. Our cybersecurity team also works with our Chief Legal Officer to oversee compliance with legal, regulatory and contractual security requirements.
Our cybersecurity processes include automated tools and technical safeguards managed and monitored by our cybersecurity team. We regularly conduct penetration and vulnerability testing and security audits. We also employ systems and processes designed to oversee, identify, and reduce the potential impact of a security incident at a third-party vendor, service provider or customer or otherwise implicating the third-party technology and systems we use. In addition to our internal cybersecurity capabilities, we also at times engage assessors, auditors, or other third parties to assist with the assessment, identification, and management of cybersecurity risks.
Our Board has delegated the primary responsibility to oversee cybersecurity matters to our Audit Committee, but retains overall oversight responsibility for cybersecurity matters. The Board and Audit Committee periodically review the measures implemented by the Company to identify and mitigate risks from cybersecurity threats. As part of such reviews, the Board and Audit Committee receive reports from members of our team responsible for overseeing the Company’s cybersecurity risk management, which may address a wide range of topics including recent developments, evolving standards, vulnerability assessments, third-party and independent reviews, the threat environment, technological trends and information security considerations arising with respect to the Company’s peers and third parties. The Audit Committee discusses with such members of our management team our information technology systems and procedures and will report to the Board on any material cybersecurity risks identified. We have protocols by which certain cybersecurity incidents are escalated within the Company and, where appropriate, reported to the Board and Audit Committee in a timely manner.
We have adopted an Information Security Incident Response Policy that applies in the event of a cybersecurity threat or incident (the “ISIRP”) to provide a standardized framework for responding to security incidents. The ISIRP sets out a coordinated approach to investigating, containing, documenting and mitigating incidents, including reporting findings and keeping senior management and other key stakeholders informed and involved as appropriate. The ISIRP applies to all Company personnel (including third-party contractors, vendors and partners) that perform functions or services that require access to secure Company information, and to all devices and network services that are owned or managed by the Company. As an additional measure to facilitate our timely and comprehensive response to any security incident, we engage a third party vendor on retainer to assist in such incidents.
As detailed elsewhere herein, we also rely on information technology and third party vendors to support our operations, including our secure processing of personal, confidential, sensitive, proprietary and other types of information. Despite ongoing efforts to continue improvement of our and our vendors’ ability to protect against cyber incidents, we may not be able to protect all information systems, and such incidents may lead to reputational harm, revenue and client loss, legal
actions, statutory penalties, among other consequences. Risks from cybersecurity threats, including as a result of any previous cybersecurity incidents, have not materially affected us, including our business strategy, results of operations or financial condition, and we do not believe that such risks are reasonably likely to have such an effect over the long term.
Item 2. Properties
Our Non-Mining Properties
We lease office space for our corporate headquarters located at 333 Shops Boulevard, Suites 102, 201, 202 & 301 and 337 Shops Boulevard, Suite 101 in Willow Park, Texas 76087. We currently own or lease the following additional principal properties:
|
|
|
|
|
|
|
Location |
|
Size |
|
Leased or owned |
|
Purpose |
Alberta, Canada |
|
12,840 sq ft |
|
Leased |
|
Office |
Abu Dhabi, UAE |
|
15,715 sq ft |
|
Leased |
|
Manufacturing |
Aledo, TX |
|
94,050 sq ft |
|
Leased |
|
Manufacturing |
Asherton, TX |
|
48,797 sq ft |
|
Leased |
|
Field Operations |
Cibolo, TX |
|
29,140 sq ft |
|
Leased |
|
Manufacturing |
Cisco, TX |
|
29,100 sq ft |
|
Leased |
|
Training Facility |
Cisco, TX |
|
377,186 sq ft |
|
Owned |
|
Field Operations |
Denver, CO |
|
4,347 sq ft |
|
Leased |
|
Sales Office |
Eighty Four, PA |
|
41,660 sq ft |
|
Leased |
|
Field Operations |
Elk City, OK |
|
42,330 sq ft |
|
Leased |
|
Field Operations |
Fort Worth, TX |
|
79,346 sq ft |
|
Leased |
|
Manufacturing |
Fort Worth, TX |
|
121,743 sq ft |
|
Leased |
|
Manufacturing |
Fort Worth, TX |
|
18,000 sq ft |
|
Leased |
|
Manufacturing |
Fort Worth, TX |
|
39,500 sq ft |
|
Leased |
|
Manufacturing |
Fort Worth, TX |
|
31,372 sq ft |
|
Leased |
|
Manufacturing |
Fruita, CO |
|
124,448 sq ft |
|
Leased |
|
Manufacturing |
Houston, TX |
|
23,588 sq ft |
|
Leased |
|
Sales/Corporate Office |
Killdeer, ND |
|
12,000 sq ft |
|
Leased |
|
Field Operations |
La Vernia, TX |
|
2,000 sq ft |
|
Leased |
|
Field Operations |
Longview, TX |
|
36,000 sq ft |
|
Leased |
|
Field Operations |
Marietta, OH |
|
20,000 sq ft |
|
Leased |
|
Manufacturing |
Midland, TX |
|
4,000 sq ft |
|
Leased |
|
Sales Office |
Midland, TX |
|
104,592 sq ft |
|
Leased |
|
Field Operations |
Odessa, TX |
|
61,540 sq ft |
|
Leased |
|
Field Operations |
Ozona, TX |
|
21,292 sq ft |
|
Leased |
|
Field Operations |
Pleasanton, TX |
|
62,950 sq ft |
|
Leased |
|
Field Operations |
Smithfield, PA |
|
47,800 sq ft |
|
Leased |
|
Field Operations |
Spring, TX |
|
5,670 sq ft |
|
Leased |
|
Manufacturing |
Vernal, UT |
|
26,000 sq ft |
|
Leased |
|
Field Operations |
Waller, TX |
|
94,424 sq ft |
|
Leased |
|
Manufacturing |
West Odessa, TX |
|
21,100 sq ft |
|
Leased |
|
Field Operations |
Zanesville, OH |
|
50,045 sq ft |
|
Owned |
|
Manufacturing |
Our Mining Properties
As of December 31, 2025, our mining properties included eight sites (Kermit, Lamesa, Monahans, San Antonio, Hat Creek, River Ridge, Sunny Point and Merryville), which span the Permian, Eagle Ford and Haynesville as illustrated in the map that follows. Our Merryville Sand Mine was idled in April 2024 until market conditions improve. As of December 31, 2025, we did not have any individually material mining properties.
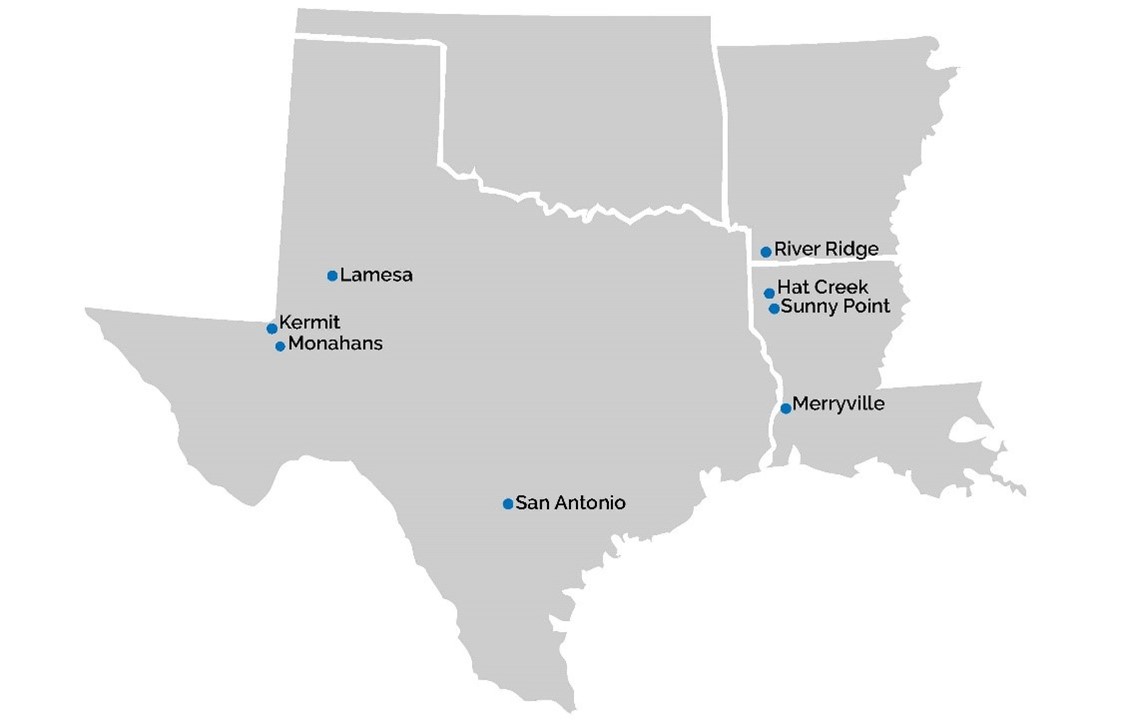
Summary Overview of Our Mining and Processing Facilities
The following table sets forth certain information about our mining properties required to be included in our mining operations as of December 31, 2025 pursuant to Item 1303(a) of Regulation S-K:
|
|
|
|
|
Mine |
Location |
Size |
Owned/Leased |
Stage |
Kermit |
Winkler County, Texas |
641 acres |
Owned |
Production |
630 acres |
Leased |
Production |
Lamesa |
Dawson County, Texas |
6,700 acres |
Owned |
Production |
Monahans |
Ector, Ward and Winkler Counties, Texas |
2,723 acres |
Leased |
Production |
San Antonio |
Bexar County, Texas |
735 acres |
Owned |
Production |
River Ridge |
Lafayette and Miller Counties, Arkansas |
1,928 acres |
Owned |
Production |
Hat Creek |
Bossier and Caddo Parishes, Louisiana |
706 acres |
Leased |
Production |
Sunny Point |
Bossier and Caddo Parishes, Louisiana |
783 acres |
Leased |
Production |
Merryville |
Beauregard Parish, Louisiana |
810 acres |
Owned |
Production |
All of our mines are operated by our subsidiary, Alpine Silica, LLC. Aggregate annual production of frac sand from our mines for the fiscal years ended on December 31, 2025, 2024 and 2023 was approximately 9.3 million tons, 7.1 million tons and 10.8 million tons, respectively, which includes production data for periods prior to our acquisition of the respective sand mines and is based on information provided by prior operators.
Summary of Operations and Production Statistics
The following table summarizes, for each of our properties, our mining and processing operations and production (sales volume) for the prior three years ended December 31. Production data is included for periods prior to our acquisition of the respective sand mines and is based on information provided by prior operators and as included in reports related to such properties prepared by John T. Boyd, our independent mining engineers and geologists.
|
|
|
|
|
|
|
Mine |
Mine Type |
Mining Method |
Nameplate Annual Processing Capacity (tons 000) |
2025 Production (tons 000) |
2024 Production (tons 000) |
2023 Production (tons 000) |
Kermit |
Surface |
Excavator/Truck |
3,000 |
1,115 |
766 |
927 |
Lamesa |
Surface |
Excavator/Truck |
2,500 |
1,165 |
470 |
924 |
Monahans |
Surface |
Excavator/Truck |
3,000 |
1,529 |
1,079 |
1,631 |
San Antonio |
Surface |
Excavator/Truck |
3,000 |
1,677 |
859 |
1,162 |
River Ridge |
Surface |
Dredge |
3,200 |
1,232 |
1,114 |
2,019 |
Hat Creek |
Surface |
Dredge |
2,000 |
963 |
1,281 |
1,548 |
Sunny Point |
Surface |
Dredge |
3,000 |
1,645 |
1,300 |
1,660 |
Merryville |
Surface |
Excavator/Truck |
1,800 |
0 |
217 |
910 |
Total |
|
|
21,500 |
9,326 |
7,086 |
10,781 |
* Our Merryville Sand Mine was idled in April 2024 and is anticipated to remain idle until market conditions improve.
Description of Mining and Processing Facilities
The following provides an overview of our mining and processing facilities:
Kermit Sand Mine, Winkler County, TX
We operate a sand mine and processing facility located in Winkler County, Texas, strategically located in the Permian that we refer to as our “Kermit Sand Mine.” The Kermit Sand Mine is a surface sand mine and a production stage property located approximately 14 miles north-northeast of Kermit, Texas and approximately 58 miles west-northwest of the Midland-Odessa, Texas metropolitan area. The Kermit Sand Mine produces 40/200-mesh frac sand, which we primarily process into 40/70-mesh and 70/200-mesh frac sand products. The Kermit Sand Mine sand deposit is loosely consolidated and overlain with a thin layer of overburden; characteristics which are amenable to the use of conventional surface mining techniques. Since the Kermit Sand Mine sand formation does not extend below the water table, the quarry is dry-mined using medium-sized earthmoving equipment. Our Kermit Sand Mine facility features a wet plant (with two 300-tph wash circuits) and dry plant (with two 200-tph drying and sorting circuits) that processes frac sand. Once the frac sand is appropriately processed, it is stored in one of eight storage silos until it is transported by truck to its destination. Additional onsite facilities include a scale house, office, shop, quality laboratory and onsite housing and RV sites for up to 40 employees.
Our Kermit Sand Mine operates under five operating permits and complies with other state and federal regulations that do not require a specific permit. The Kermit Sand Mine operates under an Air Quality Permit, which is renewable in 2028. Other permits for the mine include an annual Aggregate Production Operation Registration, a Petroleum Storage Tank Registration, a Stormwater Multi-Sector General Permit, and a Public Water System/Supply Registration application that is pending. There are no formal state or federal reclamation plans or permits required for the operation.
The Kermit Sand Mine comprises approximately 1,271 acres of mineral and/or surface rights controlled by us. Mineral rights for the subject property are held by one of our wholly owned indirect subsidiaries through a combination of 641 acres owned in fee, and 630 acres of leased property. The leased property agreement is valid until the year 2052 with a stipulated production start deadline of January 1, 2032, and a royalty rate of 2% of gross sales revenue.
Lamesa Sand Mine, Dawson and Gaines County, TX
We operate a sand mine and processing facility located in Dawson and Gaines Counties, Texas, strategically located in the Permian Basin that we refer to as our “Lamesa Sand Mine.” Our Lamesa Sand Mine is a surface sand mine and a production stage property located approximately 55 miles north of Midland, Texas, 60 miles south of Lubbock, Texas, and 13 miles northwest of Lamesa, Texas. The Lamesa Sand Mine produces 40/200-mesh frac sand, which we primarily process into 40/70-mesh and 70/200-mesh frac sand products. The Lamesa Sand Mine sand deposit is loosely consolidated and overlain with a thin layer of overburden; characteristics which are amenable to the use of conventional surface mining techniques. Since the Lamesa Sand Mine sand formation does not extend below the water table, the quarry is dry-mined using medium-sized earthmoving equipment. Our Lamesa Sand Mine facility features a wet plant (with two 250-tph wash circuits) and dry plant (with two 200-tph drying and sorting circuits) that processes frac sand. Once the frac sand is appropriately processed and classified, it is stored in one of four storage silos until it is transported by truck to its destination. Additional onsite facilities include an office building, quality laboratory, and shop that support the mining and processing activities, and onsite housing for up to 36 employees.
Our Lamesa Sand Mine operates under five operating permits and complies with other state and federal regulations that do not require a specific permit. The Lamesa Sand Mine operates under an air quality Permit by Rule, which does not have an expiration date. Other permits for the mine include an annual Aggregate Production Operation Registration, a Stormwater Multi-Sector General Permit, an On-Site Sewage Facility, and a Public Water System application that is pending. There are no formal state or federal reclamation plans or permits required for the operation.
The Lamesa Sand Mine comprises approximately 6,700 acres of mineral and surface rights controlled by us. The property is owned in fee by one of our wholly owned indirect subsidiaries and there are no associated lease agreements or royalty payments.
Monahans Sand Mine, Ector, Ward and Winkler Counties, TX
We operate a sand mine and processing facility located in Ector, Ward and Winkler Counties, Texas, strategically located in the Permian Basin that we refer to as our “Monahans Sand Mine.” We acquired the Monahans Sand Mine in late July 2022. Our Monahans Sand Mine is a surface sand mine and production stage property located approximately 10 miles east of Monahans, Texas and approximately 30 miles west of the Midland-Odessa, Texas metropolitan area. The Monahans Sand Mine produces 40/140-mesh frac sand, which we primarily process into 40/70-mesh and 70/140-mesh frac sand products. The Monahans Sand Mine sand deposit is loosely consolidated and overlain with a thin layer of overburden; characteristics which are amenable to the use of conventional surface mining techniques. Since the Monahans Sand Mine sand formation does not extend below the water table, the quarry is dry-mined using medium-sized earthmoving equipment. Our Monahans Sand Mine facility features a wet plant (with three 250-tph wash circuits) and dry plant (with two 250-tph drying and sorting circuits) that processes frac sand. Once the frac sand is appropriately processed and classified, it is stored in one of eight storage silos until it is transported by truck to its destination. Additional onsite facilities include an office building, various control rooms, a shop/warehouse and a quality laboratory that support the mining and processing activities.
Our Monahans Sand Mine operates under four permits and complies with other state and federal regulations that do not require a specific permit. The Monahans Sand Mine operates under an Air Quality Permit, which is renewable in 2029. Other permits for the mine include an annual Aggregate Production Operation Registration, an Industrial Hazardous Waste Solid Waste Registration, and a Stormwater Multi- Sector General Permit. There are no formal state or federal reclamation plans or permits required for the operation.
The Monahans Sand Mine comprises approximately 2,723 acres of leased surface and subsurface (i.e., mineral) rights. The Monahans Sand Mine lease agreement includes a royalty payable to the lessors in an amount equal to the greater of $1.00 per ton or 4.0% of the selling price (less transportation costs) for finished frac sand products sold subject to a minimum annual royalty payment of $1.25 million.
San Antonio Sand Mine, Bexar County, TX
We operate a sand mine and processing facility located in Bexar County, Texas, strategically located in the Eagle Ford that we refer to as our “San Antonio Sand Mine.” We acquired the San Antonio Sand Mine in December 2022. Our San Antonio Sand Mine is a surface sand mine and production stage property located approximately 8 miles south of the I-410 Loop on the outskirts of San Antonio, Texas. The San Antonio Sand Mine produces 35/140-mesh frac sand, which we primarily process into 35/70-mesh and 70/140-mesh frac sand products. The San Antonio Sand Mine sand deposit is loosely consolidated and overlain with a thin layer of overburden; characteristics which are amenable to the use of conventional surface mining techniques. Since the San Antonio Sand Mine sand formation does not extend below the water table, the quarry is dry-mined using medium-sized earthmoving equipment. Our San Antonio Sand Mine facility features a wet plant (with one 500-tph wash circuit) and dry plant (with two 200-tph and one 180-tph drying and sorting circuits) that processes frac sand. Once the frac sand is appropriately processed and classified, it is stored in one of five storage silos until it is transported by truck to its destination. Additionally, the San Antonio Sand Mine has more than six acres of wet sand storage. Additional onsite facilities include an office/control room, quality laboratory, and extensive conveyor systems that support intra-plant product movement.
Our San Antonio Sand Mine operates under five permits and complies with other state and federal regulations that do not require a specific permit. The San Antonio Sand Mine operates under an air quality Permit by Rule, which does not have an expiration date, while we apply for an Air Quality Permit. Other permits for the mine include an Aggregate Production Operation Registration, an Industrial Hazardous Waste Solid Waste Registration, a Petroleum Storage Tank Registration and a Stormwater Multi-Sector General Permit. There are no formal state or federal reclamation plans or permits required for the operation.
The San Antonio Sand Mine comprises approximately 735 acres of surface and subsurface (i.e., mineral) rights controlled by us. The property is owned in fee by one of our wholly owned indirect subsidiaries and there are no associated lease agreements or royalty payments.
River Ridge Sand Mine, Lafayette and Miller Counties, AR
We operate a sand mine and processing facility located in Miller and Lafayette Counties, Arkansas, strategically located in the Haynesville that we refer to as our “River Ridge Sand Mine.” We acquired the River Ridge Sand Mine in February 2023. Our River Ridge Sand Mine is a dredging and processing operation located along the western bank of the Red River approximately 10 miles southwest of Bradley, Arkansas and approximately 30 miles southeast of Texarkana, Arkansas. The River Ridge Sand Mine produces 30/140-mesh frac sand, which we primarily process into 30/70-mesh and 70/140-mesh frac sand products. Since the River Ridge Sand Mine sand formation lies near or below the water table, or is otherwise submerged, the mining operation employs dredging as the primary sand extraction method. Our River Ridge Sand Mine facility features a wet plant (with one 1,000-tph wash circuit) and dry plant (with three 200-tph drying and sorting circuits) that processes frac sand. Once the frac sand is appropriately processed and classified, it is stored in one of six storage silos until it is transported by truck to its destination. Additional onsite facilities include an office complex that supports the mining and processing activities.
Our River Ridge Sand Mine operates under five permits and complies with other state and federal regulations that do not require a specific permit. The River Ridge Sand Mine operates under a state of Arkansas Minor Source Air Permit, which does not have an expiration date. Other permits for the mine include Industrial Stormwater General Permit, Wastewater Discharge Permit, Section 404 Permit for dredging, and an Open-Cut Mining Permit. There are no formal state or federal reclamation plans or permits required for the operation.
The River Ridge Sand Mine comprises approximately 1,928 acres owned in fee by one of our wholly owned indirect subsidiaries.
Hat Creek Sand Mine, Bossier and Caddo Parishes, LA
We operate a sand mine and processing facility located in Bossier and Caddo Parishes, Louisiana, strategically located in the Haynesville that we refer to as our “Hat Creek Sand Mine.” We acquired the Hat Creek Sand Mine in February 2023. Our Hat Creek Sand Mine is a dredging and processing operation located approximately 5 miles north of Shreveport, Louisiana. The Hat Creek Sand Mine produces 30/140-mesh frac sand, which we process into various mesh-size frac sand products. Since the Hat Creek Sand Mine sand formation lies near or below the water table, or is otherwise submerged, the mining operation employs dredging as the primary sand extraction method. Our Hat Creek Sand Mine facility features a wet plant (with one 400-tph wash circuit) and dry plant (with one 150-tph and one 200-tph drying and sorting circuits) that processes frac sand. Once the frac sand is appropriately processed and classified, it is stored in one of five storage silos until it is transported by truck to its destination. Additional onsite facilities include an office complex that supports the mining and processing activities.
Our Hat Creek Sand Mine operates under five permits and complies with other state and federal regulations that do not require a specific permit. The Hat Creek Sand Mine operates under a state of Louisiana Minor Source Air Permit that expires in 2027. Other permits for the mine include Water Quality Certification — Sand Mining Operations, Water Quality Certification — Commercial Dredging, Section 404 Permit for dredging, and a General Permit for Discharges Related to Extraction, Mining or Dredging of Dirt, Sand, Gravel, Shell or Similar Materials. There are no formal state or federal reclamation plans or permits required for the operation.
The Hat Creek Sand Mine comprises approximately 706 acres of leased surface and mineral rights. All frac sand production from the Hat Creek Sand Mine is subject to a royalty payable to the lessor in an amount equal to the greater of $1.00 per ton or 2.5% of the selling price for finished frac sand products sold.
Sunny Point Sand Mine, Bossier and Caddo Parishes, LA
We operate a sand mine and processing facility located in Bossier and Caddo Parishes, Louisiana, strategically located in the Haynesville that we refer to as our “Sunny Point Sand Mine.” We acquired the Sunny Point Sand Mine in February 2023. Our Sunny Point Sand Mine is a dredging and processing operation located approximately 10 miles southeast of Shreveport, LA. The Sunny Point Sand Mine produces 30/200-mesh frac sand, which we process into various mesh-size frac sand products. Since the Sunny Point Sand Mine sand formation lies near or below the water table, or is otherwise submerged, the mining operation employs dredging as the primary sand extraction method. Our Sunny Point Sand Mine facility features a wet plant (with one 800-tph wash circuit) and dry plant (with two 400-tph drying and sorting circuits) that processes frac sand. Once the frac sand is appropriately processed and classified, it is stored in one of four storage silos until it is transported by truck to its destination. Additional onsite facilities include an office complex that supports the mining and processing activities.
Our Sunny Point Sand Mine operates under five permits and complies with other state and federal regulations that do not require a specific permit. The Sunny Point Sand Mine operates under a state of Louisiana Minor Source Air Permit that expires in 2032. Other permits for the mine include Water Quality Certification—Sand Mining Operations, Water Quality Certification—Commercial Dredging, Section 404/ Section 10 Permit for dredging, and a General Permit for Discharges Related to Extraction, Mining or Dredging of Dirt, Sand, Gravel, Shell or Similar Materials. There are no formal state or federal reclamation plans or permits required for the operation.
The Sunny Point Sand Mine comprises approximately 783 acres of leased surface and mineral rights. The property comprises two noncontiguous parcels. The processing plant and associated facilities are located on the west side of the Red River along Louisiana Highway 1. The dredging area comprises part of an oxbow lake located east of the Red River. We also dredge a part of the oxbow lake within the jurisdiction of the State of Louisiana for which we operate under a dredging permit, and we include such mineral reserves in our estimates for the Sunny Point Mine. Natural levees have cut off the oxbow lake from the main river channel upstream; however, the lake remains connected to the Red River on the downstream section. Dredged material is pumped through pipelines beneath the Red River. A pumping station lies on the western bank of the oxbow lake. Frac sand produced from the leased property is subject to a royalty payable to the lessors of $1.00 per ton sold. Frac sand produced from the part of the oxbow lake within the jurisdiction of the State of Louisiana is subject to a royalty payable to lessors of $0.50 per ton sold and a royalty payable to the Louisiana Department of Wildlife and Fisheries of $0.29 per cubic yard dredged.
Merryville Sand Mine, Beauregard Parish, LA
We operate a sand mine and processing facility located in Beauregard Parish, Louisiana, strategically located in the Haynesville that we refer to as our “Merryville Sand Mine.” Our Merryville Sand Mine was idled in April 2024 and is anticipated to remain idle until market conditions improve. We acquired the Merryville Sand Mine in February 2023. Our Merryville Sand Mine is a dredging and processing operation located approximately 7 miles north-northeast of Merryville, LA and 10 miles west of DeRidder, LA along the southern bank of the Bayou Anacoco. The Merryville Sand Mine produces 30/100-mesh frac sand, which we process into various mesh-size frac sand products. The Merryville Sand Mine sand deposit is loosely consolidated and overlain with a thin layer of overburden; characteristics which are amenable to the use of conventional surface mining techniques. Since the Merryville Sand Mine sand formation does not extend below the water table, the quarry is dry-mined using medium-sized earthmoving equipment. Our Merryville Sand Mine facility features a dry plant (with two 250-tph drying and sorting circuits) that processes frac sand. A wet plant is not required because of the particle size distribution of the mine frac sand. Once the frac sand is appropriately processed and classified, it is stored in one of three storage silos until it is transported by truck to its destination. Additional onsite facilities include an office complex that supports the mining and processing activities.
Our Merryville Sand Mine operates under two permits and complies with other state and federal regulations that do not require a specific permit. The Merryville Sand Mine operates under a state of Louisiana Minor Source Air Permit that expires in 2032 and also has a General Permit for Discharges Related to Extraction, Mining or Dredging of Dirt, Sand, Gravel, Shell or Similar Materials. There are no formal state or federal reclamation plans or permits required for the operation.
The Merryville Sand Mine comprises approximately 810 acres of owned surface and mineral rights. The Merryville Sand Mine was previously leased, which lease was in effect from September 1, 2021 to August 31, 2024 and included an “option to purchase” providing us the opportunity to purchase the property during the initial lease term for $4.8 million with annually prorated credit for royalties paid. We exercised the option to purchase in August 2024. Prior to our purchase of the property, all frac sand production from the Merryville Sand Mine was subject to a royalty payable to the lessor of $1.00 per ton sold.
Summary of Reserves
Information concerning our mining properties and mineral reserves has been prepared in accordance with the requirements of Subpart 1300 of Regulation S-K (“Reg. S-K 1300”). The terms “mineral resources,” “mineral reserve,” “proven mineral reserve,” and “probable mineral reserve,” whether singular or plural, are defined and used in accordance with Reg. S-K 1300. Under Reg. S-K 1300, mineral resources may not be classified as “mineral reserves” unless the determination has been made by a qualified person that the mineral resources can be the basis of an economically viable project. The amount of finished frac sand produced as a percentage of the raw frac sand mined, which is referred to as the processing yield (or plant yield), is analogous to the “cut-off grade” of other mining operations. If the expected processing yield of the frac sand is too low, the costs of production will outweigh sales revenues and the deposit cannot be economically mined. The minimum economic processing yield for each our mines (other than our idled Merryville mine), based on three-year historic financial results, is well below the expected processing yield of such mine. Other limiting criteria, such as minimum mining thicknesses or maximum stripping ratios (the ratio of waste to sand excavated) are generally not considered in the estimation of frac sand resources.
Set forth in the table below are estimates of our frac sand mineral reserves as of December 31, 2025. The estimates of frac sand mineral reserves at our mining properties have been prepared by John T. Boyd, our independent mining engineers and geologists, and in accordance with Reg. S-K 1300.
|
|
|
|
|
|
|
|
|
|
|
|
|
|
|
|
|
|
|
|
|
|
|
|
|
Summary Frac Sand Mineral Reserves at End of the Fiscal Year December 31, 2025
(in thousands of product tons) |
|
|
|
|
|
|
|
|
By Classification |
|
|
By Tenure |
|
|
|
Mesh-Size |
|
Total |
|
|
Proven |
|
|
Probable |
|
|
Owned |
|
|
Leased |
|
Permian |
|
|
|
|
|
|
|
|
|
|
|
|
|
|
|
|
|
Kermit(a) |
|
40/200 |
|
|
43,565 |
|
|
|
36,381 |
|
|
|
7,184 |
|
|
|
23,990 |
|
|
|
19,575 |
|
Lamesa(b) |
|
40/200 |
|
|
55,859 |
|
|
|
55,859 |
|
|
|
- |
|
|
|
55,859 |
|
|
|
- |
|
Monahans(c) |
|
40/140 |
|
|
112,442 |
|
|
|
- |
|
|
|
112,442 |
|
|
|
- |
|
|
|
112,442 |
|
Subtotal |
|
|
|
|
211,866 |
|
|
|
92,240 |
|
|
|
119,626 |
|
|
|
79,849 |
|
|
|
132,017 |
|
Eagle Ford |
|
|
|
|
|
|
|
|
|
|
|
|
|
|
|
|
|
San Antonio(d) |
|
35/140 |
|
|
19,925 |
|
|
|
- |
|
|
|
19,925 |
|
|
|
19,925 |
|
|
|
- |
|
Haynesville |
|
|
|
|
|
|
|
|
|
|
|
|
|
|
|
|
|
River Ridge(e) |
|
30/140 |
|
|
40,306 |
|
|
|
40,306 |
|
|
|
- |
|
|
|
40,306 |
|
|
|
- |
|
Hat Creek(f) |
|
30/140 |
|
|
4,393 |
|
|
|
3,796 |
|
|
|
597 |
|
|
|
- |
|
|
|
4,393 |
|
Sunny Point(g) |
|
30/200 |
|
|
37,071 |
|
|
|
- |
|
|
|
37,071 |
|
|
|
- |
|
|
|
37,071 |
|
Subtotal |
|
|
|
|
81,770 |
|
|
|
44,102 |
|
|
|
37,668 |
|
|
|
40,306 |
|
|
|
41,464 |
|
Total |
|
|
|
|
313,561 |
|
|
|
136,342 |
|
|
|
177,219 |
|
|
|
140,080 |
|
|
|
173,481 |
|
(a) Mineral reserves are reported at a selling price of $29.29 per ton, representing the expected weighted-average sales price over the expected life of the reserves based on our historical operating results, our short-term budget forecasts, and John T. Boyd’s knowledge of frac sand markets. The mining recovery factor was estimated to be 95%, and the processing yield was estimated to be 82.1%. Overall product yield was estimated to be 78% after mining and processing losses. The minimum economic processing yield is approximately 44% based on the Kermit Sand Mine’s historical and forecasted economics.
(b) Mineral reserves are reported at a selling price of $24.55 per ton, representing the expected weighted-average sales price over the expected life of the reserves based on our historical operating results, our short-term budget forecasts, and John T. Boyd’s knowledge of frac sand markets. The mining recovery factor was estimated to be 95%, and the processing yield was estimated to be 81.6%. Overall product yield was estimated to be 77.5% after mining and processing losses. The minimum economic processing yield is approximately 48% based on the Lamesa Sand Mine’s historical and forecasted economics.
(c) Mineral reserves are reported at a selling price of $25.97 per ton, representing the expected weighted-average sales price over the expected life of the reserves based on our historical operating results, our short-term budget forecasts, and John T. Boyd’s knowledge of frac sand markets. The mining recovery factor was estimated to be 95%, and the processing yield was estimated to be 80.8%. Overall product yield was estimated to be 76.7% after mining and processing losses. The minimum economic processing yield is approximately 56% based on the Monahans Sand Mine’s historical and forecasted economics.
(d) Mineral reserves are reported at a selling price of $32.44 per ton, representing the expected weighted-average sales price over the expected life of the reserves based on our historical operating results, our short-term budget forecasts, and John T. Boyd’s knowledge of frac sand markets. The mining recovery factor was estimated to be 95%, and the processing yield was estimated to be 60.4%. Overall product yield was estimated to be 57.4% after mining and processing losses. The minimum economic processing yield is approximately 41% based on the San Antonio Sand Mine’s historical and forecasted economics.
(e) Mineral reserves are reported at a selling price of $35.18 per ton, representing the expected weighted-average sales price over the expected life of the reserves based on our historical operating results, our short-term budget forecasts, and John T. Boyd’s knowledge of frac sand markets. The mining recovery factor was estimated to be 95%, and the processing yield was estimated to be 66.4%. Overall product yield was estimated to be 63.1% after mining and processing losses. The minimum economic processing yield is approximately 27.5% based on the River Ridge Sand Mine’s historical and forecasted economics.
(f) Mineral reserves are reported at a selling price of $26.52 per ton, representing the expected weighted-average sales price over the expected life of the reserves based on our historical operating results, our short-term budget forecasts, and John T. Boyd’s knowledge of frac sand markets. The mining recovery factor was estimated to be 95%, and the processing yield was estimated to be 66.6%. Overall product yield was estimated to be 63.3% after mining and processing losses. The minimum economic processing yield is approximately 36.8% based on the Hat Creek Sand Mine’s historical and forecasted economics.
(g) Mineral reserves are reported at a selling price of $39.53 per ton, representing the expected weighted-average sales price over the expected life of the reserves based on our historical operating results, our short-term budget forecasts, and John T. Boyd’s knowledge of frac sand markets. The mining recovery factor was estimated to be 95%, and the processing yield was estimated to be 78.9%. Overall product yield was estimated to be 75.0% after mining and processing losses. The minimum economic processing yield is approximately 30.7% based on the Sunny Point Sand Mine’s historical and forecasted economics.
Summary of Resources
Quantities of frac sand controlled by us within the defined boundaries of the mining properties set forth above which are not reported as mineral reserves are not considered to have potential economic viability; as such, they are reportable as mineral resources.
Set forth in the table below are estimates of our frac sand mineral resources as of December 31, 2025. The estimates of frac sand mineral resources at our mining properties have been prepared by John T. Boyd, our independent mining engineers and geologists, and in accordance with Reg. S-K 1300.
|
|
|
|
|
|
|
|
|
|
|
|
|
|
|
|
|
|
|
|
|
|
|
|
|
|
|
|
|
Summary Frac Sand Mineral Resources at End of the Fiscal Year December 31, 2025
(in thousands of in-place tons) |
|
|
|
|
|
|
|
|
|
By Classification |
|
|
By Tenure |
|
|
|
Mesh-Size |
|
Total |
|
|
Measured |
|
|
|
Indicated |
|
Inferred |
|
|
Owned |
|
|
Leased |
|
Haynesville |
|
|
|
|
|
|
|
|
|
|
|
|
|
|
|
|
|
|
|
|
Merryville(a) |
|
30/100 |
|
|
13,498 |
|
|
|
- |
|
|
|
13,498 |
|
|
- |
|
|
|
13,498 |
|
|
|
- |
|
Total |
|
|
|
|
13,498 |
|
|
|
- |
|
|
|
13,498 |
|
|
- |
|
|
|
13,498 |
|
|
|
- |
|
(a) In April 2024, we idled the Merryville Sand Mine due to poor market conditions. Until such time as the market improves, the previously identified frac sand reserves of the Merryville Sand Mine are considered too uncertain or potentially uneconomical to mine and have been reclassified as frac sand mineral resources. Mineral resources are reported at a selling price of $25.90 per ton, representing the expected weighted-average sales price over the expected life of the resources based on our historical operating results, our short-term budget forecasts, and John T. Boyd’s knowledge of frac sand markets. The minimum economic processing yield is approximately 39.1% based on the Merryville Sand Mine’s historical and forecasted economics.
Internal Controls
The quantity and nature of our mineral reserves and resources are estimated by third-party engineers. John T. Boyd independently prepared an estimate of our mineral reserves and resources as of December 31, 2025, and we intend to continue retaining third party engineers to prepare estimates of our mineral reserves and resources on an annual basis. We provided John T. Boyd certain operating and financial information for each of our mines to assist them in opining as to the economic viability of our mineral reserves and resources. John T. Boyd did not verify historic drill hole data by conducting independent drilling in areas already explored. It is customary in preparing frac sand resource and reserve estimates to accept basic drilling and quality testing data as provided by management, subject to the reported results being judged representative and reasonable. John T. Boyd’s efforts to judge the appropriateness and reasonability of the source exploration data included reviewing provided drilling logs, sampling procedures, frac sand quality testing results, examining archival sample intervals and discussing the foregoing information with us. Before acquiring new mineral reserves or resources, we or third-party engineers such as John T. Boyd perform or review surveying, drill core analysis and other tests to confirm the quantity and quality of the acquired mineral reserves or resources.
For all properties, resource and reserve estimates are based on our mine planning efforts. Mine planning decisions are determined and agreed upon by our management based on information prepared by our personnel and third-party consultants. Management adjusts forward-looking models by reference to historic mining results, including reviewing performance versus predicted levels of production, and if necessary, re-evaluating mining methodologies if production outcomes were not realized as predicted. Ongoing mining and processing, along with product quality validation pursuant to periodic drill core sampling and customer expectations, provides further evidence as to the homogeneity, continuity and characteristics of the mineral deposit.
Management also assesses risks inherent in mineral resource and reserve estimates. For a discussion of the risks inherent in our mineral resource and reserve estimates, please refer to “Risk Factors — Risks Related to Our Business — Inaccuracies in our estimates of frac sand mineral reserves and resource deposits, or deficiencies in our title to those deposits, could result in our inability to mine the deposits or require us to pay higher than expected costs.”
Item 3. Legal Proceedings.
Information with respect to this Item is incorporated herein by reference to “Note 14. Commitments and Contingencies” included in “Item 8. Financial Statements and Supplementary Data” of this Annual Report.
Item 4. Mine Safety Disclosures.
The information concerning mine safety violations and other regulatory matters required by Section 1503(a) of the Dodd-Frank Wall Street Reform and Consumer Protection Act and Item 104 of Regulation S-K (17 CFR 229.104) is included in Exhibit 95 to this Annual Report on Form 10-K.
PART II
Item 5. Market for Registrant’s Common Equity, Related Stockholder Matters and Issuer Purchases of Equity Securities.
Market Information
Our Class A Common Stock is currently quoted on Nasdaq and Nasdaq Texas under the symbol “ACDC.” There is no public market for our Class B Common Stock or our Series A Preferred Stock.
Holders of our Class A Common Stock
As of March 3, 2026, there were 49 holders of record of our Class A Common Stock. The number of record holders is based upon the actual number of holders registered on the books of the Company at such date and does not include holders of shares in “street name” or persons, partnerships, associations, corporations or other entities identified in security position listings maintained by depositories.
Dividend Policy
The Issuer does not presently anticipate declaring or paying any cash dividends to holders of the Class A Common Stock in the foreseeable future. We currently intend to retain future earnings, if any, to finance the growth of our business. Our future dividend policy is within the discretion of our board of directors and will depend upon the then-existing conditions, including our results of operations, financial condition, capital requirements, investment opportunities, and other factors our board of directors may deem relevant. In addition, our existing debt agreements place, and we expect our future debt agreements will place, certain restrictions on our ability to pay cash dividends on the Class A Common Stock.
Recent Sales of Unregistered Equity Securities
We had no sales of unregistered equity securities during the period covered by this Annual Report that were not previously reported in a Current Report on Form 8-K or a Quarterly Report on Form 10-Q.
Issuer Purchases of Equity Securities
During the quarter ended December 31, 2025, we did not repurchase any of our equity securities.
Item 6. [Reserved]
Item 7. Management’s Discussion and Analysis of Financial Condition and Results of Operations.
The following discussion and analysis of our financial condition and results of operations should be read together with our consolidated financial statements and related notes included within “Item 8. Financial Statements and Supplementary Data.” Refer to Item 7, Management’s Discussion and Analysis of Financial Condition and Results of Operations, in our Form 10-K for the fiscal year ended December 31, 2024, for discussion of our financial condition and results of operations for the year ended December 31, 2024, compared to the year ended December 31, 2023, which is incorporated by reference herein.
In addition to historical consolidated financial information, the following discussion contains forward-looking statements that reflect the Company’s plans, estimates, or beliefs. Actual results could differ materially from those discussed in the forward-looking statements. Factors that could cause or contribute to these differences include those discussed below and elsewhere in this Annual Report, including, without limitation, those described in the sections titled “Cautionary Note Regarding Forward-Looking Statements” and Part I, Item 1A “Risk Factors.”
Overview
We are a vertically integrated and innovation-driven energy services holding company providing hydraulic fracturing, proppant production, other completion services and other complementary products and services to leading upstream oil and natural gas companies engaged in the exploration and production ("E&P") of North American unconventional oil and natural gas resources.
We operate in four reportable business segments: Stimulation Services, Proppant Production, Manufacturing and Flotek. Our Stimulation Services segment, which primarily relates to ProFrac LLC, owns and operates a fleet of mobile hydraulic fracturing units and other auxiliary equipment that generates revenue by providing stimulation services to our customers. Our Proppant Production segment, which primarily relates to Alpine, provides proppant to oilfield service providers and E&P companies. Our Manufacturing segment sells products such as high horsepower pumps, valves, piping, swivels, large-bore manifold systems, and fluid ends. Flotek is a leading chemistry and data technology company focused on servicing the E&P industry.
Summary Financial Results
•Total revenue for 2025 was $1,941.8 million compared to $2,190.9 million in 2024.
•Net loss for 2025 was $355.5 million compared to net loss of $207.8 million in 2024.
•Cash provided by operating activities for 2025 was $189.5 million compared to $367.3 million in 2024.
•Total principal amount of long-term debt was $1,048.1 million at December 31, 2025 compared to $1,138.9 million at December 31, 2024.
2025 Developments
In April 2025, Flotek acquired certain gas conditioning equipment from our Stimulation Services segment for total consideration of $107.5 million and our Stimulation Services segment leased these assets back from Flotek for a six year term. We believe this Flotek partnership provides ownership exposure to a highly-scalable gas quality and asset integrity business. The effects of this sale-leaseback transaction have been eliminated from our consolidated financial statements. Part of the $107.5 million consideration was a $40.0 million intercompany note payable from Flotek to our Stimulation Services segment (“Flotek PWRtek Note”). In November 2025, the Stimulation Services segment agreed to assign this note receivable to PC Energy Credit I, LLC, a related party to the Company controlled by the Wilks Parties, in exchange for cash consideration of $40.4 million, which represented the sum of the unpaid principal amount of the note and all accrued and unpaid interest on the note through the closing date.
In June and December 2025 ProFrac Holdings II, LLC issued a total $60 million aggregate principal amount of its 2029 Senior Notes at par to Beal Bank USA and Wilks Brothers, LLC, which is a Wilks Party, in a private placement to fund capital expenditures with any remaining proceeds used for general corporate purposes.
In June 2025, we amended the Alpine 2023 Term Loan. Under the terms of the amendment, the amortization payments required to be made on June 30, 2025, September 30, 2025 and December 31, 2025 were reduced from $15.0 million to $5.0 million and we will pay an exit fee of $3.4 million when the term loan is repaid. In December 2025, we amended the Alpine 2023 Term Loan. Under the terms of the amendment, the amortization payments required to be made on March 31, 2026 and June 30, 2026 were reduced from $15.0 million to $7.5 million. Additionally, the Alpine 2023 Term Loan contained a covenant commencing with the fiscal quarter ending March 31, 2026, requiring Alpine not to exceed a maximum Total Net Leverage Ratio (as defined in the Alpine Term Loan Credit Agreement) of 2.00 to 1.00. This covenant was amended to commence testing compliance with the Total Net Leverage Ratio with the fiscal quarter ending on March 31, 2028.
In June 2025, we disposed of our EKU Power Drives subsidiary in our Manufacturing Segment. We recorded a loss of $10.5 million in connection with this disposal.
In August 2025, we issued 20.6 million shares of Class A common stock, par value $0.01 per share at an offering price of $4.00 per share. The issuance of these shares generated net proceeds of $79.0 million, after deducting underwriter discounts and commissions and offering costs. The Wilks Parties bought 5.0 million shares of these Class A common stock, generating $20.0 million of gross proceeds. We used the net proceeds from this offering to repay borrowings outstanding under our 2022 ABL Credit Facility, for working capital and for other general corporate purposes.
2024 Developments
In April 2024, we acquired all of the remaining equity interests of Basin Production and Completion LLC (“BPC”). BPC is the parent company of FHE USA LLC, which manufactures equipment used in the hydraulic fracturing industry. The total purchase consideration was $39.8 million, consisting of cash consideration of $14.9 million and our pre-existing investment of $24.9 million.
In June 2024, we acquired 100% of the issued and outstanding capital stock of Advanced Stimulation Technologies, Inc. (“AST”), a pressure pumping services provider serving the Permian Basin, for total purchase consideration of $173.4 million in cash.
In June 2024, we acquired 100% of the issued and outstanding common stock of NRG Manufacturing, Inc., which manufactures equipment used in the hydraulic fracturing industry, and its affiliate, AMI US Holdings, Inc., which develops commercial software used in hydraulic fracturing industry (collectively, “NRG”), for total purchase consideration of $6.0 million in cash.
In May 2024, the Company formed a new entity, Livewire Power, LLC (“Livewire”), which began operations in October 2024. Livewire enables onsite power generation services for oilfield and non-oilfield customers that require off-grid power solutions. Livewire’s power generation equipment is comprised of owned and leased natural gas reciprocating engines and turbine assets. Livewire’s results of operations were immaterial for 2024.
In December 2024, we sold certain stimulation service equipment to the Wilks Parties in exchange for cash consideration of approximately $40.0 million. We now lease such equipment from the Wilks Parties in exchange for aggregate monthly lease payments totaling $44.8 million through December 2028. The cash consideration received was $26.5 million more than the carrying value of these assets. Because this sale was to an affiliate under common control, we accounted for the $26.5 million as an equity transaction recorded as a deemed contribution within our consolidated statements of changes in equity.
Recent Trends and Outlook
Our business depends on the willingness of E&P companies to make expenditures to explore for, develop, and produce oil and natural gas in the United States. The willingness of E&P companies to undertake these activities is predominantly influenced by current and expected future prices for oil and natural gas. Beginning in April 2025, oil commodity prices decreased from their near-term average through the first quarter of 2025 with increased volatility. As a result, many of our customers began reducing their activity levels and our results of operations and operating cash flows correspondingly declined compared to 2024. As described below, we have taken a number of actions to improve our liquidity. Also, as we anticipated, our results of operations in the fourth quarter 2025 increased relative to the third quarter 2025 with improved demand in Stimulation Services and Proppant Production. Although adverse weather impacted our results early in the first quarter of 2026, activity has recently increased into February and early March on a relative basis. . In the second half of 2025, we implemented initiatives to enhance the resiliency of the platform resulting in lower cash operating expenses and capital expenditures. We remain focused on financial and operational discipline and optimizing our asset base. While we have limited visibility for future demand for our products and services and continue to focus on liquidity management, we are encouraged by recent customer engagement.
We also actively monitor the effects of inflation and tariffs on our business; however, the potential effects of inflation and tariffs on our business remain uncertain at this time.
Results of Operations
Revenues
The following table summarizes revenues by reportable segment:
|
|
|
|
|
|
|
|
|
|
|
Year Ended December 31, |
|
|
|
2025 |
|
|
2024 |
|
Revenues |
|
|
|
|
|
|
Stimulation services |
|
$ |
1,682.9 |
|
|
$ |
1,914.4 |
|
Proppant production |
|
|
336.0 |
|
|
|
246.5 |
|
Manufacturing |
|
|
212.3 |
|
|
|
222.8 |
|
Flotek |
|
|
243.6 |
|
|
|
192.4 |
|
Other |
|
|
17.3 |
|
|
|
3.1 |
|
Eliminations |
|
|
(550.3 |
) |
|
|
(388.3 |
) |
Total revenues |
|
$ |
1,941.8 |
|
|
$ |
2,190.9 |
|
Stimulation Services revenues in 2025 decreased $231.5 million, or 12%, from 2024. The decrease was primarily due to a decrease in average active fleets and lower average pricing for our services in 2025.
Proppant Production revenues in 2025 increased $89.5 million, or 36%, from 2024. The increase was primarily due to higher average pricing for our proppant in 2025, which was due to a shift in intercompany sales mix from mine-gate pricing to wellsite pricing that began in the second quarter of 2025. Exclusive of this mix shift, revenues also increased due to higher sales volumes in 2025. Revenue recognized for the amortization of acquired off-market contracts was $7.6 million and $43.7 million in 2025 and 2024, respectively. Intersegment revenues for the Proppant Production segment were 64% and 26% in 2025 and 2024, respectively.
Manufacturing revenues in 2025 decreased $10.5 million, or 5%, from 2024. The decrease was primarily due to decreased intercompany demand for manufacturing products in the last nine months of 2025, which was partially offset by increased demand in the first quarter of 2025. Additionally, the acquisition of BPC and NRG contributed revenue starting in April 2024 and June 2024, respectively. Intersegment revenues for the Manufacturing segment were 82% and 77% in 2025 and 2024, respectively.
Flotek revenues in 2025 increased $51.2 million, or 27%, from 2024. This increase was primarily due to increased intercompany and third-party revenue. Flotek recorded $27.4 million and $32.5 million of revenue in 2025 and 2024, respectively, related to contract shortfalls with the Stimulation Services segment. Intersegment revenues for the Flotek segment were 63% in 2025 and 2024, respectively.
Other revenues in 2025 increased $14.2 million from 2024. This increase is primarily due to Livewire being operational for twelve months in 2025 compared to three months in 2024. Intersegment revenues for these business activities were 99% and 81% in 2025 and 2024, respectively.
Cost of Revenues
The following table summarizes our cost of revenues, exclusive of depreciation, depletion, and amortization, by reportable segment:
|
|
|
|
|
|
|
|
|
|
|
Year Ended December 31, |
|
|
|
2025 |
|
|
2024 |
|
Cost of revenues, exclusive of depreciation, depletion, and amortization: |
|
|
|
|
|
|
Stimulation services |
|
$ |
1,368.1 |
|
|
$ |
1,394.8 |
|
Proppant production |
|
|
259.3 |
|
|
|
137.6 |
|
Manufacturing |
|
|
174.1 |
|
|
|
190.5 |
|
Flotek |
|
|
174.8 |
|
|
|
147.5 |
|
Other |
|
|
16.6 |
|
|
|
5.0 |
|
Eliminations |
|
|
(538.3 |
) |
|
|
(380.3 |
) |
Total cost of revenues, exclusive of depreciation, depletion, and amortization |
|
$ |
1,454.6 |
|
|
$ |
1,495.1 |
|
Stimulation Services cost of revenues in 2025 decreased $26.7 million, or 2%, from 2024. This decrease was primarily due to a decrease in average active fleets in 2025. Cost of revenues for this segment included an intercompany supply commitment charge of $27.4 million in 2025 and $32.5 million in 2024 because the Stimulation Services segment did not purchase the minimum contractual commitment of chemistry products from Flotek.
Proppant Production cost of revenues in 2025 increased $121.7 million, or 88%, from 2024. This increase was primarily due to increased costs to support the shift in intercompany sales mix from mine-gate pricing to wellsite pricing, which began in the second quarter of 2025. Exclusive of this mix shift, costs of revenues also increased due to higher sales volumes in 2025.
Manufacturing cost of revenues in 2025 decreased $16.4 million, or 9%, from 2024. This decrease was primarily due to decreased volumes of products sold to intercompany customers in the last nine months of 2025, which was partially offset by increased volumes of products sold to intercompany customers in the first quarter of 2025. Additionally, the acquisition of BPC and NRG contributed costs beginning in April 2024 and June 2024, respectively.
Flotek cost of revenues in 2025 increased $27.3 million, or 19%, from 2024. This increase was primarily due to increased costs related to the increased volume of business.
Other cost of revenues in 2025 increased $11.6 million from 2024. This increase is primarily due to Livewire being operational for twelve months in 2025 compared to three months in 2024.
Selling, General and Administrative
The following table summarizes our selling, general and administrative expenses:
|
|
|
|
|
|
|
|
|
|
|
Year Ended December 31, |
|
|
|
2025 |
|
|
2024 |
|
Selling, general and administrative: |
|
|
|
|
|
|
Selling, general and administrative, excluding stock-based compensation |
|
$ |
180.1 |
|
|
$ |
197.3 |
|
Stock-based compensation |
|
|
10.4 |
|
|
|
7.3 |
|
Total selling, general and administrative |
|
$ |
190.5 |
|
|
$ |
204.6 |
|
Selling, general and administrative (“SG&A”) expenses in 2025 decreased $14.1 million, or 7%, from 2024. Excluding stock-based compensation expense, SG&A expenses decreased $17.2 million, or 9%. This decrease was due to lower labor costs resulting from cost control measures and reduced incentive compensation expense. These decreases were partially offset by increased expense at Flotek. The decrease was also partially offset by increased labor and facility costs related to our acquisitions of BPC, AST and NRG in the second quarter of 2024. Additionally, management fees of approximately $5.0 million owed to Wilks Brothers, LLC was reclassified to stock-based compensation expense as a result of an agreement to settle certain management fee payments by issuing common stock. See “Note 11. Stock-based Compensation” in the notes to our consolidated financial statements for a discussion of our stock-based compensation.
Depreciation, Depletion, and Amortization
The following table summarizes our depreciation, depletion, and amortization:
|
|
|
|
|
|
|
|
|
|
|
Year Ended December 31, |
|
|
|
2025 |
|
|
2024 |
|
Depreciation, Depletion, and Amortization |
|
|
|
|
|
|
Depreciation |
|
$ |
359.1 |
|
|
$ |
386.8 |
|
Amortization |
|
|
36.4 |
|
|
|
36.3 |
|
Depletion |
|
|
20.8 |
|
|
|
19.1 |
|
Total depreciation, depletion, and amortization |
|
$ |
416.3 |
|
|
$ |
442.2 |
|
Depreciation, depletion, and amortization decreased $25.9 million, or 6%, from 2024. Depreciation expense decreased $27.7 million, or 7%, from 2024. The decrease in depreciation was primarily due to certain assets becoming fully depreciated in 2025, combined with lower capital expenditures in 2025 when compared to prior years.
Acquisition Related Expenses
Acquisition and integration costs consist of professional and advisory fees, acquisition related severance expenditures, and other costs associated with acquisition and integration activities. Acquisition related expenses were $0.2 million and $7.8 million in 2025 and 2024, respectively. These costs related to our acquisition and integration activities in the respective periods.
Impairment of Long-lived Assets and Goodwill
In 2025, we recorded a $41.4 million impairment to the long-lived assets related to our idle Merryville sand mine. See "Note 5. Impairments" in the notes to our consolidated financial statements for further discussion.
In 2025, we recorded a $11.2 million goodwill impairment related to our BPC reporting unit. In 2024, we recorded goodwill impairments of $67.7 million, $4.4 million and $2.4 million related to our Haynesville Proppant, Eagle Ford Proppant and
Permian Proppant reporting units, respectively. See “Note 5. Impairments” in the notes to our consolidated financial statements for a discussion of these goodwill impairments.
Other Operating Expenses, Net
The following table summarizes our other operating expenses, net:
|
|
|
|
|
|
|
|
|
|
|
Year Ended December 31, |
|
|
|
2025 |
|
|
2024 |
|
Litigation expenses and accruals for legal contingencies |
|
$ |
11.0 |
|
|
$ |
15.7 |
|
Provision for credit losses, net of recoveries |
|
|
13.7 |
|
|
|
— |
|
Loss (gain) on insurance recoveries |
|
|
0.3 |
|
|
|
(4.9 |
) |
Transaction costs |
|
|
8.0 |
|
|
|
3.9 |
|
Lease termination |
|
|
1.1 |
|
|
|
— |
|
Severance charges |
|
|
0.4 |
|
|
|
2.5 |
|
Loss on disposal of assets |
|
|
18.1 |
|
|
|
0.3 |
|
Inventory write-down |
|
|
0.8 |
|
|
|
— |
|
Supply commitment charge |
|
|
— |
|
|
|
9.6 |
|
Total |
|
$ |
53.4 |
|
|
$ |
27.1 |
|
Litigation expenses and accruals for legal contingencies generally represent legal and professional fees incurred in significant litigation as well as estimates for loss contingencies with regards to certain vendor disputes and litigation matters. In 2025, substantially all of these costs represent litigation costs incurred in connection with certain patent infringement lawsuits. In 2024, substantially all of these costs represent litigation costs incurred in connection with certain patent infringement lawsuits with Halliburton Company, which were settled in September 2024.
Provision for credit losses in 2025 primarily related to a revised estimate of the payments to be received from an insolvent customer.
Gain on insurance recoveries consists of insurance proceeds received for accidentally damaged or destroyed equipment in excess of its carrying value.
Transaction costs in 2025 represent legal and professional fees incurred for strategic initiatives. Transaction costs for 2024 represent deferred costs incurred for Alpine's initial public offering that were charged to earnings as a result of its postponement.
Severance charges related to the departure of certain highly-compensated employees.
Gain or loss on disposal of assets, net consists of gains or losses on excess property, early equipment failures, and other asset dispositions. In 2025, loss on disposal of assets included the scrapping of certain equipment that was determined to be uneconomical to repair.
Inventory write-down for 2025 was recorded to reduce the inventory held at our Merryville sand mine to its net realizable value. See "Note 5. Impairments" in the notes to our consolidated financial statements for discussion of the impairment of long-lived assets at our Merryville sand mine.
Supply commitment charges for 2024 represent charges related to contractual inventory purchase commitments to certain proppant suppliers. These charges were attributable to our decreased volume of purchases from these suppliers due to certain customers decreasing their activity levels.
Interest Expense, Net
Interest expense, net in 2025 was $138.8 million, compared to $156.6 million in 2024. The decrease is due to lower average interest rates and lower average outstanding debt balances in 2025. We are subject to interest rate risk on our variable-rate debt. See “Note 7. Debt” in the notes to our consolidated financial statements for additional discussion related to our debt.
Other Income (Expense), Net
Other expense, net in 2025 was $3.8 million, compared to other income, net in 2024 of $3.0 million. The net change in 2025 was primarily due to the $10.5 million loss on disposal of EKU Power Drives, which was partially offset by a decrease in the fair value of our Munger make-whole provision in 2025. See “Note 15. Fair Value Measurements” in the notes to our consolidated financial statements for discussion of the Munger make-whole provision.
Income Tax Benefit (Expense)
Income tax benefit in 2025 was $12.9 million for an effective tax rate of 3.5%. Our income tax provision included a benefit of approximately $15 million from a reduction in Flotek’s valuation allowance. Excluding this item, the difference between our effective tax rate and the federal statutory rate related to a permanent book-tax difference in the accounting for a sale-leaseback transaction with Flotek and changes in the valuation allowance on our deferred tax assets.
Income tax benefit in 2024 was $7.0 million for an effective tax rate of 3.3%. Our income tax provision included a benefit of $25.6 million related to the release of a portion of the valuation allowance on our deferred tax assets. This item was caused by the assumption of a $25.6 million net deferred tax liability in our acquisition of AST, which made it more likely than not that we would be able to utilize a corresponding amount of our deferred tax assets. Excluding this item, the difference between our effective tax rate and the federal statutory rate related to changes in the valuation allowance on our deferred tax assets.
Liquidity and Capital Resources
Sources of Liquidity
Historically, our primary sources of liquidity are cash flows from operations and availability under our revolving credit facility. While Flotek is included in our consolidated financial statements, we do not have the ability to access or use Flotek’s cash or liquidity in our operations and, accordingly, have excluded Flotek’s cash and other sources of liquidity from the following discussion of our liquidity and capital resources. See "Note 1. Organization and Description of Business" in the notes to our consolidated financial statements for discussion of our ownership of Flotek.
Our Alpine 2023 Term Loan requires us to segregate collateral associated with Alpine and limits our ability to use Alpine's cash or assets to satisfy our obligations or the obligations of our other subsidiaries. We also have limited ability to provide Alpine with liquidity to satisfy its obligations. See “Note 7. Debt” in the notes to our consolidated financial statements for more information regarding the Alpine 2023 Term Loan.
At December 31, 2025, we had $17.2 million of cash and cash equivalents, excluding Flotek, and $135.4 million available for borrowings under our revolving credit facility which resulted in a total liquidity position of $152.6 million. Refer to “Note 7. Debt” and “Note 18. Subsequent Events” in the notes to our consolidated financial statements for more information regarding our revolving credit facility.
Beginning in April 2025, many of our customers began reducing their activity levels as a result of a depressed commodity price environment, and our results of operations and operating cash flows correspondingly began to decline. In an attempt to ensure that the Company has sufficient near-term liquidity during a prolonged depressed commodity environment, we have executed the following initiatives to optimize the cost structure of the business with a focus on operational efficiency:
•increased liquidity by issuance of common stock in August 2025, which generated net proceeds of $79.0 million;
•increased liquidity by selling an intercompany note receivable from Flotek Industries, Inc. ("Flotek") in November 2025 to PC Energy Credit I LLC, an affiliate of the Wilks Parties and a related party to the Company, generating net proceeds of approximately $40.4 million, which amounted to the entire principal amount of the note, plus accrued and unpaid interest;
•issued an additional $40.0 million and $25.0 million of 2029 Senior Notes in December 2025 and January 2026, respectively;
•on March 3, 2026, we amended the 2022 ABL Credit Facility to extend its scheduled maturity date to September 3, 2027;
•reduced our direct and indirect labor costs;
•reduced our selling, general and administrative expenses by reducing headcount and eliminating certain non-labor related costs; and
•identified areas to enhance operating efficiencies, to reduce operating expenses, and to reduce capital expenditures.
As a result of these actions, we believe our cost structure and liquidity are better positioned for the long term and we believe that our sources of liquidity and our cash provided by operations will be sufficient to fund our capital expenditures, satisfy our obligations, and remain in compliance with our existing debt covenants for at least the next 12 months.
In addition, Alpine is closely monitoring its forthcoming debt covenant compliance obligation that commences in the fiscal quarter ending March 31, 2028. While there can be no assurance, Alpine believes that it will be able to meet, modify, or further defer this debt covenant. See “Note 7. Debt” in the notes to our consolidated financial statements for more information about this forthcoming debt covenant.
Cash Flows
The following table provides a summary of our cash flows:
|
|
|
|
|
|
|
|
|
|
|
Year Ended December 31, |
|
|
|
2025 |
|
|
2024 |
|
Net cash provided by (used in): |
|
|
|
|
|
|
Operating activities |
|
$ |
189.5 |
|
|
$ |
367.3 |
|
Investing activities |
|
|
(163.7 |
) |
|
|
(372.3 |
) |
Financing activities |
|
|
(17.7 |
) |
|
|
(5.5 |
) |
Net change in cash, cash equivalents, and restricted cash |
|
$ |
8.1 |
|
|
$ |
(10.5 |
) |
Operating Activities. Net cash provided by operating activities was $189.5 million and $367.3 million 2025 and 2024, respectively. Cash flows from operating activities consists of net income or loss adjusted for non-cash items and changes in net working capital. Net income or loss adjusted for non-cash items in 2025 resulted in a cash increase of $152.8 million compared to a cash increase of $278.8 million in 2024. The change was primarily due to lower earnings in 2025. The net change in working capital in 2025 resulted in a cash increase of $36.7 million compared to a cash increase of $88.5 million in 2024. The change was primarily due to a decrease in cash provided by accounts receivable and inventories in 2025.
Investing Activities. Net cash used in investing activities was $163.7 million and $372.3 million in 2025 and 2024, respectively. The change was primarily due to decreased capital expenditures in 2025 and our acquisitions in 2024.
Financing Activities. Net cash used by financing activities was $17.7 million and $5.5 million in 2025 and 2024, respectfully. In 2025 debt repayments net of cash borrowed was $93.9 million. In 2024 debt repayments net of cash borrowed was $4.0 million. In 2025 we received proceeds, net of $79.0 million from issuances of common stock.
Cash Requirements
Our material cash requirements have consisted of, and we anticipate will continue to consist of the following:
•debt service obligations, including interest and principal;
•tax receivable agreement payments; and
•acquisitions of strategic businesses.
Debt Service Obligations
The following table summarizes our outstanding indebtedness as of December 31, 2025 and our future maturities:
|
|
|
|
|
|
|
|
|
|
|
|
|
|
|
|
|
|
|
|
|
|
|
|
|
|
|
|
|
|
|
2026 |
|
|
2027 |
|
|
2028 |
|
|
2029 |
|
|
2030 |
|
|
Thereafter |
|
|
Total |
|
ProFrac Holding Corp.: |
|
|
|
|
|
|
|
|
|
|
|
|
|
|
|
|
|
|
|
|
|
2029 Senior Notes |
|
$ |
78.4 |
|
|
$ |
78.5 |
|
|
$ |
78.5 |
|
|
$ |
335.0 |
|
|
$ |
— |
|
|
$ |
— |
|
|
|
570.4 |
|
2022 ABL Credit Facility |
|
|
— |
|
|
|
69.2 |
|
|
|
— |
|
|
|
— |
|
|
|
— |
|
|
|
— |
|
|
|
69.2 |
|
Equify Notes (1) |
|
|
5.0 |
|
|
|
3.3 |
|
|
|
— |
|
|
|
— |
|
|
|
— |
|
|
|
— |
|
|
|
8.3 |
|
Finance lease obligations |
|
|
2.0 |
|
|
|
1.8 |
|
|
|
0.3 |
|
|
|
— |
|
|
|
— |
|
|
|
— |
|
|
|
4.1 |
|
Other |
|
|
8.7 |
|
|
|
— |
|
|
|
— |
|
|
|
— |
|
|
|
— |
|
|
|
— |
|
|
|
8.7 |
|
ProFrac Holding Corp. principal amount |
|
|
94.1 |
|
|
|
152.8 |
|
|
|
78.8 |
|
|
|
335.0 |
|
|
|
— |
|
|
|
— |
|
|
|
660.7 |
|
|
|
|
|
|
|
|
|
|
|
|
|
|
|
|
|
|
|
|
|
|
|
Alpine Subsidiary: |
|
|
|
|
|
|
|
|
|
|
|
|
|
|
|
|
|
|
|
|
|
Alpine 2023 Term Loan |
|
|
45.0 |
|
|
|
60.0 |
|
|
|
60.0 |
|
|
|
155.0 |
|
|
|
— |
|
|
|
— |
|
|
|
320.0 |
|
Other |
|
|
0.5 |
|
|
|
0.4 |
|
|
|
0.1 |
|
|
|
— |
|
|
|
— |
|
|
|
— |
|
|
|
1.0 |
|
Finance lease obligations |
|
|
3.0 |
|
|
|
0.9 |
|
|
|
0.2 |
|
|
|
— |
|
|
|
— |
|
|
|
— |
|
|
|
4.1 |
|
Alpine principal amount |
|
|
48.5 |
|
|
|
61.3 |
|
|
|
60.3 |
|
|
|
155.0 |
|
|
|
— |
|
|
|
— |
|
|
|
325.1 |
|
|
|
|
|
|
|
|
|
|
|
|
|
|
|
|
|
|
|
|
|
|
|
Flotek Subsidiary: |
|
|
|
|
|
|
|
|
|
|
|
|
|
|
|
|
|
|
|
|
|
Flotek ABL credit facility |
|
|
3.3 |
|
|
|
— |
|
|
|
— |
|
|
|
— |
|
|
|
— |
|
|
|
— |
|
|
|
3.3 |
|
Finance lease obligations |
|
|
0.2 |
|
|
|
0.2 |
|
|
|
— |
|
|
|
— |
|
|
|
— |
|
|
|
— |
|
|
|
0.4 |
|
Flotek PWRtek Note (1) |
|
|
— |
|
|
|
— |
|
|
|
— |
|
|
|
— |
|
|
|
40.0 |
|
|
|
— |
|
|
|
40.0 |
|
Flotek principal amount |
|
|
3.5 |
|
|
|
0.2 |
|
|
|
— |
|
|
|
— |
|
|
|
40.0 |
|
|
|
— |
|
|
|
43.7 |
|
|
|
|
|
|
|
|
|
|
|
|
|
|
|
|
|
|
|
|
|
|
|
Other Subsidiaries: |
|
|
|
|
|
|
|
|
|
|
|
|
|
|
|
|
|
|
|
|
|
Revolving credit facility |
|
|
2.9 |
|
|
|
— |
|
|
|
— |
|
|
|
— |
|
|
|
— |
|
|
|
— |
|
|
|
2.9 |
|
Finance lease obligations |
|
|
0.3 |
|
|
|
0.3 |
|
|
|
0.3 |
|
|
|
0.3 |
|
|
|
0.4 |
|
|
|
4.6 |
|
|
|
6.2 |
|
Other |
|
|
0.4 |
|
|
|
0.4 |
|
|
|
0.5 |
|
|
|
0.5 |
|
|
|
0.5 |
|
|
|
7.2 |
|
|
|
9.5 |
|
Other subsidiaries principal amount |
|
|
3.6 |
|
|
|
0.7 |
|
|
|
0.8 |
|
|
|
0.8 |
|
|
|
0.9 |
|
|
|
11.8 |
|
|
|
18.6 |
|
|
|
|
|
|
|
|
|
|
|
|
|
|
|
|
|
|
|
|
|
|
|
Total principal amount |
|
$ |
149.7 |
|
|
$ |
215.0 |
|
|
$ |
139.9 |
|
|
$ |
490.8 |
|
|
$ |
40.9 |
|
|
$ |
11.8 |
|
|
$ |
1,048.1 |
|
(1)Related party debt agreements.
See “Note 7. Debt” and “Note 8. Leases” in the notes to our consolidated financial statements for the discussion of our various debt agreements and finance leases, respectively. In January 2026 ProFrac Holdings II, LLC issued an additional $25.0 million aggregate principal amount of its 2029 Senior Notes at par to Beal Bank USA in a private placement to fund capital expenditures with any remaining proceeds used for general corporate purposes. These notes were issued as additional notes pursuant to the original indenture as amended. These new notes and the notes previously issued under the indenture are treated as a single series of securities under the indenture and the new notes have substantially identical terms, other than the issue date, issue price and first payment date, as the existing notes and are secured by a security interest in the same collateral.
Both the 2029 Senior Notes and the ABL Credit Facility contain certain customary representations and warranties and affirmative and negative covenants. As of December 31, 2025, we were in compliance with these covenants.
As a result of the amendment of the Alpine 2023 Term Loan described in “Note 7. Debt” in the notes to our consolidated financial statements, the Alpine 2023 Term Loan contains a covenant commencing with the fiscal quarter ending March 31, 2028, requiring Alpine not to exceed a maximum Total Net Leverage Ratio (as defined in the Alpine Term Loan Credit Agreement) of 2.00 to 1.00. This ratio is generally the consolidated total debt of Alpine divided by Alpine's adjusted EBITDA. Alpine is closely monitoring its forthcoming compliance obligations with this covenant. While there can be no assurance, Alpine believes that it will be able to meet, modify, or further defer this debt covenant.
Capital Expenditures
The nature of our capital expenditures consists of a base level of investment required to support our current operations and amounts related to growth and company initiatives.
In 2025 our capital expenditures were $169.9 million, consisting of maintenance capital expenditures for our hydraulic fracturing fleet, upgrades to legacy pumps, expenditures to maintain efficient operations at our sand mines, and investments in next generation technology.
In 2026 we estimate capital expenditures will range from $80.0 million to $100.0 million in maintenance related expenditures and an additional $75.0 million to $85.0 million for growth initiatives. Currently, growth capital expenditures for 2026 are expected to be related to upgrades to our hydraulic fracturing fleet, investments in next generation technology and sand mine improvements.
We continually evaluate our capital expenditures and the amount that we ultimately spend will depend on a number of factors, including our liquidity position, customer demand for fleets, and expected industry activity levels. If the actions designed to improve our liquidity described above are ineffective, we may reduce capital expenditures.
Purchase Commitments
As of December 31, 2025, we had purchase commitments of $6.5 million in 2025.
Tax Receivable Agreement
As of December 31, 2025 we have $86.5 million of estimated tax receivable agreement obligations, with an estimated $4.6 million coming due over the next twelve months. This obligation will generally be paid under the tax receivable agreement as the Company realizes actual cash tax savings from the tax benefits covered by the tax receivable agreement in future tax years. We do not expect a significant increase in the estimate of this liability in future periods. For additional information about our tax receivable agreement, please see “Note 12. Income Taxes” in the notes to our consolidated financial statements.
Acquisitions of Strategic Businesses
Our growth strategy includes potential acquisitions and other strategic transactions. This strategy would need to be suspended if the actions described above to improve our liquidity are ineffective. From time to time we enter into non-binding letters of intent as well as binding agreements to make investments or acquisitions. These arrangements may provide for purchase consideration including cash, notes payable by us, equity or some combination, the use of which could impact our liquidity needs. These letters of intent typically are subject to the completion of satisfactory due diligence, the negotiation and resolution of significant business and legal issues, the negotiation, documentation and completion of mutually satisfactory definitive agreements among the parties, the consent of our lenders, our ability to finance any cash payment at closing, and approval of our board of directors. Any binding agreements we may enter typically include customary closing conditions. We cannot guarantee that any such actual or potential transaction will be completed on acceptable terms, if at all.
We have historically funded our acquisitions through issuances of our equity securities, borrowings under our credit agreements, and issuance of debt securities. For any future acquisitions, we may utilize borrowings under our revolving credit facility and various financing sources available to us, including the issuance of equity or debt securities through public offerings or private placements, to fund these acquisitions. Our ability to complete future offerings of equity or debt securities and the timing and terms of these offerings will depend on various factors including prevailing market conditions and our financial condition.
Critical Accounting Policies and Estimates
The preparation of our consolidated financial statements and related notes requires us to make estimates that affect the reported amounts of assets, liabilities, revenue and expenses, and related disclosures of contingent assets and liabilities. We base these estimates on historical results and various other assumptions believed to be reasonable, all of which form the basis for making estimates concerning the carrying values of assets and liabilities that are not readily available from other sources. Actual results may differ from these estimates, and such differences could be material.
In the notes accompanying the consolidated financial statements included elsewhere in this annual report, we describe the significant accounting policies used in the preparation of our consolidated financial statements. We believe that the following represent the most significant estimates and management judgments used in preparing the consolidated financial statements.
Business Combinations
Business combinations are accounted for under the acquisition method of accounting. Under this method, the assets acquired and liabilities assumed are recognized at their respective fair values as of the date of acquisition. The excess, if any, of the acquisition price over the fair values of the assets acquired and liabilities assumed is recorded as goodwill. For significant acquisitions, we utilize third-party appraisal firms to assist us in determining the fair values for certain assets acquired and liabilities assumed. The measurement of these fair values requires us to make significant estimates and assumptions which are inherently uncertain.
Adjustments to the fair values of assets acquired and liabilities assumed are made until we obtain all relevant information regarding the facts and circumstances that existed as of the acquisition date (the “measurement period”), not to exceed one year from the date of the acquisition. We recognize measurement-period adjustments in the period in which we determine the amounts, including the effect on earnings of any amounts we would have recorded in previous periods if the accounting had been completed at the acquisition date.
The estimation of net assets acquired in business combinations requires significant judgment in determination of the fair value of the assets and liabilities acquired. Our fair value estimates require us to use significant observable and unobservable inputs. The estimates of fair value are also subject to significant variability, are sensitive to changes in market conditions, and are reasonably likely to change in the future. A significant change in the observable and unobservable inputs and determination of fair value of the assets and liabilities acquired could significantly impact our consolidated financial statements.
Goodwill Impairment
Goodwill is evaluated for impairment annually in the fourth quarter or whenever events or circumstances indicate the carrying value may not be recoverable. The impairment test involves a comparison of the fair value of each reporting unit with its carrying value. Fair value reflects our estimate of the price a potential market participant would be willing to pay for the reporting unit in an arms-length transaction. Reporting units with significant goodwill balances at December 31, 2025, include our Stimulation Services reporting unit and our Flotek reporting unit.
Determining the fair value of a reporting unit requires complex analysis and judgment. We use a combination of discounted cash flow models and market data, such as earnings multiples and quoted market prices, for observable comparable companies. Discounted cash flow models require detailed forecasts of cash flow drivers, such as revenue growth rates, margin rates, and capital investments as well as estimates of weighted-average cost of capital rates. These estimates are made in the context of many uncertain factors, such as the effectiveness of our strategy, changes in customer behavior, technological changes, competitor actions, regulatory changes and macroeconomic trends.
Income Taxes
ProFrac Corp. is a taxable entity and is required to account for income taxes under the asset and liability method. Deferred taxes are recognized for the tax consequences of temporary differences by applying enacted statutory tax rates applicable to future years to differences between the financial statement carrying amounts and the tax bases of existing assets and liabilities. We recognize future tax benefits to the extent that such benefits are more likely than not to be realized.
We record a valuation allowance to reduce the value of a deferred tax asset if based on the consideration of all available evidence, it is more likely than not that all or some portion of the deferred tax asset will not be realized. Significant weight is given to evidence that can be objectively verified. We evaluate our deferred income taxes at each reporting date to determine if a valuation allowance is required by considering all available evidence, including historical and projected taxable income and tax planning strategies. We will adjust a previously established valuation allowance if we change our assessment of the amount of deferred income tax asset that is more likely than not to be realized.
An estimate of whether a valuation allowance is necessary and the related amount of the valuation allowance contain uncertainties because it requires us to apply judgment to all positive and negative evidence available to us. When considering the likelihood of whether a deferred tax asset will be available to offset future taxable income, we assess, among other things, our historical and projected income or loss. When performing this assessment, we must consider the cyclical nature of our business. Our business is heavily influenced by current and expected prices for oil and natural gas. These prices are outside of our control and a downturn in the market can result in periods of significant losses for us, which could prevent the realization of a deferred tax asset. We therefore must consider the future possibility of an industry downturn and the severity of its effect on our business when considering all positive and negative evidence related to the realization of our deferred tax assets. Although we believe that our judgments and estimates are reasonable, an adjustment to a valuation allowance in a given period may require a material adjustment in a future period if our assumptions regarding our future taxable income are proven inaccurate due to industry cycles.
We record uncertain tax positions, if any, in accordance with ASC 740 on the basis of a two-step process in which (1) we determine whether it is more likely than not that the tax positions will be sustained on the basis of the technical merits of the position and (2) for those tax positions that meet the more-likely-than-not recognition threshold, we recognize the largest amount of tax benefit that is more than 50 percent likely to be realized upon ultimate settlement with the related tax authority. We had no uncertain tax positions during the periods presented.
Property, Plant and Equipment
We calculate depreciation based on the estimated useful lives of our assets. When assets are placed into service, we make estimates with respect to their useful lives that we believe are reasonable. However, the cyclical nature of our business, which
results in fluctuations in the use of our equipment and the environments in which we operate, could cause us to change our estimates, thus affecting the future calculation of depreciation.
We continuously perform repair and maintenance expenditures on our service and mining equipment. Expenditures for betterments and renewals that extend the lives of our equipment, which may include the replacement of significant components of equipment, are capitalized and depreciated. Other repairs and maintenance costs are expensed as incurred. The determination of whether an expenditure should be capitalized or expensed requires management judgment with regard to the effect of the expenditure on the useful life of the equipment.
We separately identify and account for certain significant components of our hydraulic fracturing units including the engine, transmission, and pump, which requires us to separately estimate the useful lives of these components.
Impairment of Long-Lived Assets
We evaluate property, plant, and equipment, operating lease right-of-use assets, and definite-lived intangible assets for impairment when events or changes in circumstances indicate that the carrying value of a long-lived asset may not be recoverable, such as insufficient cash flows or plans to dispose of or sell long-lived assets before the end of their previously estimated useful lives. Recoverability is assessed based on the undiscounted future cash flows generated by the asset or asset group. Estimates of future undiscounted cash flows take into account possible outcomes and probabilities of their occurrence, which require us to apply judgment. If the carrying amount is not recoverable, we recognize an impairment loss equal to the amount by which the carrying amount exceeds fair value. We estimate fair value based on the income, market or cost valuation techniques. Our fair value calculations for long-lived assets contain uncertainties because they require us to apply judgment and estimates concerning future cash flows, strategic plans, useful lives and assumptions about market performance. We also apply judgment in the selection of a discount rate that reflects the risk inherent in our current business model.
Recent Accounting Pronouncements
See “Note 2. Summary of Significant Accounting Policies” in the notes to our consolidated financial statements for further discussion regarding recently issued accounting standards.
Related Party Transactions
See “Note 17. Related Party Transactions” in the notes to our consolidated financial statements for further discussion regarding related party transactions.
ITEM 7A. QUANTITATIVE AND QUALITATIVE DISCLOSURES ABOUT MARKET RISK
At December 31, 2025, we held no derivative instruments that materially increased our exposure to market risks for interest rates, foreign currency rates, commodity prices or other market price risks.
We are subject to interest rate risk on our variable-rate debt. A 1% increase in interest rates on our variable-rate debt as of December 31, 2025, would increase the annual interest payments for this debt by approximately $9.6 million.
Item 8. Financial Statements and Supplementary Data
INDEX TO FINANCIAL STATEMENTS
REPORT OF INDEPENDENT REGISTERED PUBLIC ACCOUNTING FIRM
Board of Directors and Shareholders
ProFrac Holding Corp.
Opinion on the financial statements
We have audited the accompanying consolidated balance sheets of ProFrac Holding Corp. (a Delaware corporation) and subsidiaries (the “Company”) as of December 31, 2025 and 2024, the related consolidated statements of operations, comprehensive income (loss), changes in equity, and cash flows for each of the three years in the period ended December 31, 2025, and the related notes and financial statement schedule included under Item 15(a)(2) (collectively referred to as the “consolidated financial statements”). In our opinion, the consolidated financial statements present fairly, in all material respects, the financial position of the Company as of December 31, 2025 and 2024, and the results of its operations and its cash flows for each of the three years in the period ended December 31, 2025, in conformity with accounting principles generally accepted in the United States of America.
We also have audited, in accordance with the standards of the Public Company Accounting Oversight Board (United States) (“PCAOB”), the Company’s internal control over financial reporting as of December 31, 2025, based on criteria established in the 2013 Internal Control—Integrated Framework issued by the Committee of Sponsoring Organizations of the Treadway Commission (“COSO”), and our report dated March 13, 2026 expressed an unqualified opinion.
Basis for opinion
These consolidated financial statements are the responsibility of the Company’s management. Our responsibility is to express an opinion on the Company’s consolidated financial statements based on our audits. We are a public accounting firm registered with the PCAOB and are required to be independent with respect to the Company in accordance with the U.S. federal securities laws and the applicable rules and regulations of the Securities and Exchange Commission and the PCAOB.
We conducted our audits in accordance with the standards of the PCAOB. Those standards require that we plan and perform the audit to obtain reasonable assurance about whether the financial statements are free of material misstatement, whether due to error or fraud. Our audits included performing procedures to assess the risks of material misstatement of the financial statements, whether due to error or fraud, and performing procedures that respond to those risks. Such procedures included examining, on a test basis, evidence regarding the amounts and disclosures in the financial statements. Our audits also included evaluating the accounting principles used and significant estimates made by management, as well as evaluating the overall presentation of the financial statements. We believe that our audits provide a reasonable basis for our opinion.
Critical audit matter
The critical audit matter communicated below is a matter arising from the current period audit of the financial statements that was communicated or required to be communicated to the audit committee and that: (1) relates to accounts or disclosures that are material to the financial statements and (2) involved our especially challenging, subjective, or complex judgments. The communication of critical audit matters does not alter in any way our opinion on the financial statements, taken as a whole, and we are not, by communicating the critical audit matter below, providing a separate opinion on the critical audit matter or on the accounts or disclosures to which it relates.
Fair value of the Stimulation Services reporting unit in goodwill impairment assessment
As described in note 2 to the consolidated financial statements, the Company has $208.5 million of goodwill related to its Stimulation Services reporting unit. Management, with assistance from a third-party valuation specialist, prepared a quantitative impairment test for the Stimulation Services reporting unit as of the Company’s annual impairment testing date in the fourth quarter of 2025 using a combination of the income and market approaches. As a result of this assessment, management concluded the fair value of the reporting unit exceeded its carrying value, therefore no impairment was identified. We identified the estimation of the fair value of the Stimulation Services reporting unit in the quantitative goodwill impairment assessment as a critical audit matter.
The principal consideration for our determination that the estimation of the fair value of the Stimulation Services reporting unit was a critical audit matter was that there was high estimation uncertainty with respect to significant assumptions, including forecasted revenues and cash flows, the discount rate, and estimated valuation multiples.
Our audit procedures related to the estimation of fair value of the Stimulation Services reporting unit included the following, among others.
•We evaluated the design and tested the operating effectiveness of the Company’s controls associated with developing the estimated fair value of the reporting unit.
•We evaluated the qualifications of valuation specialists engaged by the Company to assist in developing the estimated fair value of the reporting unit.
•We tested the clerical accuracy of the fair value models utilized by the valuation specialists and by management in estimating the fair value of the reporting unit.
•We identified significant inputs and assumptions applied in the estimation of fair value of the reporting unit to determine whether the inputs and assumptions were relevant in the circumstances and applied appropriately in the development of that fair value estimate.
•We evaluated forecasted financial performance of the reporting unit by comparing the projected amounts of revenues and cash flows to actual historical performance or relevant industry data.
•We utilized valuation specialists to assist in evaluating the methodologies used and whether they were acceptable for the underlying fair value determination and whether such methodologies had been applied correctly; the appropriateness of the discount rate and valuation multiples used by developing an independent expectation; and to identify and test other significant inputs to the estimation of the fair value of the reporting unit.
/s/ GRANT THORNTON LLP
We have served as the Company’s auditor since 2018.
Dallas, Texas
March 13, 2026
ProFrac Holding Corp.
CONSOLIDATED BALANCE SHEETS
(in millions, except per share amounts or where otherwise noted)
|
|
|
|
|
|
|
|
|
|
|
December 31, |
|
|
|
2025 |
|
|
2024 |
|
ASSETS |
|
|
|
|
|
|
Current assets: |
|
|
|
|
|
|
Cash and cash equivalents (includes VIE balances of $5.7 and $4.4) |
|
$ |
22.9 |
|
|
$ |
14.8 |
|
Accounts receivable, net (net of allowances for credit losses of $14.6 and $2.7) (includes VIE balances of $19.0 and $17.3) |
|
|
266.8 |
|
|
|
312.7 |
|
Accounts receivable — related party, net |
|
|
19.9 |
|
|
|
16.1 |
|
Inventories (includes VIE balances of $10.6 and $12.9) |
|
|
151.3 |
|
|
|
201.1 |
|
Prepaid expenses and other current assets (includes VIE balances of $0.9 and $0.9) |
|
|
22.6 |
|
|
|
29.4 |
|
Total current assets |
|
|
483.5 |
|
|
|
574.1 |
|
Property, plant, and equipment (net of accumulated depreciation of $1,582.2 and $1,312.4) (includes VIE net balances of $29.6 and $16.7) |
|
|
1,464.3 |
|
|
|
1,761.2 |
|
Operating lease right-of-use assets, net |
|
|
154.3 |
|
|
|
158.6 |
|
Goodwill |
|
|
290.2 |
|
|
|
302.0 |
|
Intangible assets, net |
|
|
111.8 |
|
|
|
148.9 |
|
Deferred tax assets (includes VIE balances of $29.0 and $0.0) |
|
|
29.0 |
|
|
|
— |
|
Other assets (includes VIE balances of $1.0 and $1.0) |
|
|
40.0 |
|
|
|
43.3 |
|
Total assets |
|
$ |
2,573.1 |
|
|
$ |
2,988.1 |
|
LIABILITIES, MEZZANINE EQUITY, AND STOCKHOLDERS’ EQUITY |
|
|
|
|
|
|
Current liabilities: |
|
|
|
|
|
|
Accounts payable (includes VIE balances of $48.0 and $37.4) |
|
$ |
257.1 |
|
|
$ |
324.3 |
|
Accounts payable — related party |
|
|
42.2 |
|
|
|
18.1 |
|
Accrued expenses (includes VIE balances of $8.5 and $6.0) |
|
|
74.0 |
|
|
|
67.2 |
|
Current portion of long-term debt (includes VIE balances of $3.5 and $4.8) |
|
|
144.7 |
|
|
|
159.6 |
|
Current portion of long-term debt— related party |
|
|
5.0 |
|
|
|
5.0 |
|
Current portion of operating lease liabilities (includes VIE balances of $1.3 and $1.5) |
|
|
44.8 |
|
|
|
26.0 |
|
Other current liabilities |
|
|
28.8 |
|
|
|
56.6 |
|
Other current liabilities — related party |
|
|
0.8 |
|
|
|
3.2 |
|
Total current liabilities |
|
|
597.4 |
|
|
|
660.0 |
|
Long-term debt |
|
|
832.7 |
|
|
|
936.1 |
|
Long-term debt — related party (includes VIE balances of $39.6 and $0) |
|
|
42.9 |
|
|
|
8.3 |
|
Operating lease liabilities (includes VIE balances of $5.6 and $6.5) |
|
|
115.5 |
|
|
|
137.1 |
|
Deferred tax liabilities |
|
|
11.8 |
|
|
|
14.9 |
|
Tax receivable agreement liability |
|
|
82.0 |
|
|
|
82.9 |
|
Other liabilities |
|
|
10.1 |
|
|
|
9.2 |
|
Total liabilities |
|
|
1,692.4 |
|
|
|
1,848.5 |
|
Commitments and contingencies (NOTE 14) |
|
|
|
|
|
|
Mezzanine equity: |
|
|
|
|
|
|
Series A redeemable convertible preferred stock, $0.01 par value, 50 thousand shares authorized, issued and outstanding |
|
|
68.8 |
|
|
|
63.5 |
|
Stockholders' equity: |
|
|
|
|
|
|
Preferred stock, $0.01 par value, 50.0 shares authorized, no shares issued and outstanding |
|
|
— |
|
|
|
— |
|
Class A common stock, $0.01 par value, 600.0 shares authorized, 180.9 and 160.2 shares issued and outstanding |
|
|
1.8 |
|
|
|
1.5 |
|
Class B common stock, $0.01 par value, 400.0 shares authorized, no shares issued and outstanding |
|
|
— |
|
|
|
— |
|
Additional paid-in capital |
|
|
1,325.9 |
|
|
|
1,241.2 |
|
Accumulated deficit |
|
|
(610.2 |
) |
|
|
(235.9 |
) |
Accumulated other comprehensive income |
|
|
— |
|
|
|
0.1 |
|
Total stockholders' equity attributable to ProFrac Holding Corp. |
|
|
717.5 |
|
|
|
1,006.9 |
|
Noncontrolling interests |
|
|
94.4 |
|
|
|
69.2 |
|
Total stockholders' equity |
|
|
811.9 |
|
|
|
1,076.1 |
|
Total liabilities, mezzanine equity, and stockholders' equity |
|
$ |
2,573.1 |
|
|
$ |
2,988.1 |
|
The accompanying notes are an integral part of these consolidated financial statements.
ProFrac Holding Corp.
CONSOLIDATED STATEMENTS OF OPERATIONS
(in millions, except per share amounts)
|
|
|
|
|
|
|
|
|
|
|
|
|
|
|
Year Ended December 31, |
|
|
|
2025 |
|
|
2024 |
|
|
2023 |
|
Revenues: |
|
|
|
|
|
|
|
|
|
Services |
|
$ |
1,692.7 |
|
|
$ |
1,886.7 |
|
|
$ |
2,274.2 |
|
Product sales |
|
|
249.1 |
|
|
|
304.2 |
|
|
|
355.8 |
|
Total revenues |
|
|
1,941.8 |
|
|
|
2,190.9 |
|
|
|
2,630.0 |
|
|
|
|
|
|
|
|
|
|
|
Operating costs and expenses: |
|
|
|
|
|
|
|
|
|
Cost of revenues, exclusive of depreciation, depletion and amortization |
|
|
1,454.6 |
|
|
|
1,495.1 |
|
|
|
1,740.1 |
|
Selling, general, and administrative |
|
|
190.5 |
|
|
|
204.6 |
|
|
|
233.6 |
|
Depreciation, depletion and amortization |
|
|
416.3 |
|
|
|
442.2 |
|
|
|
438.4 |
|
Impairment of long-lived assets and goodwill |
|
|
52.6 |
|
|
|
74.5 |
|
|
|
2.5 |
|
Acquisition and integration costs |
|
|
0.2 |
|
|
|
7.8 |
|
|
|
21.8 |
|
Other operating expense, net |
|
|
53.4 |
|
|
|
27.1 |
|
|
|
27.0 |
|
Total operating costs and expenses |
|
|
2,167.6 |
|
|
|
2,251.3 |
|
|
|
2,463.4 |
|
|
|
|
|
|
|
|
|
|
|
Operating income (loss) |
|
|
(225.8 |
) |
|
|
(60.4 |
) |
|
|
166.6 |
|
|
|
|
|
|
|
|
|
|
|
Other income (expense): |
|
|
|
|
|
|
|
|
|
Interest expense, net |
|
|
(138.8 |
) |
|
|
(156.6 |
) |
|
|
(154.9 |
) |
Loss on extinguishment of debt |
|
|
— |
|
|
|
(0.8 |
) |
|
|
(33.5 |
) |
Other income (expense), net |
|
|
(3.8 |
) |
|
|
3.0 |
|
|
|
(36.2 |
) |
Loss before income taxes |
|
|
(368.4 |
) |
|
|
(214.8 |
) |
|
|
(58.0 |
) |
Income tax benefit (expense) |
|
|
12.9 |
|
|
|
7.0 |
|
|
|
(1.2 |
) |
Net loss |
|
|
(355.5 |
) |
|
|
(207.8 |
) |
|
|
(59.2 |
) |
Less: net (income) loss attributable to noncontrolling interests |
|
|
(13.5 |
) |
|
|
(7.3 |
) |
|
|
3.3 |
|
Less: net income attributable to redeemable noncontrolling interests |
|
|
— |
|
|
|
— |
|
|
|
(41.8 |
) |
Net loss attributable to ProFrac Holding Corp. |
|
$ |
(369.0 |
) |
|
$ |
(215.1 |
) |
|
$ |
(97.7 |
) |
Net loss attributable to Class A common shareholders |
|
$ |
(374.3 |
) |
|
$ |
(219.9 |
) |
|
$ |
(107.5 |
) |
|
|
|
|
|
|
|
|
|
|
Loss per Class A common share (basic and diluted) |
|
$ |
(2.22 |
) |
|
$ |
(1.38 |
) |
|
$ |
(0.82 |
) |
|
|
|
|
|
|
|
|
|
|
Weighted average Class A common shares outstanding: |
|
|
|
|
|
|
|
|
|
Basic |
|
|
168.3 |
|
|
|
159.9 |
|
|
|
130.9 |
|
Diluted |
|
|
168.3 |
|
|
|
159.9 |
|
|
|
130.9 |
|
The accompanying notes are an integral part of these consolidated financial statements.
ProFrac Holding Corp.
CONSOLIDATED STATEMENTS OF COMPREHENSIVE INCOME (LOSS)
(in millions)
|
|
|
|
|
|
|
|
|
|
|
|
|
|
|
Year Ended December 31, |
|
|
|
2025 |
|
|
2024 |
|
|
2023 |
|
Net loss |
|
$ |
(355.5 |
) |
|
$ |
(207.8 |
) |
|
$ |
(59.2 |
) |
Other comprehensive income: |
|
|
|
|
|
|
|
|
|
Foreign currency translation adjustments |
|
|
0.1 |
|
|
|
— |
|
|
|
0.3 |
|
Comprehensive loss |
|
|
(355.4 |
) |
|
|
(207.8 |
) |
|
|
(58.9 |
) |
Less: comprehensive (income) loss attributable to noncontrolling interest |
|
|
(13.5 |
) |
|
|
(7.5 |
) |
|
|
3.4 |
|
Less: comprehensive income attributable to redeemable noncontrolling interest |
|
|
— |
|
|
|
— |
|
|
|
(41.9 |
) |
Comprehensive loss attributable to ProFrac Holding Corp. |
|
$ |
(368.9 |
) |
|
$ |
(215.3 |
) |
|
$ |
(97.4 |
) |
The accompanying notes are an integral part of these consolidated financial statements.
ProFrac Holding Corp.
CONSOLIDATED STATEMENTS OF CHANGES IN EQUITY
(in millions)
|
|
|
|
|
|
|
|
|
|
|
|
|
|
|
|
|
|
|
|
|
|
|
|
|
|
|
|
|
|
|
Class A Common Stock |
|
|
Additional
Paid-in |
|
|
Accumulated |
|
|
Accumulated
Other
Comprehensive |
|
|
Noncontrolling |
|
|
Total Stockholders' |
|
|
|
Shares |
|
|
Amount |
|
|
Capital |
|
|
Deficit |
|
|
Income |
|
|
Interests |
|
|
Equity |
|
Balance, December 31, 2024 |
|
|
160.2 |
|
|
$ |
1.5 |
|
|
$ |
1,241.2 |
|
|
$ |
(235.9 |
) |
|
$ |
0.1 |
|
|
$ |
69.2 |
|
|
$ |
1,076.1 |
|
Net income (loss) |
|
|
— |
|
|
|
— |
|
|
|
— |
|
|
|
(369.0 |
) |
|
|
— |
|
|
|
13.5 |
|
|
|
(355.5 |
) |
Stock-based compensation |
|
|
— |
|
|
|
— |
|
|
|
3.1 |
|
|
|
— |
|
|
|
— |
|
|
|
0.9 |
|
|
|
4.0 |
|
Class A shares issued for vested stock awards |
|
|
0.3 |
|
|
|
— |
|
|
|
— |
|
|
|
— |
|
|
|
— |
|
|
|
— |
|
|
|
— |
|
Cash settlement of vested stock awards |
|
|
(0.2 |
) |
|
|
— |
|
|
|
(1.2 |
) |
|
|
— |
|
|
|
— |
|
|
|
— |
|
|
|
(1.2 |
) |
Foreign currency translation adjustments |
|
|
— |
|
|
|
— |
|
|
|
— |
|
|
|
— |
|
|
|
0.1 |
|
|
|
— |
|
|
|
0.1 |
|
Change in Flotek noncontrolling interest |
|
|
— |
|
|
|
— |
|
|
|
(7.6 |
) |
|
|
— |
|
|
|
— |
|
|
|
7.6 |
|
|
|
— |
|
Change in other noncontrolling interest |
|
|
— |
|
|
|
— |
|
|
|
0.4 |
|
|
|
— |
|
|
|
— |
|
|
|
(3.4 |
) |
|
|
(3.0 |
) |
Subsidiary transactions with noncontrolling interests |
|
|
— |
|
|
|
— |
|
|
|
— |
|
|
|
— |
|
|
|
— |
|
|
|
(1.4 |
) |
|
|
(1.4 |
) |
Transfer of foreign currency translation of disposed subsidiary |
|
|
— |
|
|
|
— |
|
|
|
— |
|
|
|
— |
|
|
|
(0.2 |
) |
|
|
— |
|
|
|
(0.2 |
) |
Realization of deferred tax assets from Flotek transaction |
|
|
— |
|
|
|
— |
|
|
|
10.4 |
|
|
|
— |
|
|
|
— |
|
|
|
7.4 |
|
|
|
17.8 |
|
Class A shares issued, net |
|
|
20.6 |
|
|
|
0.3 |
|
|
|
78.7 |
|
|
|
— |
|
|
|
— |
|
|
|
0.6 |
|
|
|
79.6 |
|
Deemed contribution |
|
|
— |
|
|
|
— |
|
|
|
0.9 |
|
|
|
— |
|
|
|
— |
|
|
|
— |
|
|
|
0.9 |
|
Adjustment of convertible preferred stock to redemption amount |
|
|
— |
|
|
|
— |
|
|
|
— |
|
|
|
(5.3 |
) |
|
|
— |
|
|
|
— |
|
|
|
(5.3 |
) |
Balance, December 31, 2025 |
|
|
180.9 |
|
|
$ |
1.8 |
|
|
$ |
1,325.9 |
|
|
$ |
(610.2 |
) |
|
$ |
— |
|
|
$ |
94.4 |
|
|
$ |
811.9 |
|
The accompanying notes are an integral part of these consolidated financial statements.
ProFrac Holding Corp.
CONSOLIDATED STATEMENTS OF CHANGES IN EQUITY
(in millions)
|
|
|
|
|
|
|
|
|
|
|
|
|
|
|
|
|
|
|
|
|
|
|
|
|
|
|
|
|
|
|
Class A Common Stock |
|
|
Additional
Paid-in |
|
|
Accumulated |
|
|
Accumulated
Other
Comprehensive |
|
|
Noncontrolling |
|
|
Total Stockholders' |
|
|
|
Shares |
|
|
Amount |
|
|
Capital |
|
|
Deficit |
|
|
Income |
|
|
Interests |
|
|
Equity |
|
Balance, December 31, 2023 |
|
|
159.4 |
|
|
$ |
1.5 |
|
|
$ |
1,225.4 |
|
|
$ |
(16.0 |
) |
|
$ |
0.3 |
|
|
$ |
58.7 |
|
|
|
1,269.9 |
|
Net income (loss) |
|
|
— |
|
|
|
— |
|
|
|
— |
|
|
|
(215.1 |
) |
|
|
— |
|
|
|
7.3 |
|
|
|
(207.8 |
) |
Stock-based compensation |
|
|
— |
|
|
|
— |
|
|
|
6.5 |
|
|
|
— |
|
|
|
— |
|
|
|
0.8 |
|
|
|
7.3 |
|
Class A shares issued for vested stock awards |
|
|
0.8 |
|
|
|
— |
|
|
|
— |
|
|
|
— |
|
|
|
— |
|
|
|
— |
|
|
|
— |
|
Tax withholding related to net share settlement of equity awards |
|
|
(0.2 |
) |
|
|
— |
|
|
|
(1.5 |
) |
|
|
— |
|
|
|
— |
|
|
|
— |
|
|
|
(1.5 |
) |
Foreign currency translation adjustments |
|
|
— |
|
|
|
— |
|
|
|
— |
|
|
|
— |
|
|
|
(0.2 |
) |
|
|
0.2 |
|
|
|
— |
|
Share issuance |
|
|
0.2 |
|
|
|
— |
|
|
|
— |
|
|
|
— |
|
|
|
— |
|
|
|
— |
|
|
|
— |
|
Noncontrolling interest of acquired business |
|
|
— |
|
|
|
— |
|
|
|
— |
|
|
|
— |
|
|
|
— |
|
|
|
2.2 |
|
|
|
2.2 |
|
Deemed contribution |
|
|
— |
|
|
|
— |
|
|
|
26.5 |
|
|
|
— |
|
|
|
— |
|
|
|
— |
|
|
|
26.5 |
|
Adjustment to additional paid-in capital related to tax receivable agreement |
|
|
— |
|
|
|
— |
|
|
|
(14.9 |
) |
|
|
— |
|
|
|
— |
|
|
|
— |
|
|
|
(14.9 |
) |
Other |
|
|
— |
|
|
|
— |
|
|
|
(0.8 |
) |
|
|
— |
|
|
|
— |
|
|
|
— |
|
|
|
(0.8 |
) |
Adjustment of convertible preferred stock to redemption amount |
|
|
— |
|
|
|
— |
|
|
|
— |
|
|
|
(4.8 |
) |
|
|
— |
|
|
|
— |
|
|
|
(4.8 |
) |
Balance, December 31, 2024 |
|
|
160.2 |
|
|
$ |
1.5 |
|
|
$ |
1,241.2 |
|
|
$ |
(235.9 |
) |
|
$ |
0.1 |
|
|
$ |
69.2 |
|
|
$ |
1,076.1 |
|
The accompanying notes are an integral part of these consolidated financial statements.
ProFrac Holding Corp.
CONSOLIDATED STATEMENTS OF CHANGES IN EQUITY
(in millions)
|
|
|
|
|
|
|
|
|
|
|
|
|
|
|
|
|
|
|
|
|
|
|
|
|
|
|
|
|
|
|
|
|
|
|
|
|
|
|
Class A Common Stock |
|
|
Class B Common Stock |
|
|
Additional
Paid-in |
|
|
(Accumulated Deficit) Retained |
|
|
Accumulated
Other
Comprehensive |
|
|
Noncontrolling |
|
|
Total Stockholders' (Deficit) |
|
|
|
Shares |
|
|
Amount |
|
|
Shares |
|
|
Amount |
|
|
Capital |
|
|
Earnings |
|
|
Income |
|
|
Interests |
|
|
Equity |
|
Balance, December 31, 2022 |
|
|
53.9 |
|
|
$ |
0.5 |
|
|
|
104.2 |
|
|
$ |
1.0 |
|
|
$ |
— |
|
|
$ |
(1,185.9 |
) |
|
$ |
— |
|
|
$ |
72.2 |
|
|
|
(1,112.2 |
) |
Class A shares issued to acquire Producers |
|
|
0.4 |
|
|
|
— |
|
|
|
— |
|
|
|
— |
|
|
|
6.2 |
|
|
|
— |
|
|
|
— |
|
|
|
— |
|
|
|
6.2 |
|
Class A shares issued to acquire Performance Proppants |
|
|
0.3 |
|
|
|
— |
|
|
|
— |
|
|
|
— |
|
|
|
3.4 |
|
|
|
— |
|
|
|
— |
|
|
|
— |
|
|
|
3.4 |
|
Net loss |
|
|
— |
|
|
|
— |
|
|
|
— |
|
|
|
— |
|
|
|
— |
|
|
|
(97.7 |
) |
|
|
— |
|
|
|
(3.3 |
) |
|
|
(101.0 |
) |
Stock-based compensation |
|
|
— |
|
|
|
— |
|
|
|
— |
|
|
|
— |
|
|
|
7.8 |
|
|
|
— |
|
|
|
— |
|
|
|
0.3 |
|
|
|
8.1 |
|
Stock-based compensation related to deemed contribution |
|
|
— |
|
|
|
— |
|
|
|
— |
|
|
|
— |
|
|
|
12.4 |
|
|
|
— |
|
|
|
— |
|
|
|
— |
|
|
|
12.4 |
|
Flotek common stock issued to satisfy convertible notes held by third parties |
|
|
— |
|
|
|
— |
|
|
|
— |
|
|
|
— |
|
|
|
— |
|
|
|
— |
|
|
|
— |
|
|
|
12.7 |
|
|
|
12.7 |
|
Adjustment of redeemable noncontrolling interest to redemption amount |
|
|
— |
|
|
|
— |
|
|
|
— |
|
|
|
— |
|
|
|
(67.1 |
) |
|
|
1,277.4 |
|
|
|
— |
|
|
|
— |
|
|
|
1,210.3 |
|
Conversion of Class B shares to Class A shares |
|
|
104.2 |
|
|
|
1.0 |
|
|
|
(104.2 |
) |
|
|
(1.0 |
) |
|
|
1,313.3 |
|
|
|
— |
|
|
|
— |
|
|
|
— |
|
|
|
1,313.3 |
|
Foreign currency translation adjustments |
|
|
— |
|
|
|
— |
|
|
|
— |
|
|
|
— |
|
|
|
— |
|
|
|
— |
|
|
|
0.3 |
|
|
|
(0.1 |
) |
|
|
0.2 |
|
Class A shares issued for vested stock awards |
|
|
0.6 |
|
|
|
— |
|
|
|
— |
|
|
|
— |
|
|
|
— |
|
|
|
— |
|
|
|
— |
|
|
|
— |
|
|
|
— |
|
Tax withholding related to net share settlement of equity awards |
|
|
— |
|
|
|
— |
|
|
|
— |
|
|
|
— |
|
|
|
(0.8 |
) |
|
|
— |
|
|
|
— |
|
|
|
— |
|
|
|
(0.8 |
) |
Additional paid-in capital related to tax receivable agreement |
|
|
— |
|
|
|
— |
|
|
|
— |
|
|
|
— |
|
|
|
(67.6 |
) |
|
|
— |
|
|
|
— |
|
|
|
— |
|
|
|
(67.6 |
) |
Change in equity ownership of Flotek |
|
|
— |
|
|
|
— |
|
|
|
— |
|
|
|
— |
|
|
|
23.1 |
|
|
|
— |
|
|
|
— |
|
|
|
(23.1 |
) |
|
|
— |
|
Adjustment of convertible preferred stock to redemption amount |
|
|
— |
|
|
|
— |
|
|
|
— |
|
|
|
— |
|
|
|
— |
|
|
|
(9.8 |
) |
|
|
— |
|
|
|
— |
|
|
|
(9.8 |
) |
Change in accrued distribution related to income taxes |
|
|
— |
|
|
|
— |
|
|
|
— |
|
|
|
— |
|
|
|
(5.3 |
) |
|
|
— |
|
|
|
— |
|
|
|
— |
|
|
|
(5.3 |
) |
Balance, December 31, 2023 |
|
|
159.4 |
|
|
$ |
1.5 |
|
|
$ |
— |
|
|
$ |
— |
|
|
$ |
1,225.4 |
|
|
$ |
(16.0 |
) |
|
$ |
0.3 |
|
|
$ |
58.7 |
|
|
$ |
1,269.9 |
|
The accompanying notes are an integral part of these consolidated financial statements.
ProFrac Holding Corp.
CONSOLIDATED STATEMENTS OF CASH FLOWS
(in millions)
|
|
|
|
|
|
|
|
|
|
|
|
|
|
|
Year Ended December 31, |
|
|
|
2025 |
|
|
2024 |
|
|
2023 |
|
Cash flows from operating activities: |
|
|
|
|
|
|
|
|
|
Net loss |
|
$ |
(355.5 |
) |
|
$ |
(207.8 |
) |
|
$ |
(59.2 |
) |
Adjustments to reconcile net loss to net cash provided by operating activities: |
|
|
|
|
|
|
|
|
|
Depreciation, depletion and amortization |
|
|
416.3 |
|
|
|
442.2 |
|
|
|
438.4 |
|
Amortization of acquired unfavorable contracts |
|
|
(7.6 |
) |
|
|
(46.5 |
) |
|
|
(57.5 |
) |
Stock-based compensation |
|
|
9.3 |
|
|
|
7.3 |
|
|
|
29.8 |
|
Loss (gain) on insurance recoveries |
|
|
0.3 |
|
|
|
(4.9 |
) |
|
|
— |
|
Loss (gain) on disposal of assets, net |
|
|
18.1 |
|
|
|
0.3 |
|
|
|
(1.7 |
) |
Non-cash loss on extinguishment of debt |
|
|
— |
|
|
|
0.8 |
|
|
|
17.4 |
|
Amortization of debt issuance costs |
|
|
11.7 |
|
|
|
14.5 |
|
|
|
24.3 |
|
Acquisition earnout adjustment |
|
|
— |
|
|
|
— |
|
|
|
(6.6 |
) |
Loss (gain) on investments, net |
|
|
6.8 |
|
|
|
(0.4 |
) |
|
|
38.5 |
|
Provision for supply commitment charges |
|
|
— |
|
|
|
9.6 |
|
|
|
— |
|
Provision for credit losses, net of recoveries |
|
|
13.7 |
|
|
|
— |
|
|
|
— |
|
Impairment of long-lived assets and goodwill |
|
|
52.6 |
|
|
|
74.5 |
|
|
|
— |
|
Deferred tax expense (benefit) |
|
|
(14.1 |
) |
|
|
(10.7 |
) |
|
|
0.1 |
|
Other non-cash items, net |
|
|
1.2 |
|
|
|
(0.1 |
) |
|
|
— |
|
Changes in operating assets and liabilities: |
|
|
|
|
|
|
|
|
|
Accounts receivable |
|
|
26.9 |
|
|
|
55.5 |
|
|
|
204.8 |
|
Inventories |
|
|
38.8 |
|
|
|
64.7 |
|
|
|
19.1 |
|
Prepaid expenses and other assets |
|
|
6.9 |
|
|
|
(1.9 |
) |
|
|
26.5 |
|
Accounts payable |
|
|
(22.4 |
) |
|
|
(7.6 |
) |
|
|
(68.2 |
) |
Accrued expenses |
|
|
2.7 |
|
|
|
(1.3 |
) |
|
|
(43.8 |
) |
Other liabilities |
|
|
(16.2 |
) |
|
|
(20.9 |
) |
|
|
(8.4 |
) |
Net cash provided by operating activities |
|
|
189.5 |
|
|
|
367.3 |
|
|
|
553.5 |
|
|
|
|
|
|
|
|
|
|
|
Cash flows from investing activities: |
|
|
|
|
|
|
|
|
|
Acquisitions, net of cash acquired |
|
|
— |
|
|
|
(194.4 |
) |
|
|
(454.5 |
) |
Investment in property, plant & equipment |
|
|
(169.9 |
) |
|
|
(255.0 |
) |
|
|
(267.0 |
) |
Proceeds from sale of assets |
|
|
5.8 |
|
|
|
72.9 |
|
|
|
6.2 |
|
Proceeds from insurance recoveries |
|
|
— |
|
|
|
6.2 |
|
|
|
— |
|
Other |
|
|
0.4 |
|
|
|
(2.0 |
) |
|
|
(0.5 |
) |
Net cash used in investing activities |
|
|
(163.7 |
) |
|
|
(372.3 |
) |
|
|
(715.8 |
) |
|
|
|
|
|
|
|
|
|
|
Cash flows from financing activities: |
|
|
|
|
|
|
|
|
|
Proceeds from issuance of long-term debt |
|
|
118.5 |
|
|
|
136.7 |
|
|
|
1,220.0 |
|
Repayments of long-term debt |
|
|
(136.1 |
) |
|
|
(157.2 |
) |
|
|
(946.7 |
) |
Borrowings from revolving credit agreements |
|
|
1,755.9 |
|
|
|
1,938.2 |
|
|
|
1,575.8 |
|
Repayments of revolving credit agreements |
|
|
(1,830.5 |
) |
|
|
(1,918.1 |
) |
|
|
(1,685.2 |
) |
Payment of debt issuance costs |
|
|
(1.8 |
) |
|
|
(3.6 |
) |
|
|
(62.3 |
) |
Cash settlement of vested stock awards |
|
|
(1.2 |
) |
|
|
— |
|
|
|
— |
|
Tax withholding related to net share settlement of noncontrolling interest equity awards |
|
|
(1.6 |
) |
|
|
(1.5 |
) |
|
|
(0.8 |
) |
Proceeds from issuance of Series A preferred stock |
|
|
— |
|
|
|
— |
|
|
|
50.0 |
|
Payment of Series A preferred stock issuance costs |
|
|
— |
|
|
|
— |
|
|
|
(1.1 |
) |
Proceeds from issuance of common stock |
|
|
83.0 |
|
|
|
— |
|
|
|
— |
|
Payment of common stock issuance costs |
|
|
(3.4 |
) |
|
|
— |
|
|
|
— |
|
Other |
|
|
(0.5 |
) |
|
|
— |
|
|
|
— |
|
Net cash provided by (used in) financing activities |
|
|
(17.7 |
) |
|
|
(5.5 |
) |
|
|
149.7 |
|
|
|
|
|
|
|
|
|
|
|
Net increase (decrease) in cash, cash equivalents, and restricted cash |
|
|
8.1 |
|
|
|
(10.5 |
) |
|
|
(12.6 |
) |
Cash, cash equivalents, and restricted cash beginning of period |
|
|
14.8 |
|
|
|
25.3 |
|
|
|
37.9 |
|
Cash, cash equivalents, and restricted cash end of period |
|
$ |
22.9 |
|
|
$ |
14.8 |
|
|
$ |
25.3 |
|
The accompanying notes are an integral part of these consolidated financial statements.
ProFrac Holding Corp.
CONSOLIDATED STATEMENTS OF CASH FLOWS
(in millions)
|
|
|
|
|
|
|
|
|
|
|
|
|
|
|
Year Ended December 31, |
|
|
|
2025 |
|
|
2024 |
|
|
2023 |
|
Non-cash investing and financing activities |
|
|
|
|
|
|
|
|
|
Capital expenditures included in accounts payable |
|
$ |
8.6 |
|
|
$ |
32.4 |
|
|
$ |
44.9 |
|
Supplemental cash flow information |
|
|
|
|
|
|
|
|
|
Cash payments for interest |
|
$ |
125.5 |
|
|
$ |
137.8 |
|
|
$ |
139.1 |
|
Cash payments for income taxes |
|
$ |
2.1 |
|
|
$ |
3.0 |
|
|
$ |
0.3 |
|
The accompanying notes are an integral part of these consolidated financial statements.
ProFrac Holding Corp.
NOTES TO THE CONSOLIDATED FINANCIAL STATEMENTS
(Amounts in millions, except per share amounts, or where otherwise noted)
1. ORGANIZATION AND DESCRIPTION OF BUSINESS
ProFrac Holding Corp. (“ProFrac Corp.”) and its consolidated subsidiaries, including ProFrac Holdings, LLC (“ProFrac LLC”), is a vertically integrated and innovation-driven energy services holding company providing hydraulic fracturing, proppant production, other completion services and other complementary products and services to leading upstream oil and natural gas companies engaged in the exploration and production (“E&P”) of North American unconventional oil and natural gas resources.
ProFrac Corp. operates in four business segments: Stimulation Services, Proppant Production, Manufacturing and Flotek Industries, Inc., (“Flotek”). Our Stimulation Services segment owns and operates a fleet of mobile hydraulic fracturing units and other auxiliary equipment that generates revenue by providing stimulation services to our customers. Our Proppant Production segment provides proppant to oilfield service providers and E&P companies. Our Manufacturing segment sells highly engineered, tight tolerance machined, assembled, and factory tested products such as high horsepower pumps, valves, piping, swivels, large-bore manifold systems, and fluid ends. Flotek is a leading chemistry and data technology company focused on servicing the E&P industry.
Mr. Dan Wilks and Mr. Farris Wilks are brothers and are the founders and principal stockholders of the Company. Their sons, Mr. Matthew D. Wilks and Mr. Johnathan Ladd Wilks are the Company’s Executive Chairman and Chief Executive Officer, respectively. In the normal course of business, we enter into transactions with related parties where Mr. Dan Wilks and Mr. Farris Wilks and entities owned by or affiliated with them (collectively, the "Wilks Parties") hold a controlling financial interest. Under Nasdaq rules and the Company’s Related Party Transactions Policy, our Audit Committee is responsible for reviewing all related party transactions. Under the policy, potential related party transactions are subject to approval by the Audit Committee in advance or, in certain circumstances, ratification by the Audit Committee, in each case if such transactions satisfy the terms and conditions set forth in the policy. See "Note 17. Related Party Transactions" for further information.
Company Formation
ProFrac Corp. was incorporated as a Delaware corporation on August 17, 2021, to become a holding corporation for ProFrac LLC and its subsidiaries upon completion of a corporate reorganization in conjunction with a planned initial public offering (“IPO”). On May 17, 2022, ProFrac Corp. completed its IPO and corporate reorganization and became the managing member of ProFrac LLC. The consolidated financial statements presented herein are those of ProFrac Corp. In these notes to the consolidated financial statements, ProFrac Corp. is also referred to as “we,” “us,” “our,” or the “Company.”
Variable Interest Entity
Through a contractual relationship, we have the power to appoint directors to the board of directors of Flotek. Because we have this power through a contract and not through our direct equity interest in Flotek, Flotek meets the definition of a variable interest entity ("VIE"). Furthermore, we are the primary beneficiary of the VIE due to our ability to appoint four of seven directors to Flotek’s board of directors. Accordingly, we have consolidated the operating results, assets and liabilities of Flotek. The assets of Flotek can only be used to settle its obligations and the creditors of Flotek have no recourse to our assets. Our exposure to Flotek is generally limited to the carrying value of our equity and variable interest. As of December 31, 2025 and 2024, we owned approximately 50.0% and 50.5%, respectively, of Flotek's outstanding common stock.
Concentration of Risk and Liquidity Update
Our business activities are concentrated in the well completion services segment of the oilfield services industry in the United States. The market for these services is cyclical, and we depend on the willingness of our customers to make operating and capital expenditures to explore for, develop, and produce oil and natural gas in the United States. The willingness of our customers to undertake these activities depends largely upon prevailing industry conditions that are predominantly influenced by current and expected prices for oil and natural gas. Historically, a low commodity-price environment has caused our customers to significantly reduce their hydraulic fracturing activities and the prices they are willing to pay for those services. During such periods, these customer actions materially adversely affected our business, financial condition and results of operations.
Beginning in April 2025, many of our customers began reducing their activity levels as a result of a depressed commodity price environment, and our results of operations and operating cash flows correspondingly began to decline. In an attempt to ensure that the Company has sufficient near-term liquidity during a prolonged depressed commodity environment, we have executed the following initiatives to optimize the cost structure of the business with a focus on operational efficiency:
•increased liquidity by issuance of common stock in August 2025, which generated net proceeds of $79.0 million;
ProFrac Holding Corp.
NOTES TO THE CONSOLIDATED FINANCIAL STATEMENTS
(Amounts in millions, except per share amounts, or where otherwise noted)
•increased liquidity by selling an intercompany note receivable from Flotek Industries, Inc. ("Flotek") in November 2025 to PC Energy Credit I LLC, an affiliate of the Wilks Parties and a related party to the Company, generating net proceeds of approximately $40.4 million, which amounted to the entire principal amount of the note, plus accrued and unpaid interest;
•issued an additional $40.0 million and $25.0 million of 2029 Senior Notes in December 2025 and January 2026, respectively;
•on March 3, 2026, we amended the 2022 ABL Credit Facility to extend its scheduled maturity date to September 3, 2027;
•reduced our direct and indirect labor costs;
•reduced our selling, general and administrative expenses by reducing headcount and eliminating certain non-labor related costs; and
•identified areas to enhance operating efficiencies, to reduce operating expenses, and to reduce capital expenditures.
As a result of these actions, we believe our cost structure and liquidity are better positioned for the long term and we believe that our sources of liquidity and our cash provided by operations will be sufficient to fund our capital expenditures, satisfy our obligations, and remain in compliance with our existing debt covenants for at least the next 12 months.
Redeemable Noncontrolling Interests
ProFrac Corp.’s only material asset is an equity interest consisting of units representing limited liability company interests in ProFrac LLC (the “Units”). As the sole managing member of ProFrac LLC, ProFrac Corp. consolidates the financial results of ProFrac LLC and its subsidiaries and reports a noncontrolling interest related to the portion of Units not owned by ProFrac Corp. Historically, the holders of Units not owned by ProFrac Corp. also held shares of ProFrac Corp.’s Class B common stock, such that a single share of Class B common stock was issued for each Unit not owned by ProFrac Corp.
Pursuant to the Third Amended and Restated Limited Liability Company Agreement of ProFrac LLC and the Second Amended and Restated Certificate of Incorporation of ProFrac Corp., certain members of ProFrac LLC had the right to cause ProFrac LLC to redeem all or a portion of each such member's Units, together with the surrender of the same number of each such member's shares of Class B common stock, for an equivalent number of shares of Class A common stock or, at the election of our board of directors, cash. In connection with the exercise of such redemption, a corresponding number of shares of Class B common stock would be canceled. The redemption election was not considered to be within our control because the holders of Class B common stock and their affiliates controlled us through direct representation on our board of directors. As a result, we have historically presented the noncontrolling interests in ProFrac LLC as redeemable noncontrolling interests outside of permanent equity.
ProFrac Holding Corp.
NOTES TO THE CONSOLIDATED FINANCIAL STATEMENTS
(Amounts in millions, except per share amounts, or where otherwise noted)
In April 2023, all the eligible holders of the Units (the "Redeeming Members") submitted redemption notices with respect to all of their Units, representing an aggregate of 104.2 million ProFrac LLC units (the "Redeemed Units"), together with the surrender and delivery of the same number of shares of our Class B common stock. The Redeeming Members include entities owned or affiliated with ProFrac Corp.'s controlling stockholders, Mr. Dan Wilks and Mr. Farris Wilks, as well as Mr. Matthew D. Wilks, our Executive Chairman, an entity affiliated with Mr. Johnathan L. Wilks, our Chief Executive Officer, and Mr. Coy Randle, a former member of our board of directors.
In April 2023, we delivered a written notice to ProFrac LLC and the Redeeming Members setting forth our election to exercise our right to purchase directly and acquire the Redeemed Units, together with the surrender and delivery of the same number of shares of our Class B common stock from the Redeeming Members.
We subsequently acquired the Redeemed Units from the Redeeming Members by issuing an aggregate of 101.1 million shares of Class A common stock on or about April 10, 2023 and the remaining 3.1 million shares on or about April 13, 2023. The surrendered shares of Class B common stock were canceled, and no shares of our Class B common stock remain issued and outstanding. The phrase "conversion of Class B common stock to Class A common stock" used throughout this document refers to the April 2023 transactions described above.
Activity related to the redeemable noncontrolling interest is as follows:
|
|
|
|
|
|
|
Redeemable Noncontrolling Interests |
|
Balance, December 31, 2022 |
|
$ |
2,462.9 |
|
Class A shares issued in acquisitions |
|
|
9.5 |
|
Net income |
|
|
41.8 |
|
Stock-based compensation |
|
|
2.0 |
|
Stock-based compensation related to deemed contribution |
|
|
7.3 |
|
Foreign currency translation adjustments |
|
|
0.1 |
|
Adjustment of redeemable noncontrolling interest to redemption amount (1) |
|
|
(1,210.3 |
) |
Conversion of Class B common stock to Class A common stock |
|
|
(1,313.3 |
) |
Balance, December 31, 2023 |
|
$ |
— |
|
(1)Based on 104.2 million shares of Class B common stock outstanding and the 10-day volume-weighted average price (“VWAP”) of Class A common stock of $12.60 at April 7, 2023.
2. SIGNIFICANT ACCOUNTING POLICIES
Basis of Presentation
The consolidated financial statements have been prepared in accordance with accounting principles generally accepted in the United States of America (“GAAP”) and pursuant to the rules and regulations of the Securities and Exchange Commission for annual financial information. The consolidated financial statements include the accounts of our company, all of our majority-owned subsidiaries that we control, and variable interest entities for which we have determined that we are the primary beneficiary. All significant intercompany accounts and transactions are eliminated in consolidation.
Use of Estimates
The preparation of financial statements in accordance with GAAP requires us to make estimates and assumptions that affect the reported amounts of assets and liabilities, related revenues and expenses, and the disclosure of gain and loss contingencies at the date of the financial statements and during the periods presented. We base these estimates on historical results and various other assumptions believed to be reasonable, all of which form the basis for making estimates concerning the carrying values of assets and liabilities that are not readily available from other sources. Actual results could differ materially from those estimates.
Estimates are used for, but are not limited to, determining the following: allowance for credit losses; inventory net realizable values; recoverability of long-lived assets; impairments of long-lived assets and goodwill, revenue recognition on long-term contracts; valuation of goodwill; useful lives used in depreciation, depletion and amortization; income taxes and related valuation allowances; accruals for loss contingencies; stock-based compensation expense; and the fair value of assets acquired and liabilities assumed in acquisitions.
ProFrac Holding Corp.
NOTES TO THE CONSOLIDATED FINANCIAL STATEMENTS
(Amounts in millions, except per share amounts, or where otherwise noted)
Cash and Cash Equivalents
Cash equivalents include only investments with an original maturity of three months or less. We occasionally hold cash deposits in financial institutions that exceed federally insured limits. We monitor the credit ratings and our concentration of risk with these financial institutions on a continuing basis to safeguard our cash deposits.
Restricted Cash
Cash and cash equivalents that are restricted as to withdrawal or use under the terms of certain contractual agreements, or are reserved for a specific purpose, and not readily available for immediate or general use are recorded to restricted cash and included in prepaid expenses and other current assets in our consolidated balance sheets. As of December 31, 2025 and 2024, we had no restricted cash.
Allowance for Credit Losses
We establish an allowance for credit losses to reduce the carrying value of our accounts receivable based on a number of factors, including the length of time that accounts receivable are past due, our previous loss history, and the customer’s creditworthiness. Losses are charged against the allowance when the customer accounts are determined to be uncollectible.
The following table summarizes our allowance for credit losses:
|
|
|
|
|
|
|
|
|
|
|
|
|
|
|
Year Ended December 31, |
|
|
|
2025 |
|
|
2024 |
|
|
2023 |
|
Balance at beginning of period |
|
$ |
(2.7 |
) |
|
$ |
(2.7 |
) |
|
$ |
(2.6 |
) |
Provision for credit losses, net of recoveries |
|
|
(13.7 |
) |
|
|
— |
|
|
|
(0.1 |
) |
Write-offs |
|
|
1.8 |
|
|
|
— |
|
|
|
— |
|
Balance at end of period |
|
$ |
(14.6 |
) |
|
$ |
(2.7 |
) |
|
$ |
(2.7 |
) |
Provision for credit losses in 2025 primarily related to a revised estimate of the payments to be received from an insolvent customer.
Inventories
Inventories, which consist of proppants and chemicals that are used in the hydraulic fracturing process and maintenance parts for oilfield services equipment, are carried at the lower of cost or net realizable value. Our inventory is recorded using the first-in, first-out method or average cost basis. As necessary, we record an adjustment to decrease the value of slow moving and obsolete inventory to its net realizable value. To determine the adjustment amount, we regularly review inventory quantities on hand and compare them to estimates of future product demand, market conditions, production requirements and technological developments.
Property, Plant and Equipment
Property, plant, and equipment is stated at cost less accumulated depreciation, which is generally provided by using the straight-line method over the estimated useful lives of the individual assets. We manufacture our hydraulic fracturing units and the cost of this equipment, which includes direct and indirect manufacturing costs, is capitalized, and carried as construction in progress until it is completed and placed into service. Expenditures for betterments and renewals that extend the lives of our service equipment, which includes the replacement of significant components of service equipment, are capitalized and depreciated. Other repairs and maintenance costs are expensed as incurred.
When assets are disposed or retired, the cost and accumulated depreciation are netted against any sale proceeds, and the resulting gains or losses are included in the results of operations.
Other than those assets acquired in business combinations that were recorded at their fair values upon acquisition, our property, plant and equipment are recorded at cost less accumulated depreciation, which is generally provided by using the straight-line method over the estimated useful lives of the individual assets.
|
|
|
Land |
|
Indefinite |
Machinery and equipment |
|
2 - 20 years |
Office equipment, software, and other |
|
3 - 7 years |
Buildings and leasehold improvements |
|
2 - 40 years |
ProFrac Holding Corp.
NOTES TO THE CONSOLIDATED FINANCIAL STATEMENTS
(Amounts in millions, except per share amounts, or where otherwise noted)
Depletion expense related to mining property and mine development are recorded as minerals are extracted, based on units of production and engineering estimates of mineable reserves. The impact of revisions to reserve estimates is recognized on a prospective basis.
Goodwill
Goodwill represents the excess of the purchase price over the fair value of the tangible and identifiable intangible assets acquired in a business combination. Goodwill is not amortized but is reviewed for each reporting unit for impairment annually during the fourth quarter or more frequently when events or changes in circumstances indicate that the carrying value may not be recoverable. Judgments regarding indicators of potential impairment are based on market conditions and operational performance of our business. We may assess our goodwill for impairment initially using a qualitative approach to determine whether conditions exist that indicate it is more likely than not that a reporting unit’s carrying value is greater than its fair value, and if such conditions are identified, then a quantitative analysis will be performed to determine if there is any impairment.
The changes in the carrying amount of goodwill by reportable segment were as follows:
|
|
|
|
|
|
|
|
|
|
|
|
|
|
|
|
|
|
|
|
|
|
|
Stimulation
Services |
|
|
Proppant
Production |
|
|
Manufacturing |
|
|
Other |
|
|
Total |
|
Balance, December 31, 2024 |
|
$ |
209.1 |
|
|
$ |
— |
|
|
$ |
11.2 |
|
|
$ |
81.7 |
|
|
$ |
302.0 |
|
Impairment of goodwill |
|
|
— |
|
|
|
— |
|
|
|
(11.2 |
) |
|
|
— |
|
|
|
(11.2 |
) |
Measurement period adjustments |
|
|
(0.6 |
) |
|
|
— |
|
|
|
— |
|
|
|
— |
|
|
|
(0.6 |
) |
Balance, December 31, 2025 |
|
$ |
208.5 |
|
|
$ |
— |
|
|
$ |
— |
|
|
$ |
81.7 |
|
|
$ |
290.2 |
|
The measurement period adjustment for the Stimulation Services segment related to adjustments to working capital balances
for our AST acquisition.
See “Note 5. Impairments” for discussion of our goodwill impairments.
Impairment of Long-Lived Assets
We evaluate property, plant, and equipment, operating lease right-of-use assets, and definite-lived intangible assets for impairment when events or changes in circumstances indicate that the carrying value of a long-lived asset may not be recoverable. Recoverability is assessed based on the undiscounted future cash flows generated by the asset or asset group. If the carrying amount of an asset or asset group is not recoverable, we recognize an impairment loss equal to the amount by which the carrying amount exceeds fair value. We estimate fair value based on the income, market, or cost valuation techniques.
Leases
At the inception of an arrangement or contract, we determine whether it is a lease or contains a lease. Lease classification is determined, and the lease is recognized and measured, at the lease commencement date. A right-of-use asset and the corresponding lease liability are recorded based on the present value of the remaining lease payments over the lease term. We do not include renewal or termination options in our assessment of the lease term unless the exercise of those options is deemed to be reasonably certain. We do not recognize a right-of-use asset and lease liability for leases with a term of 12 months or less. Operating lease expenses are recognized on a straight-line basis over the lease term. Assets and lease liabilities related to finance leases are classified as property, plant and equipment and debt on our consolidated balance sheets, respectively.
Revenue Recognition
Our products and services are sold based upon contracts with our customers. We recognize revenue as we satisfy our performance obligations by transferring control over a service or product to a customer. Payment terms are specified in each customer agreement and are typically a specific number of days following satisfaction of the performance obligation. We assess our customers’ ability and intention to pay based on factors such as their financial condition and our historical payment experience with them. The following are descriptions of the principal activities of each reportable segment from which we generate our revenue.
Stimulation Services. We generate revenue through the provision of hydraulic fracturing services, which involves the injection of water, sand and chemicals under high pressure into formations to optimize hydrocarbon flow paths during the completion phase of wellbores. Our contracts with customers are generally short term in nature and have a single performance obligation, which is satisfied over time. We generate a field ticket, which our customer signs, that includes
ProFrac Holding Corp.
NOTES TO THE CONSOLIDATED FINANCIAL STATEMENTS
(Amounts in millions, except per share amounts, or where otherwise noted)
charges for services performed and any inputs consumed during the service. The signing of the field ticket by the customer represents their acceptance of the service and agreement to the amounts to which we have the right to invoice and recognize as revenue.
Proppant Production. We generate revenue through the sale of frac sand to oilfield service providers and E&P companies. The performance obligation is satisfied and revenue is recognized at the point-in-time that control of the product is transferred to the customer, either upon shipment from our facility or delivery to the customer. Certain of our contracts contain multiple performance obligations to provide a minimum quantity of products to our customers in future periods. For these contracts, the transaction price is allocated to each performance obligation at estimated selling prices and we recognize revenue as we satisfy these performance obligations. At December 31, 2025, the aggregate amount of transaction price allocated to unsatisfied performance obligations was $15.0 million, and the Company expects to perform these obligations and recognize revenue of $11.3 million in 2026, $3.7 million in 2027.
Manufacturing. We generate revenue through sales of equipment used to perform oilfield services. The performance obligation is satisfied and revenues are recognized at the point-in-time that control of goods are transferred to the customer, generally upon shipment from our manufacturing facility.
Flotek. We generate revenue through sales of chemical products and equipment as well as various services associated with products sold, which includes field services, installation, maintenance, and other functions. The performance obligation for product sales is satisfied and revenues are recognized at the point-in-time that control of goods are transferred to the customer determined by agreed upon delivery terms. Revenues are recognized for services upon completion of commissioning and installation due to the short-term nature of the performance obligation.
Our contract assets are classified as accounts receivable in our consolidated balance sheets. Accounts receivable consist of invoiced amounts or amounts for which we have a right to invoice based on services completed or products delivered.
Our current and non-current contract liabilities are classified as other current liabilities and other liabilities, respectively, in our consolidated balance sheets. Our contract liabilities consist of deferred revenues from advance consideration received from customers related to future performance of service or delivery of products and off-market contract liabilities from unfavorable contracts recognized in connection with our business acquisitions in the Proppant Production segment.
In the accounting for prior business combinations, we recorded off-market contract liabilities. We recorded amortization of $7.6 million in 2025 and $43.7 million in 2024 related to these contract liabilities as revenue. As of December 31, 2025 and December 31, 2024, our off-market contract liabilities amounted to zero and $7.6 million, respectively.
We believe that disaggregating our revenue by reportable segment (see “Note 16. Business Segments”) provides the information necessary to understand the nature, amount, timing and uncertainty of our revenues and cash flows.
We have elected the practical expedient permitting the exclusion of disclosing the value of unsatisfied performance obligations for Stimulation Services and Manufacturing contracts as these contracts have original contract terms of one year or less or we have the right to invoice for services performed.
Taxes collected from customers and remitted to governmental authorities are accounted for on a net basis and are therefore excluded from revenues in the consolidated statements of operations.
Business Combinations and Asset Acquisitions
Business combinations are accounted for under the acquisition method of accounting. Under this method, the assets acquired and liabilities assumed are recognized at their respective fair values as of the date of acquisition. The excess, if any, of the acquisition price over the fair values of the assets acquired and liabilities assumed is recorded as goodwill if the definition of a business is met. For significant acquisitions, we utilize third-party appraisal firms to assist us in determining the fair values for certain assets acquired and liabilities assumed using discounted cash flows and other applicable valuation techniques. We record any acquisition related costs as expenses when incurred.
Adjustments to the fair values of assets acquired and liabilities assumed are made until we obtain all relevant information regarding the facts and circumstances that existed as of the acquisition date (the “measurement period”), not to exceed one year from the date of the acquisition. We recognize measurement-period adjustments in the period in which we determine the amounts, including the effect on earnings of any amounts we would have recorded in previous periods if the accounting had been completed at the acquisition date.
We measure asset acquisitions based on their cost to us, including transaction costs. Acquisition costs or consideration transferred in an asset acquisition are assumed to be equal to the fair value of the net assets acquired. If the consideration transferred is cash, measurement is based on the amount of cash paid to the seller, as well as transaction costs incurred.
ProFrac Holding Corp.
NOTES TO THE CONSOLIDATED FINANCIAL STATEMENTS
(Amounts in millions, except per share amounts, or where otherwise noted)
Consideration given in the form of non-monetary assets, liabilities incurred or equity interests issued is measured based on either their cost to us or the fair value of the net assets acquired, whichever is more clearly evident. The cost of an asset acquisition is allocated to the net assets acquired based on their estimated relative fair values. Goodwill is not recognized in an asset acquisition.
The estimation of the fair values of assets and liabilities acquired in business combinations or asset acquisitions requires significant judgment. Our fair value estimates require us to use significant observable and unobservable inputs. The estimates of fair value are also subject to significant variability, are sensitive to changes in market conditions, and are reasonably likely to change in the future. A significant change in the observable and unobservable inputs and determination of fair value of the assets and liabilities acquired could significantly impact our consolidated financial statements.
Variable Interest Entities
We evaluate our ownership, contractual and other interest in entities to determine if they are VIEs. We evaluate whether we have a variable interest in those entities and the nature and extent of those interests. Based on our evaluation, if we determine we are the primary beneficiary of a VIE, we consolidate the entity in our financial statements.
Stock-based Compensation
Equity-settled stock-based compensation is measured on the grant date and the fair value is recognized as expense over the requisite service period, which is generally the vesting period of the award. Cash-settled stock-based compensation is recognized as expense over the requisite service period, which is generally the vesting period of the award, and the amount of expense is adjusted to reflect the fair value of our common stock at each reporting date. We recognize forfeitures as they occur rather than estimating expected forfeitures. For awards with graded vesting based solely on the satisfaction of a service condition, we recognize compensation cost as a single award on a straight-line basis.
The fair value of time-based and performance-based equity-settled restricted stock units is determined based on the number of units granted and the closing price of our Class A Common Stock on the date of grant. Stock-based awards with market conditions are valued using a Monte Carlo simulation analysis.
Income Taxes
ProFrac Corp. is a taxable entity and is required to account for income taxes under the asset and liability method. Under the asset and liability method, deferred tax assets and liabilities are recognized for the estimated future tax consequences attributable to differences between the financial statement carrying amounts of existing assets and liabilities and their respective tax basis. Deferred tax assets and liabilities are measured using enacted tax rates in effect for the year in which those temporary differences are expected to be recovered or settled. The effect on deferred tax assets and liabilities of a change in tax rate is recognized in earnings in the period that includes the enactment date. Valuation allowances are established when necessary to reduce deferred tax assets to the amounts more-likely-than-not to be realized.
We record uncertain tax positions, if any, on the basis of a two-step process in which (1) we determine whether it is more likely than not that the tax positions will be sustained on the basis of the technical merits of the position and (2) for those tax positions that meet the more-likely-than-not recognition threshold, we recognize the largest amount of tax benefit that is more than 50 percent likely to be realized upon ultimate settlement with the related tax authority. We had no uncertain tax positions during the periods presented. We classify accrued interest and penalties associated with any unrecognized tax benefits as income tax expense.
Recently Adopted Accounting Standards
The Company has adopted FASB ASU 2023-09, Income Taxes (Topic 740): Improvements to Income Tax Disclosures, effective for the fiscal year ended December 31, 2025. This ASU enhances the transparency and decision usefulness of income tax disclosures. As a result of this adoption, the Company’s income tax disclosures now provide enhanced income tax information for the rate reconciliation and income taxes paid information. See “Note 12. Income Taxes” for the enhanced disclosures associated with the adoption of this ASU.
Recently Issued Standards Not Yet Adopted
In November 2024, the FASB issued ASU No. 2024-03, Income Statement – Reporting Comprehensive Income – Expense Disaggregation Disclosures (Subtopic 220-40): Disaggregation of Income Statement Expenses, which enhances the disclosures required for certain expense captions in the Company's annual and interim consolidated financial statements. This ASU is effective prospectively or retrospectively for fiscal years beginning after December 15, 2026, and for interim reporting periods beginning after December 15, 2027. The Company is currently evaluating the impact of this standard on our disclosures.
ProFrac Holding Corp.
NOTES TO THE CONSOLIDATED FINANCIAL STATEMENTS
(Amounts in millions, except per share amounts, or where otherwise noted)
In July 2025, the FASB issued ASU No. 2025-05, Financial Instruments --Credit Losses (Topic 326): Measurement of Credit Losses for Accounts Receivable and Contract Assets, which provides a practical expedient for calculating current expected credit losses on accounts receivable and current contract assets. This practical expedient permits a reporting entity to assume that current conditions as of the balance sheet date remain unchanged over the remaining life of the assets. The ASU is effective for the Company for annual reporting periods beginning after December 15, 2025, and interim reporting periods within those annual reporting periods. Early adoption is permitted. The Company plans to elect the practical expedient provided by the ASU and does not expect it to have a material impact on its financial statements.
3. SUPPLEMENTAL BALANCE SHEET INFORMATION
Inventories
Inventories are comprised of the following:
|
|
|
|
|
|
|
|
|
|
|
December 31, |
|
|
|
2025 |
|
|
2024 |
|
Raw materials and supplies |
|
$ |
10.8 |
|
|
$ |
16.2 |
|
Work in process |
|
|
12.4 |
|
|
|
19.7 |
|
Finished products and parts |
|
|
128.1 |
|
|
|
165.2 |
|
Total |
|
$ |
151.3 |
|
|
$ |
201.1 |
|
Property, Plant, and Equipment, Net
Property, plant and equipment, net is comprised of the following:
|
|
|
|
|
|
|
|
|
|
|
December 31, |
|
|
|
2025 |
|
|
2024 |
|
Machinery and equipment |
|
$ |
2,441.4 |
|
|
$ |
2,455.8 |
|
Mining property and mine development |
|
|
391.2 |
|
|
|
420.3 |
|
Buildings and leasehold improvements |
|
|
151.1 |
|
|
|
131.0 |
|
Land |
|
|
10.2 |
|
|
|
12.8 |
|
Office equipment, software and other |
|
|
17.3 |
|
|
|
17.0 |
|
Construction in progress |
|
|
35.3 |
|
|
|
36.7 |
|
Total |
|
|
3,046.5 |
|
|
|
3,073.6 |
|
Less: accumulated depreciation, depletion and amortization |
|
|
(1,582.2 |
) |
|
|
(1,312.4 |
) |
Property, plant, and equipment, net |
|
$ |
1,464.3 |
|
|
$ |
1,761.2 |
|
Depreciation and amortization expense related to property, plant, and equipment was $359.1 million, $386.8 million and $387.1 million in 2025, 2024 and 2023, respectively. Depletion expense was $20.8 million, $19.1 million, and $16.1 million in 2025, 2024 and 2023, respectively.
ProFrac Holding Corp.
NOTES TO THE CONSOLIDATED FINANCIAL STATEMENTS
(Amounts in millions, except per share amounts, or where otherwise noted)
Intangible Assets, Net
Intangible assets, net is comprised of the following:
|
|
|
|
|
|
|
|
|
|
|
|
|
|
|
|
|
|
|
Weighted Average Remaining Amortization period (Years) |
|
Estimated
Useful
Life (in years) |
|
Gross
Book
Value |
|
|
Less: Accumulated
Amortization |
|
|
Net Book
Value |
|
As of December 31, 2025 |
|
|
|
|
|
|
|
|
|
|
|
|
|
Acquired technology |
|
6.8 |
|
3-10 |
|
$ |
121.2 |
|
|
$ |
(39.9 |
) |
|
$ |
81.3 |
|
Tradename |
|
8.3 |
|
10 |
|
|
2.9 |
|
|
|
(0.5 |
) |
|
|
2.4 |
|
Patents/License |
|
7 |
|
8 |
|
|
5.9 |
|
|
|
(0.9 |
) |
|
|
5.0 |
|
Customer relationships |
|
1.2 |
|
4-5 |
|
|
92.5 |
|
|
|
(69.4 |
) |
|
|
23.1 |
|
Intangible assets, net |
|
5.7 |
|
|
|
$ |
222.5 |
|
|
$ |
(110.7 |
) |
|
$ |
111.8 |
|
|
|
|
|
|
|
|
|
|
|
|
|
|
|
As of December 31, 2024 |
|
|
|
|
|
|
|
|
|
|
|
|
|
Acquired technology |
|
7.9 |
|
3-10 |
|
$ |
124.7 |
|
|
$ |
(30.3 |
) |
|
$ |
94.4 |
|
Tradename |
|
9.3 |
|
10 |
|
|
2.9 |
|
|
|
(0.2 |
) |
|
|
2.7 |
|
Patents/License |
|
8 |
|
8 |
|
|
5.9 |
|
|
|
(0.2 |
) |
|
|
5.7 |
|
Customer relationships |
|
2.1 |
|
4-5 |
|
|
92.5 |
|
|
|
(46.4 |
) |
|
|
46.1 |
|
Intangible assets, net |
|
6.4 |
|
|
|
$ |
226.0 |
|
|
$ |
(77.1 |
) |
|
$ |
148.9 |
|
We amortize other identifiable intangible assets with a definite life on a straight-line basis over the estimated useful lives of the assets. Amortization expense related to intangible assets was $36.4 million, $36.3 million, and $35.2 million in 2025, 2024 and 2023, respectively.
The estimated future amortization expense related to intangible assets is $34.7 million in 2026, $13.9 million in 2027, $13.6 million in 2028, $12.9 million in 2029, $12.8 million in 2030, and $23.9 million thereafter.
Accrued Expenses
Accrued expenses are comprised of the following:
|
|
|
|
|
|
|
|
|
|
|
December 31, |
|
|
|
2025 |
|
|
2024 |
|
Employee compensation and benefits |
|
$ |
27.9 |
|
|
$ |
22.9 |
|
Sales, use, and property taxes |
|
|
16.8 |
|
|
|
21.0 |
|
Insurance |
|
|
18.2 |
|
|
|
13.2 |
|
Interest |
|
|
8.2 |
|
|
|
6.1 |
|
Income taxes |
|
|
0.7 |
|
|
|
1.9 |
|
Other |
|
|
2.2 |
|
|
|
2.1 |
|
Total accrued expenses |
|
$ |
74.0 |
|
|
$ |
67.2 |
|
ProFrac Holding Corp.
NOTES TO THE CONSOLIDATED FINANCIAL STATEMENTS
(Amounts in millions, except per share amounts, or where otherwise noted)
Other Current Liabilities
Other current liabilities are comprised of the following:
|
|
|
|
|
|
|
|
|
|
|
December 31, |
|
|
|
2025 |
|
|
2024 |
|
Accrued supply commitment charges |
|
$ |
12.6 |
|
|
$ |
12.6 |
|
Accrued legal contingencies |
|
|
5.5 |
|
|
|
7.1 |
|
Deferred revenue |
|
|
0.8 |
|
|
|
7.4 |
|
Tax receivable agreement obligation |
|
|
4.6 |
|
|
|
3.3 |
|
Acquired unfavorable contracts |
|
|
— |
|
|
|
7.6 |
|
Munger make-whole liability |
|
|
— |
|
|
|
8.6 |
|
Other |
|
|
5.3 |
|
|
|
10.0 |
|
Total other current liabilities |
|
$ |
28.8 |
|
|
$ |
56.6 |
|
4. BUSINESS COMBINATIONS AND DISPOSITIONS
2025 Disposition
In June 2025, we disposed of our EKU Power Drives subsidiary in our Manufacturing Segment. We recorded a loss of $10.5 million in connection with this disposal, which was classified as other income and expense, net on our consolidated statements of operations. Total assets decreased approximately $44.0 million and total liabilities decreased approximately $32.0 million on our consolidated balance sheet as a result of this disposal. This subsidiary recorded a pretax loss of $4.5 million in 2025, pretax income of $1.6 million in 2024, and pretax income of $1.2 million in 2023. This subsidiary recorded a net loss attributable to ProFrac Holding Corp. of $3.3 million in 2025, net income attributable to ProFrac Holding Corp. of $1.2 million in 2024, and net income attributable to ProFrac Holding Corp. of $0.6 million in 2023. This disposal will not have a major effect on our future operations and financial results.
2024 Acquisitions
In April 2024, we acquired all of the remaining equity interests of Basin Production and Completion LLC (“BPC”). BPC is the parent company of FHE USA LLC, which manufactures equipment used in the hydraulic fracturing industry. This acquisition expanded our manufacturing capabilities into new product categories. The total purchase consideration was $39.8 million, consisting of cash consideration of $14.9 million and our pre-existing equity investment of $24.9 million. In 2024, our operating results included revenues of $17.1 million and a pretax loss of $11.0 million, related to the BPC acquired operations. BPC is included in our Manufacturing reportable segment.
In June 2024, we acquired 100% of the issued and outstanding capital stock of Advanced Stimulation Technologies, Inc. (“AST”), a pressure pumping services provider serving the Permian Basin, for total purchase consideration of $173.4 million in cash. This acquisition expanded our hydraulic fracturing capabilities. For the six months ended June 30, 2024, our operating results included revenues of $15.0 million and pretax earnings of $0.1 million related to the AST acquired operations. Throughout the third quarter of 2024, we integrated AST’s operations. As a result, we track all stimulation services assets as one group and it would be impracticable to separately report AST revenues or pretax earnings subsequent to June 30, 2024. AST is included in our Stimulation Services reportable segment.
In June 2024, we acquired 100% of the issued and outstanding common stock of NRG Manufacturing, Inc., which manufactures equipment used in the hydraulic fracturing industry, and its affiliate, AMI US Holdings, Inc., which develops commercial software used in hydraulic fracturing industry (collectively “NRG”), for total purchase consideration of $6.0 million in cash. This acquisition expanded our manufacturing and maintenance capabilities. In 2024, our operating results include revenues of $9.2 million and a pretax loss of $1.0 million, related to the NRG acquired operations. NRG is included in our Manufacturing reportable segment.
ProFrac Holding Corp.
NOTES TO THE CONSOLIDATED FINANCIAL STATEMENTS
(Amounts in millions, except per share amounts, or where otherwise noted)
The following table represents our allocation of total purchase consideration of AST, BPC and NRG to the identifiable assets acquired and liabilities assumed based on the fair values on their acquisition dates:
|
|
|
|
|
|
|
|
|
|
|
|
|
|
|
AST |
|
|
BPC |
|
|
NRG |
|
Cash and cash equivalents |
|
$ |
— |
|
|
$ |
0.1 |
|
|
$ |
0.4 |
|
Accounts receivable |
|
|
26.0 |
|
|
|
5.0 |
|
|
|
1.2 |
|
Prepaid expenses and other assets |
|
|
4.0 |
|
|
|
0.3 |
|
|
|
0.3 |
|
Operating lease assets |
|
|
— |
|
|
|
1.5 |
|
|
|
10.7 |
|
Inventories |
|
|
13.1 |
|
|
|
12.2 |
|
|
|
3.9 |
|
Property, plant and equipment |
|
|
158.4 |
|
|
|
39.8 |
|
|
|
2.0 |
|
Intangible assets |
|
|
— |
|
|
|
5.8 |
|
|
|
— |
|
Total identifiable assets acquired |
|
|
201.5 |
|
|
|
64.7 |
|
|
|
18.5 |
|
Accounts payable |
|
|
13.9 |
|
|
|
6.3 |
|
|
|
1.5 |
|
Accrued expenses |
|
|
2.9 |
|
|
|
0.2 |
|
|
|
— |
|
Current portion of long-term debt |
|
|
— |
|
|
|
0.5 |
|
|
|
— |
|
Current portion of operating lease liabilities |
|
|
— |
|
|
|
0.4 |
|
|
|
1.0 |
|
Other current liabilities |
|
|
8.1 |
|
|
|
3.6 |
|
|
|
— |
|
Non-current portion of debt |
|
|
— |
|
|
|
20.4 |
|
|
|
— |
|
Deferred tax liability |
|
|
25.6 |
|
|
|
— |
|
|
|
— |
|
Operating lease liabilities |
|
|
— |
|
|
|
1.2 |
|
|
|
10.0 |
|
Other liabilities |
|
|
— |
|
|
|
1.3 |
|
|
|
— |
|
Total liabilities assumed |
|
|
50.5 |
|
|
|
33.9 |
|
|
|
12.5 |
|
Less: noncontrolling interest |
|
|
— |
|
|
|
2.2 |
|
|
|
— |
|
Goodwill |
|
|
22.4 |
|
|
|
11.2 |
|
|
|
— |
|
Total purchase consideration |
|
$ |
173.4 |
|
|
$ |
39.8 |
|
|
$ |
6.0 |
|
We generally used the cost approach to value acquired property, plant and equipment adjusted for the age, condition and utility of the associated assets. The market approach valuation technique was used for assets that had comparable market data available. The intangible assets related to the BPC acquisition represent customer relationships and a trade name. The fair value of the customer relationships was determined using the income approach, which is predicated upon the value of the future cash flows that these customers will generate over an estimated time period. The fair value of the trade name was determined using a relief from royalty methodology.
The amounts allocated to goodwill are attributable to the organized workforce and potential or expected synergies. We estimate that the goodwill acquired in the BPC acquisition will be deductible for income tax purposes.
2023 Acquisitions
On January 3, 2023, we acquired 100% of the issued and outstanding membership interest of Producers Service Holdings LLC (“Producers”), which was an employee-owned pressure pumping services provider serving Appalachia and the Mid-Continent, for a total purchase consideration of $36.5 million, consisting of (i) Class A common stock valued at $12.9 million based on the acquisition date closing price of $21.40; (ii) cash consideration of $9.7 million; and (iii) our pre-existing investment of $13.9 million. Throughout the six months ended June 30, 2023, we integrated Producers' operations. As a result, we track all stimulation services assets as one group and it would be impracticable to separately report Producers' revenues or pretax earnings subsequent to the acquisition.
On February 24, 2023, we acquired 100% of the issued and outstanding membership interests in (i) Performance Proppants, LLC, (ii) Red River Land Holdings, LLC, (iii) Performance Royalty, LLC, (iv) Performance Proppants International, LLC, and (v) Sunny Point Aggregates, LLC (together, “Performance Proppants”) for a total purchase consideration of $462.8 million, consisting of (i) Class A common stock valued at $6.2 million based on the acquisition date closing price of $19.67; (ii) cash consideration of $452.4 million; and (iii) the settlement of a pre-existing receivable of $4.2 million. Performance Proppants was a frac sand provider in the Haynesville basin. The Performance Proppants acquisition contributed revenues of $204.9 million and pretax income of $99.9 million, before intercompany eliminations, to our consolidated statement of operations for the year ended December 31, 2023. The Performance Proppants acquisition contributed revenues of $154.8 million, after intercompany eliminations, to our consolidated statement of operations for the year ended December 31, 2023.
ProFrac Holding Corp.
NOTES TO THE CONSOLIDATED FINANCIAL STATEMENTS
(Amounts in millions, except per share amounts, or where otherwise noted)
The following table represents our allocation of total purchase consideration of Producers and Performance Proppants to the identifiable assets acquired and liabilities assumed based on the fair values on their acquisition dates:
|
|
|
|
|
|
|
|
|
|
|
Producers |
|
|
Performance Proppants |
|
Cash and cash equivalents |
|
$ |
0.3 |
|
|
$ |
2.0 |
|
Accounts receivable |
|
|
6.6 |
|
|
|
17.1 |
|
Prepaid expenses and other assets |
|
|
1.1 |
|
|
|
0.6 |
|
Inventories |
|
|
2.0 |
|
|
|
7.5 |
|
Property, plant and equipment |
|
|
29.5 |
|
|
|
476.9 |
|
Intangible assets |
|
|
— |
|
|
|
5.6 |
|
Total identifiable assets acquired |
|
|
39.5 |
|
|
|
509.7 |
|
Accounts payable |
|
|
10.9 |
|
|
|
16.7 |
|
Accrued expenses |
|
|
2.8 |
|
|
|
3.3 |
|
Current portion of long-term debt |
|
|
0.2 |
|
|
|
2.1 |
|
Other current liabilities |
|
|
— |
|
|
|
49.6 |
|
Non-current portion of debt |
|
|
0.1 |
|
|
|
0.6 |
|
Other non-current liabilities |
|
|
— |
|
|
|
42.3 |
|
Total liabilities assumed |
|
|
14.0 |
|
|
|
114.6 |
|
Goodwill |
|
|
11.0 |
|
|
|
67.7 |
|
Total purchase consideration |
|
$ |
36.5 |
|
|
$ |
462.8 |
|
We generally used the cost approach to value acquired property, plant and equipment adjusted for the age, condition and utility of the associated assets. The market approach valuation technique was used for assets that had comparable market data available. Included in Performance Proppants property, plant and equipment valuation is mineral reserves valued at $248.3 million using the income approach, which is predicated upon the value of the future cash flows that an asset will generate over its economic life. The intangible assets related to the Performance Proppants acquisition represent customer relationships and the fair value was determined using the with-and-without method which is an income approach and considers the time needed to rebuild the customer base.
The amounts allocated to goodwill were attributable to the organized workforce and potential or expected synergies. The goodwill for Producers and Performance Proppants was recognized in the Stimulation Services and Proppant Production segments, respectively. We estimate that substantially all of the goodwill will be deductible for income tax purposes.
The following combined pro forma results of operations have been prepared as though the AST, BPC, NRG, Producers and Performance Proppants acquisitions had been completed on January 1, 2023. Pro forma amounts presented below are for illustrative purposes only and do not reflect future events that occurred after December 31, 2024, or any operating efficiencies or inefficiencies that may result from these significant acquisitions. The results of operations are not necessarily indicative of results that would have been achieved had we controlled AST, BPC, NRG, Producers and Performance Proppants during the periods presented.
|
|
|
|
|
|
|
|
|
|
Year Ended December 31, |
|
|
|
2024 |
|
|
2023 |
|
Revenues |
|
$ |
2,354.9 |
|
|
$ |
3,100.7 |
|
Net loss |
|
$ |
(209.8 |
) |
|
$ |
(7.4 |
) |
We incurred zero, $3.3 million and $16.2 million of costs related to acquisitions in 2025, 2024 and 2023, respectively. Acquisition costs are included in acquisition and integration costs within the consolidated statements of operations.
5. IMPAIRMENTS
Long-lived Assets Impairment
In the fourth quarter of 2025 long-lived assets held and used at a sand mine located in Merryville, Louisiana, with a total carrying value of $44.6 million were written down to their fair value of $3.2 million, resulting in an impairment charge of $41.4 million in our Proppant Production segment. This sand mine was idled in April 2024 and we have been monitoring market conditions for the mine’s service area since then. In the fourth quarter of 2025, we noted that our forecasts did not include activating the mine for at least the next 12 months based on projected sand demand in the region.
ProFrac Holding Corp.
NOTES TO THE CONSOLIDATED FINANCIAL STATEMENTS
(Amounts in millions, except per share amounts, or where otherwise noted)
BPC Goodwill Impairment
In our annual goodwill impairment test for BPC in the fourth quarter of 2025, we noted a decrease in BPC’s actual results compared with forecasted results from previous periods. We also noted a decrease in BPC’s current forecast compared to previous periods. As a result, we performed a quantitative goodwill impairment test. Based upon the results of our quantitative impairment test, we concluded that the carrying value of BPC exceeded its estimated fair value. This resulted in a goodwill impairment charge of $11.2 million for the fourth quarter of 2025, which represented all of the goodwill recorded on the BPC reporting unit.
In performing the quantitative impairment test, we determined the fair value of BPC using a combination of the income approach and the market approach. Under the income approach, the fair value for this reporting unit was determined based on the present value of estimated future cash flows, discounted at an appropriate risk-adjusted rate. Due to the inherent uncertainties involved in making estimates and assumptions, actual results and discount rates may differ from those assumed in our forecasts.
Haynesville Proppant Goodwill Impairment
In the second quarter of 2024, the reduced operating results of our Haynesville Proppant reporting unit resulted in a triggering event and, accordingly, we performed an interim quantitative impairment test. Based upon the results of our interim quantitative impairment test, we concluded that the carrying value of the Haynesville Proppant reporting unit exceeded its estimated fair value, which resulted in a goodwill impairment charge of $67.7 million for the second quarter of 2024, which represented all of the goodwill recorded on the Haynesville Proppant reporting unit.
In performing the interim quantitative impairment test, we determined the fair value of our Haynesville Proppant reporting unit using a combination of the income approach and the market approach. Under the income approach, the fair value for this reporting unit was determined based on the present value of estimated future cash flows, discounted at an appropriate risk-adjusted rate. Due to the inherent uncertainties involved in making estimates and assumptions, actual results and discount rates may differ from those assumed in our forecasts.
Permian Proppant and Eagle Ford Proppant Goodwill Impairments
In the third quarter of 2024, the reduced operating results for our Permian Proppant reporting unit and our Eagle Ford Proppant reporting unit resulted in a triggering event and, accordingly, we performed interim quantitative impairment tests. Based upon the results of our interim quantitative impairment tests, we concluded that the carrying values of the Permian Proppant and Eagle Ford Proppant reporting units exceeded their estimated fair values, which resulted in goodwill impairment charges of $2.4 million and $4.4 million, respectively, for the third quarter of 2024, which represented all of the goodwill recorded on these reporting units.
In performing the interim quantitative impairment tests, we determined the fair value of our Permian Proppant and Eagle Ford Proppant reporting units using a combination of the income approach and the market approach. Under the income approach, the fair values for these reporting units were determined based on the present value of estimated future cash flows, discounted at an appropriate risk-adjusted rate. Due to the inherent uncertainties involved in making estimates and assumptions, actual results and discount rates may differ from those assumed in our forecasts.
6. INVESTMENTS
Basin Production and Completion LLC
On February 9, 2022, we entered into an agreement to purchase all the series A-1 and B-1 preferred units of Basin Production and Completion LLC (“BPC”), for $46.0 million, consisting of $40.0 million to BPC for series A-1 and B-1 preferred units and $6.0 million to selling holders of BPC series B-1 preferred units. Additionally, on February 14, 2022, we made a loan to FHE USA LLC (“FHE”), a subsidiary of BPC for $1.25 million. The loan bears interest at the rate of 5.0% per annum. Interest is either paid at each calendar quarter end or added to the principal balance at the election of BPC. The loan matures on February 14, 2027. The total amount invested in BPC through February 9, 2022, was $51.4 million.
Subsequent to February 9, 2022, but prior to our acquisition in 2024, our investments in BPC provided us with the ability to have significant influence, but not control over BPC’s operations. We then concluded that BPC was a VIE, but we were not the primary beneficiary of the VIE. We elected the fair value option to account for our equity method investment in BPC. See “Note 15. Fair Value Measurements” for more information on our instruments using Level 3 measurements. As of December 31, 2023, the estimated fair value of our investment in BPC was $23.4 million. Our acquisition of BPC in 2024 effectively settled our investments in BPC previously measured under the fair value option. See “Note 4. Business Combinations” for further discussion of the acquisition.
ProFrac Holding Corp.
NOTES TO THE CONSOLIDATED FINANCIAL STATEMENTS
(Amounts in millions, except per share amounts, or where otherwise noted)
7. DEBT
Debt is comprised of the following:
|
|
|
|
|
|
|
|
|
|
|
December 31, |
|
|
|
2025 |
|
|
2024 |
|
ProFrac Holding Corp.: |
|
|
|
|
|
|
2029 Senior Notes |
|
$ |
570.4 |
|
|
$ |
584.2 |
|
2022 ABL Credit Facility |
|
|
69.2 |
|
|
|
139.8 |
|
Equify Notes (1) |
|
|
8.3 |
|
|
|
13.3 |
|
Finance lease obligations |
|
|
4.1 |
|
|
|
6.3 |
|
Other |
|
|
8.7 |
|
|
|
8.0 |
|
ProFrac Holding Corp. principal amount |
|
|
660.7 |
|
|
|
751.6 |
|
Less: unamortized debt discounts, premiums, and issuance costs |
|
|
(11.8 |
) |
|
|
(15.0 |
) |
Less: current portion of long-term debt |
|
|
(94.1 |
) |
|
|
(87.5 |
) |
ProFrac Holding Corp. long-term debt, net |
|
|
554.8 |
|
|
|
649.1 |
|
|
|
|
|
|
|
|
Alpine Subsidiary: |
|
|
|
|
|
|
Alpine 2023 Term Loan |
|
|
320.0 |
|
|
|
350.0 |
|
Other |
|
|
1.0 |
|
|
|
0.8 |
|
Finance lease obligations |
|
|
4.1 |
|
|
|
7.2 |
|
Alpine principal amount |
|
|
325.1 |
|
|
|
358.0 |
|
Less: unamortized debt discounts, premiums, and issuance costs |
|
|
(10.2 |
) |
|
|
(14.5 |
) |
Less: current portion of long-term debt |
|
|
(48.5 |
) |
|
|
(65.5 |
) |
Alpine long-term debt, net |
|
|
266.4 |
|
|
|
278.0 |
|
|
|
|
|
|
|
|
Flotek Subsidiary: |
|
|
|
|
|
|
Flotek ABL credit facility |
|
|
3.3 |
|
|
|
4.7 |
|
Finance lease obligations |
|
|
0.4 |
|
|
|
— |
|
Flotek PWRtek Note (1) |
|
|
40.0 |
|
|
|
— |
|
Flotek other |
|
|
— |
|
|
|
0.1 |
|
Flotek principal amount |
|
|
43.7 |
|
|
|
4.8 |
|
Less: unamortized debt discounts, premiums, and issuance costs |
|
|
(0.4 |
) |
|
|
— |
|
Less: current portion of long-term debt |
|
|
(3.5 |
) |
|
|
(4.8 |
) |
Flotek long-term debt, net |
|
|
39.8 |
|
|
|
— |
|
|
|
|
|
|
|
|
Other Subsidiaries: |
|
|
|
|
|
|
Revolving credit facility |
|
|
2.9 |
|
|
|
5.4 |
|
Finance lease obligations |
|
|
6.2 |
|
|
|
6.4 |
|
Other |
|
|
9.5 |
|
|
|
12.7 |
|
Other subsidiaries principal amount |
|
|
18.6 |
|
|
|
24.5 |
|
Less: unamortized debt discounts, premiums, and issuance costs |
|
|
(0.4 |
) |
|
|
(0.4 |
) |
Less: current portion of long-term debt |
|
|
(3.6 |
) |
|
|
(6.8 |
) |
Other subsidiaries long-term debt, net |
|
|
14.6 |
|
|
|
17.3 |
|
|
|
|
|
|
|
|
Consolidated: |
|
|
|
|
|
|
Total principal amount |
|
|
1,048.1 |
|
|
|
1,138.9 |
|
Less: unamortized debt discounts, premiums, and issuance costs |
|
|
(22.8 |
) |
|
|
(29.9 |
) |
Less: current portion of long-term debt |
|
|
(149.7 |
) |
|
|
(164.6 |
) |
Total long-term debt, net |
|
$ |
875.6 |
|
|
$ |
944.4 |
|
(1) Related party debt agreements
Senior Secured Notes Due 2029
In December 2023, ProFrac Holdings II, LLC completed an offering of $520 million of senior secured floating rate notes due in December 2029 in a private offering to qualified institutional buyers (“2029 Senior Notes”). The Company primarily used these proceeds to repay outstanding principal amounts of other existing debt. The 2029 Senior Notes were issued at a
ProFrac Holding Corp.
NOTES TO THE CONSOLIDATED FINANCIAL STATEMENTS
(Amounts in millions, except per share amounts, or where otherwise noted)
discount of $5.2 million for aggregate consideration of $514.8 million and resulted in net proceeds to the Company of $498.8 million after debt issuance costs of $16.0 million.
In June 2024, ProFrac Holdings II, LLC issued an additional $120 million aggregate principal amount of its 2029 Senior Notes at par to Beal Bank and Beal Bank USA in connection with our acquisition of AST. In 2025, ProFrac Holdings II, LLC issued an additional $60 million aggregate principal amount of its 2029 Senior Notes at par to Beal Bank USA and Wilks Brothers, LLC, which is a Wilks Party, in a private placement to fund capital expenditures with any remaining proceeds used for general corporate purposes. These notes were issued as additional notes pursuant to the original indenture as amended. These new notes and the notes previously issued under the indenture are treated as a single series of securities under the indenture and the new notes have substantially identical terms, other than the issue date, issue price and first payment date, as the existing notes and are secured by a security interest in the same collateral.
We made principal payments on our 2029 Senior Notes of $73.9 million and $55.8 million in 2025 and 2024, respectively.
The 2029 Senior Notes bear interest at an adjusted Secured Overnight Financing Rate (“Adjusted SOFR”) plus a margin of 7.25% per annum with a 2.00% Adjusted SOFR floor. The Adjusted SOFR rate is equal to the applicable Secured Overnight Financing Rate plus 0.26161% per annum. Interest is payable quarterly, in arrears, on March 31, June 30, September 30 and December 31. The effective interest rate was 12.4% as of December 31, 2025.
The 2029 Senior Notes require minimum quarterly payments including principal payments of $11.9 million on June 30, 2024, September 30, 2024, and December 31, 2024; $17.9 million on March 31, 2025 and June 30, 2025; $18.5 million on September 30, 2025; $19.6 million on December 31, 2025; and $19.6 million at the end of each calendar quarter thereafter. The 2029 Senior Notes are redeemable, at our option, beginning on January 15, 2025, at a premium of 5% through January 14, 2026. This premium declines to 2.0% through January 14, 2027, and 1.0% through January 14, 2028, after which we may redeem the 2029 Senior Notes at par value.
The obligation to pay principal and interest on the 2029 Senior Notes is jointly and severally guaranteed on a full and unconditional basis by ProFrac LLC, and subject to certain exceptions, our domestic subsidiaries other than the Alpine subsidiaries. The 2029 Senior Notes are secured on a first priority basis by substantially all of the assets of ProFrac Corp. and ProFrac LLC, and subject to certain exceptions, our domestic subsidiaries other than the Alpine subsidiaries.
The 2029 Senior Notes contain a covenant requiring us to maintain a minimum loan to value (“LTV”) ratio of 0.77 to 1.00 in 2026, and 0.75 to 1.00 thereafter. This ratio is the aggregate unpaid principal amount of the 2029 Senior Notes divided by the orderly liquidation value of our applicable assets. The 2029 Senior Notes contain covenants that could, in certain circumstances, limit our ability to issue additional debt, repurchase or pay dividends on our common or preferred stock, sell our assets, or enter into certain other transactions. We were in compliance with all of the covenants in the indenture governing our 2029 Senior Notes at December 31, 2025.
Alpine 2023 Term Loan
In December 2023, our Alpine subsidiary entered into a senior secured term loan credit agreement (the “Alpine Term Loan Credit Agreement”) that matures in January 2029, with CLMG Corp. as administrative agent and collateral agent, and the lenders party thereto, providing for a term loan of $365.0 million (the “Alpine 2023 Term Loan”). The Company primarily used these proceeds to repay outstanding principal amounts of other existing debt.
Borrowings under the Alpine 2023 Term Loan accrue interest at either an Adjusted SOFR rate or a base rate, plus an applicable margin of 7.25% per annum with a 3.00% Adjusted SOFR floor. The Adjusted SOFR rate is equal to the applicable Secured Overnight Financing Rate plus 0.11448% per annum. The effective interest rate was 12.6% as of December 31, 2025.
The Alpine 2023 Term Loan originally required minimum quarterly payments including principal payments of $5.0 million on June 30, 2024, September 30, 2024, and December 31, 2024, and $15.0 million on the last day of each calendar quarter thereafter. In June 2025, we amended the Alpine 2023 Term Loan. Under the terms of the amendment, the amortization payments required to be made on June 30, 2025, September 30, 2025 and December 31, 2025 were reduced from $15.0 million to $5.0 million and we will pay an exit fee of $3.4 million when the term loan is repaid. In December 2025, we amended the Alpine 2023 Term Loan. Under the terms of the amendment, the amortization payments required to be made on March 31, 2026 and June 30, 2026 were reduced from $15.0 million to $7.5 million.
In connection with any voluntary prepayment of the Alpine 2023 Term Loan made after December 31, 2025 through December 27, 2026, Alpine will incur a premium of 2%. This premium declines to 1.0% for voluntary prepayments made after December 27, 2026 through December 27, 2027. The Alpine 2023 Term Loan may be prepaid at par after December 27, 2027.
ProFrac Holding Corp.
NOTES TO THE CONSOLIDATED FINANCIAL STATEMENTS
(Amounts in millions, except per share amounts, or where otherwise noted)
The Alpine 2023 Term Loan is guaranteed by ProFrac Holding Corp. and all of Alpine’s subsidiaries. The Alpine 2023 Term Loan is secured by a lien on, and security interest in, substantially all of Alpine’s assets.
The Alpine 2023 Term Loan originally contained a covenant commencing with the fiscal quarter ending September 30, 2024, requiring Alpine not to exceed a maximum Total Net Leverage Ratio (as defined in the Alpine Term Loan Credit Agreement) of 2.00 to 1.00. This ratio is generally the consolidated total debt of Alpine divided by an adjusted EBITDA calculation. This covenant has been amended to commence testing compliance with the Total Net Leverage Ratio with the fiscal quarter ending on March 31, 2028. The Alpine 2023 Term Loan contains covenants that limit Alpine’s ability to issue additional debt, pay dividends or distributions, sell its assets, or enter into certain other transactions.
As a result of Alpine’s lower operating results in 2025 and 2024, Alpine is closely monitoring its forthcoming compliance obligations with the Total Net Leverage Ratio covenant. While there can be no assurance, Alpine believes that it will be able to meet, modify, or further defer this debt covenant.
Alpine was in compliance with all other covenants, and there were no existing defaults or events of default related to the Alpine 2023 Term Loan as of December 31, 2025.
2022 ABL Credit Facility
In March 2022, ProFrac LLC, ProFrac II, LLC, as borrower, and certain of the Company’s wholly owned subsidiaries as obligors, entered into a senior secured asset-based revolving credit agreement that was scheduled to expire on March 4, 2027 (as amended, the “2022 ABL Credit Facility”), with a group of lenders with JPMorgan Chase Bank N.A., as administrative agent and collateral agent. On March 3, 2026, we entered into an amendment to the 2022 ABL Credit Facility pursuant to which, among other changes, the scheduled maturity date of the facility was extended six months to September 3, 2027. See “Note 18. Subsequent Events” for additional information. The below disclosures are as of December 31, 2025, and before the March 3, 2026 amendment.
The 2022 ABL Credit Facility, as amended, provides for a maximum availability of $325.0 million. The maximum availability of credit under the 2022 ABL Credit Facility is limited at any time to the lesser of the lenders’ committed amounts or a borrowing base. The borrowing base is based on percentages of eligible accounts receivable and eligible inventory, which serve as collateral for the ABL Credit Facility, and is subject to certain reserves. Assets of our Alpine subsidiary are excluded from the borrowing base. If at any time borrowings and letters of credit issued under the credit facility exceed the borrowing base, we will be required to repay an amount equal to such excess. As of December 31, 2025, the maximum availability under the ABL credit facility was limited to our eligible borrowing base of $220.4 million with $69.2 million of borrowings outstanding and $15.8 million of letters of credit outstanding, resulting in approximately $135.4 million of remaining availability.
Borrowings under the 2022 ABL Credit Facility accrue interest at either a SOFR rate or a base rate, plus an applicable margin. The applicable margin for SOFR rate loans ranges from 1.5% to 2.0% and for base rate loans ranges from 0.5% to 1.0%. The 2022 ABL Credit Facility bears an unused line fee ranging from 0.250% to 0.375%. The effective interest rate was 7.5% as of December 31, 2025.
We are required by the 2022 ABL Credit Facility to maintain minimum liquidity of $15.0 million at all times. If the amount available under the 2022 ABL Credit Facility is less than the greater of 12.5% of our maximum availability or $30.0 million, we will be required to maintain a minimum fixed charge coverage ratio of 1.0 to 1.0, to the extent such conditions continue for at least five consecutive business days, and we will be subject to the cash dominion provisions under the agreement.
The 2022 ABL Credit Facility contains certain customary representations and warranties and affirmative and negative covenants. The negative covenants include, subject to customary exceptions, limitations on indebtedness, dividends, distributions and certain other payments, investments, acquisitions, prepayments of specified junior indebtedness, amendments of specified junior indebtedness, transactions with affiliates, dispositions, mergers and consolidations, liens, restrictive agreements, sale and leaseback transactions, changes in fiscal periods and changes in line of business. The Company was in compliance with all covenants, and there were no existing defaults or events of default related to the 2022 ABL Credit Facility as of December 31, 2025.
Equify Notes
In connection with an acquisition in 2022, we assumed two equipment financing notes with Equify Financial, LLC, a related party to the Company controlled by the Wilks Parties. At acquisition, these notes had principal balances of $11.9 million and $12.3 million, have terms through August 2027 and October 2027, and bear interest at an annual rate of 14.8% and 15.5%, respectively. The Equify Notes were initially measured at fair value in connection with the acquisition, resulting in recording a debt premium of $3.6 million. We amortize such premium as an adjustment to interest expense using the effective interest
ProFrac Holding Corp.
NOTES TO THE CONSOLIDATED FINANCIAL STATEMENTS
(Amounts in millions, except per share amounts, or where otherwise noted)
method over the term of the Equify Notes. As of December 31, 2025, the effective interest rates on the Equify Notes were 3.4% and 4.2%. These notes are collateralized by certain equipment in our Stimulation Services segment.
Flotek PWRtek Note
In April 2025, Flotek acquired certain gas conditioning equipment from our Stimulation Services segment for total consideration of $107.5 million and our Stimulation Services segment leased these assets back from Flotek for a six year term. The effects of this sale-leaseback transaction have been eliminated from our consolidated financial statements. Part of the $107.5 million consideration was a $40.0 million intercompany note payable from Flotek to our Stimulation Services segment (“Flotek PWRtek Note”). In November 2025, the Stimulation Services segment agreed to assign this note receivable to PC Energy Credit I, LLC, a related party to the Company controlled by the Wilks Parties, in exchange for cash consideration of $40.4 million, which represented the sum of the unpaid principal amount of the note and all accrued and unpaid interest on the note through the closing date.
The Flotek PWRtek Note matures on April 28, 2030, and bears interest at an annual rate of 10%. Interest is payable quarterly, in arrears, on January 1, April 1, July 1 and October 1. Interest payments may be paid in cash or in-kind and added to the principal amount outstanding of the note. The effective interest rate was 10.2% as of December 31, 2025.
The Flotek PWRtek Note may be prepaid, at our option, at a premium. This premium is determined by calculating the net present value of the interest that would be owed on the prepayment principal amount through the maturity date. This premium no longer applies if Flotek declares a certain level of dividend.
The obligation to pay principal and interest on the Flotek PWRtek Note is jointly and severally guaranteed on a full and unconditional basis by Flotek. The Flotek PWRtek Note is secured by certain assets of Flotek.
The Flotek PWRtek Note contains covenants that could, in certain circumstances, limit Flotek’s ability to issue additional debt, repurchase or pay dividends on its common stock, sell its assets, or enter into certain other transactions. Flotek was in compliance with all of the covenants in the Flotek PWRtek Note at December 31, 2025.
Restricted Assets
Our Alpine 2023 Term Loan requires us to segregate collateral associated with Alpine and limits our ability to use Alpine's cash or assets to satisfy our obligations or the obligations of our other subsidiaries. We also have limited ability to provide Alpine with liquidity to satisfy its obligations. See “Note 16. Business Segments” for certain financial information for Alpine, which is our Proppant Production segment.
ProFrac Holding Corp.
NOTES TO THE CONSOLIDATED FINANCIAL STATEMENTS
(Amounts in millions, except per share amounts, or where otherwise noted)
Maturities of Debt
As of December 31, 2025, the principal maturity schedule for our debt outstanding is as follows:
|
|
|
|
|
|
|
|
|
|
|
|
|
|
|
|
|
|
|
|
|
|
|
|
|
|
|
|
|
|
|
2026 |
|
|
2027 |
|
|
2028 |
|
|
2029 |
|
|
2030 |
|
|
Thereafter |
|
|
Total |
|
ProFrac Holding Corp.: |
|
|
|
|
|
|
|
|
|
|
|
|
|
|
|
|
|
|
|
|
|
2029 Senior Notes |
|
|
78.4 |
|
|
|
78.5 |
|
|
|
78.5 |
|
|
|
335.0 |
|
|
|
— |
|
|
|
— |
|
|
|
570.4 |
|
2022 ABL Credit Facility |
|
|
— |
|
|
|
69.2 |
|
|
|
— |
|
|
|
— |
|
|
|
— |
|
|
|
— |
|
|
|
69.2 |
|
Equify Notes (1) |
|
|
5.0 |
|
|
|
3.3 |
|
|
|
— |
|
|
|
— |
|
|
|
— |
|
|
|
— |
|
|
|
8.3 |
|
Finance lease obligations |
|
|
2.0 |
|
|
|
1.8 |
|
|
|
0.3 |
|
|
|
— |
|
|
|
— |
|
|
|
— |
|
|
|
4.1 |
|
Other |
|
|
8.7 |
|
|
|
— |
|
|
|
— |
|
|
|
— |
|
|
|
— |
|
|
|
— |
|
|
|
8.7 |
|
ProFrac Holding Corp. principal amount |
|
|
94.1 |
|
|
|
152.8 |
|
|
|
78.8 |
|
|
|
335.0 |
|
|
|
— |
|
|
|
— |
|
|
|
660.7 |
|
|
|
|
|
|
|
|
|
|
|
|
|
|
|
|
|
|
|
|
|
|
|
Alpine Subsidiary: |
|
|
|
|
|
|
|
|
|
|
|
|
|
|
|
|
|
|
|
|
|
Alpine 2023 Term Loan |
|
|
45.0 |
|
|
|
60.0 |
|
|
|
60.0 |
|
|
|
155.0 |
|
|
|
— |
|
|
|
— |
|
|
|
320.0 |
|
Other |
|
|
0.5 |
|
|
|
0.4 |
|
|
|
0.1 |
|
|
|
— |
|
|
|
— |
|
|
|
— |
|
|
|
1.0 |
|
Finance lease obligations |
|
|
3.0 |
|
|
|
0.9 |
|
|
|
0.2 |
|
|
|
— |
|
|
|
— |
|
|
|
— |
|
|
|
4.1 |
|
Alpine principal amount |
|
|
48.5 |
|
|
|
61.3 |
|
|
|
60.3 |
|
|
|
155.0 |
|
|
|
— |
|
|
|
— |
|
|
|
325.1 |
|
|
|
|
|
|
|
|
|
|
|
|
|
|
|
|
|
|
|
|
|
|
|
Flotek Subsidiary: |
|
|
|
|
|
|
|
|
|
|
|
|
|
|
|
|
|
|
|
|
|
Flotek ABL credit facility |
|
|
3.3 |
|
|
|
— |
|
|
|
— |
|
|
|
— |
|
|
|
— |
|
|
|
— |
|
|
|
3.3 |
|
Finance lease obligations |
|
|
0.2 |
|
|
|
0.2 |
|
|
|
— |
|
|
|
— |
|
|
|
— |
|
|
|
— |
|
|
|
0.4 |
|
Flotek PWRtek Note (1) |
|
|
— |
|
|
|
— |
|
|
|
— |
|
|
|
— |
|
|
|
40.0 |
|
|
|
— |
|
|
|
40.0 |
|
Flotek principal amount |
|
|
3.5 |
|
|
|
0.2 |
|
|
|
— |
|
|
|
— |
|
|
|
40.0 |
|
|
|
— |
|
|
|
43.7 |
|
|
|
|
|
|
|
|
|
|
|
|
|
|
|
|
|
|
|
|
|
|
|
Other Subsidiaries: |
|
|
|
|
|
|
|
|
|
|
|
|
|
|
|
|
|
|
|
|
|
Revolving credit facility |
|
|
2.9 |
|
|
|
— |
|
|
|
— |
|
|
|
— |
|
|
|
— |
|
|
|
— |
|
|
|
2.9 |
|
Finance lease obligations |
|
|
0.3 |
|
|
|
0.3 |
|
|
|
0.3 |
|
|
|
0.3 |
|
|
|
0.4 |
|
|
|
4.6 |
|
|
|
6.2 |
|
Other |
|
|
0.4 |
|
|
|
0.4 |
|
|
|
0.5 |
|
|
|
0.5 |
|
|
|
0.5 |
|
|
|
7.2 |
|
|
|
9.5 |
|
Other subsidiaries principal amount |
|
|
3.6 |
|
|
|
0.7 |
|
|
|
0.8 |
|
|
|
0.8 |
|
|
|
0.9 |
|
|
|
11.8 |
|
|
|
18.6 |
|
|
|
|
|
|
|
|
|
|
|
|
|
|
|
|
|
|
|
|
|
|
|
Total principal amount |
|
$ |
149.7 |
|
|
$ |
215.0 |
|
|
$ |
139.9 |
|
|
$ |
490.8 |
|
|
$ |
40.9 |
|
|
$ |
11.8 |
|
|
$ |
1,048.1 |
|
(1) Related party debt agreements
ProFrac Holding Corp.
NOTES TO THE CONSOLIDATED FINANCIAL STATEMENTS
(Amounts in millions, except per share amounts, or where otherwise noted)
8. LEASES
Our leasing arrangements consist of both operating and finance leases. We are a lessee on several leases of real estate, administrative offices, manufacturing and maintenance facilities, heavy duty equipment, light duty vehicles, tractors, and power generation equipment. We do not have any material lessor arrangements.
Immediately subsequent to the AST acquisition, AST conveyed to the Wilks Parties substantially all of AST’s owned real property in exchange for cash consideration of approximately $23 million. We now lease such real property from the Wilks Parties in exchange for aggregate monthly lease payments totaling $30.2 million through May 2034. The cash consideration received was equal to the carrying value of these assets. This lease is accounted for as an operating lease.
In December 2024, we sold certain stimulation service equipment to the Wilks Parties in exchange for cash consideration of approximately $40.0 million. We now lease such equipment from the Wilks Parties in exchange for aggregate monthly lease payments totaling $44.8 million through December 2028. The cash consideration received was $26.5 million more than the carrying value of these assets. Because this sale was to an affiliate under common control, we accounted for the $26.5 million as an equity transaction recorded as a deemed contribution within our consolidated statements of changes in equity. This lease is accounted for as an operating lease.
Our finance lease balances are as follows:
|
|
|
|
|
|
|
|
|
|
|
|
|
|
|
December 31, |
|
|
|
Consolidated Balance Sheet Location |
|
2025 |
|
|
2024 |
|
Assets: |
|
|
|
|
|
|
|
|
Finance lease right-of-use assets |
|
Property, plant, and equipment, net |
|
$ |
14.4 |
|
|
$ |
19.4 |
|
Liabilities: |
|
|
|
|
|
|
|
|
Current portion of finance lease liabilities |
|
Current portion of long-term debt |
|
$ |
5.5 |
|
|
$ |
7.7 |
|
Finance lease liabilities |
|
Long-term debt |
|
$ |
9.3 |
|
|
$ |
12.2 |
|
The components of our lease costs are as follows:
|
|
|
|
|
|
|
|
|
|
|
|
|
|
|
Year Ended December 31, |
|
|
|
2025 |
|
|
2024 |
|
|
2023 |
|
Operating lease costs |
|
$ |
60.2 |
|
|
$ |
36.9 |
|
|
$ |
45.8 |
|
Short-term lease costs |
|
|
27.0 |
|
|
|
27.7 |
|
|
|
32.3 |
|
Finance lease costs: |
|
|
|
|
|
|
|
|
|
Amortization of right-of-use assets |
|
|
7.6 |
|
|
|
7.3 |
|
|
|
5.1 |
|
Interest on lease liabilities |
|
|
1.0 |
|
|
|
1.2 |
|
|
|
1.0 |
|
Total lease costs |
|
$ |
95.8 |
|
|
$ |
73.1 |
|
|
$ |
84.2 |
|
The weighted-average remaining lease term and discount rates used in the measurement of our right-of-use assets and lease liabilities are as follows:
|
|
|
|
|
|
|
|
|
|
|
|
|
|
|
Year Ended December 31, |
|
|
|
2025 |
|
|
2024 |
|
|
2023 |
|
Weighted-average remaining lease term: |
|
|
|
|
|
|
|
|
|
Operating leases |
|
4.4 years |
|
|
5.9 years |
|
|
6.4 years |
|
Finance leases |
|
6.6 years |
|
|
6.3 years |
|
|
3.7 years |
|
Weighted average discount rate: |
|
|
|
|
|
|
|
|
|
Operating leases |
|
|
8.8 |
% |
|
|
8.1 |
% |
|
|
5.9 |
% |
Finance leases |
|
|
6.7 |
% |
|
|
5.5 |
% |
|
|
7.8 |
% |
ProFrac Holding Corp.
NOTES TO THE CONSOLIDATED FINANCIAL STATEMENTS
(Amounts in millions, except per share amounts, or where otherwise noted)
The following table includes other supplemental information for our leases:
|
|
|
|
|
|
|
|
|
|
|
|
|
|
|
Year Ended December 31, |
|
|
|
2025 |
|
|
2024 |
|
|
2023 |
|
Cash paid for amounts included in the measurement of lease obligations: |
|
|
|
|
|
|
|
|
|
Operating leases |
|
$ |
61.6 |
|
|
$ |
37.6 |
|
|
$ |
46.4 |
|
Finance leases |
|
$ |
8.9 |
|
|
$ |
8.4 |
|
|
$ |
6.2 |
|
Right-of-use assets obtained in exchange for new lease obligations: |
|
|
|
|
|
|
|
|
|
Operating leases |
|
$ |
34.7 |
|
|
$ |
103.4 |
|
|
$ |
11.9 |
|
Finance leases |
|
$ |
2.6 |
|
|
$ |
9.9 |
|
|
$ |
8.6 |
|
As of December 31, 2025, the future maturities of our lease liabilities are as follows:
|
|
|
|
|
|
|
|
|
Fiscal Year |
|
Operating Leases |
|
|
Finance Leases |
|
2026 |
|
$ |
56.3 |
|
|
$ |
6.2 |
|
2027 |
|
|
50.4 |
|
|
|
3.8 |
|
2028 |
|
|
33.1 |
|
|
|
1.1 |
|
2029 |
|
|
13.5 |
|
|
|
0.6 |
|
2030 |
|
|
12.4 |
|
|
|
0.6 |
|
Thereafter |
|
|
24.2 |
|
|
|
5.7 |
|
Total lease payments |
|
|
189.9 |
|
|
|
18.0 |
|
Less imputed interest |
|
|
(29.6 |
) |
|
|
(3.2 |
) |
Total lease liabilities |
|
$ |
160.3 |
|
|
$ |
14.8 |
|
9. EQUITY
Preferred Stock
In September 2023, we issued and sold 50,000 shares of Series A preferred stock, par value $0.01 per share (the "Preferred Stock"), to two entities controlled by the Wilks Parties. The Preferred Stock was sold for aggregate consideration of $50.0 million, and resulted in net proceeds to the Company of $48.9 million after the payment of $1.1 million in issuance costs.
The Preferred Stock ranks senior to our common stock with respect to dividend rights and distribution rights in the event of any liquidation, winding-up or dissolution of the Company. The amount that each share of Preferred Stock is entitled to in liquidation is equal to a liquidation preference. The liquidation preference initially equals the original issue price per share of $1,000.00 for each share of Preferred Stock and is increased as the result of any paid-in-kind dividends (“Liquidation Preference”).
Whether or not declared by the board of directors and whether or not there are funds legally available for the payment of dividends, holders of outstanding shares of Preferred Stock shall be entitled to cumulative paid-in-kind dividends at a rate per share equal to an annual rate of 8% on the then-applicable Liquidation Preference. Such dividends shall compound and be payable quarterly in arrears.
The Preferred Stock holders have the option to convert each Preferred Stock share into shares of our common stock at a conversion ratio. The conversion ratio is defined as the Liquidation Preference as of the date of the conversion divided by the conversion price of $20.00, where such conversion price is subject to adjustment upon the occurrence of specified events set forth under terms of the Preferred Stock. At December 31, 2025, the Preferred Stock was convertible into 3.0 million common shares.
The Preferred Stock is redeemable at the Company's option at any time. The redemption price per share is an amount in cash equal to the Liquidation Preference as of the date of redemption multiplied by 1.15 (“Redemption Amount”). As of December 31, 2025, the Redemption Amount of the Preferred Stock would be $68.8 million.
Upon a change of control, the Company will have the option to convert the Preferred Stock into common shares or to redeem the Preferred Stock for cash.
If the Company elects to convert the Preferred Stock into common shares, it will do so at a conversion rate equal to the greater of:
ProFrac Holding Corp.
NOTES TO THE CONSOLIDATED FINANCIAL STATEMENTS
(Amounts in millions, except per share amounts, or where otherwise noted)
•The Liquidation Preference divided by $10.95, or
•The Liquidation Preference divided by the 30-day volume-weighted average price (“VWAP”) of our common stock at the public announcement of the change of control transaction.
If the Company elects to redeem the Preferred Stock for cash, it will pay out the greater of (1) the Liquidation Preference as of the date of such payment or (2) the amount such holder would receive in the change of control transaction if such share of Preferred Stock had been converted into a number of shares of common stock equal to the greater of:
•The Liquidation Preference divided by $20.00 (which is subject to adjustment upon the occurrence of specified events set forth under the terms of the Preferred Stock), and
•The Liquidation Preference divided by the 30-day VWAP of our common stock at the change of control date.
The holders of the Preferred Stock are also common stockholders of the Company and collectively control our board of directors. Therefore, the Preferred Stock holders could direct the Company to redeem the Preferred Stock at any time. As a result, we have classified the Preferred Stock as mezzanine equity on our consolidated balance sheets and have measured its carrying value at its maximum redemption value with a corresponding charge to retained earnings.
Class A Common Stock
In August 2025, we issued 20.6 million shares of Class A common stock, par value $0.01 per share at an offering price of $4.00 per share. The issuance of these shares generated net proceeds of $79.0 million, after deducting underwriter discounts and commissions and offering costs. The Wilks Parties bought 5.0 million shares of these Class A common stock, generating $20.0 million of gross proceeds. We used the net proceeds from this offering to repay borrowings outstanding under our 2022 ABL Credit Facility, to pursue potential investment opportunities and for working capital and other general corporate purposes.
10. OTHER OPERATING EXPENSE, NET
Other operating expense, net is comprised of the following:
|
|
|
|
|
|
|
|
|
|
|
|
|
|
|
Year Ended December 31, |
|
|
|
2025 |
|
|
2024 |
|
|
2023 |
|
Litigation expenses and accruals for legal contingencies |
|
$ |
11.0 |
|
|
$ |
15.7 |
|
|
$ |
34.1 |
|
Provision for credit losses, net of recoveries |
|
|
13.7 |
|
|
|
— |
|
|
|
0.1 |
|
Loss (gain) on insurance recoveries |
|
|
0.3 |
|
|
|
(4.9 |
) |
|
|
— |
|
Transaction costs |
|
|
8.0 |
|
|
|
3.9 |
|
|
|
— |
|
Lease termination |
|
|
1.1 |
|
|
|
— |
|
|
|
— |
|
Severance charges |
|
|
0.4 |
|
|
|
2.5 |
|
|
|
1.1 |
|
(Gain) loss on disposal of assets |
|
|
18.1 |
|
|
|
0.3 |
|
|
|
(1.7 |
) |
Inventory write-down |
|
|
0.8 |
|
|
|
— |
|
|
|
— |
|
Supply commitment charge |
|
|
— |
|
|
|
9.6 |
|
|
|
— |
|
Acquisition earnout adjustments |
|
|
— |
|
|
|
— |
|
|
|
(6.6 |
) |
Total |
|
$ |
53.4 |
|
|
$ |
27.1 |
|
|
$ |
27.0 |
|
Litigation expenses and accruals for legal contingencies generally represent legal and professional fees incurred in significant litigation as well as estimates for loss contingencies with regards to certain vendor disputes and litigation matters. In 2025, substantially all of these costs represent litigation costs incurred in connection with certain patent infringement lawsuits. In 2024, substantially all of these costs represent litigation costs incurred in connection with certain patent infringement lawsuits with Halliburton Company, which were settled in September 2024. In 2023 more than half of these costs were related to litigation costs incurred in connection with the lawsuits against Halliburton.
Provision for credit losses in 2025 primarily related to a revised estimate of the payments to be received from an insolvent customer.
Gain on insurance recoveries consists of insurance proceeds received for accidentally damaged or destroyed equipment in excess of its carrying value.
ProFrac Holding Corp.
NOTES TO THE CONSOLIDATED FINANCIAL STATEMENTS
(Amounts in millions, except per share amounts, or where otherwise noted)
Transaction costs in 2025 represent legal and professional fees incurred for strategic initiatives. Transaction costs for 2024 represent deferred costs incurred for Alpine's initial public offering that were charged to earnings as a result of its postponement.
Severance charges related to the departure of certain highly-compensated employees.
Gain or loss on disposal of assets, net consists of gains or losses on excess property, early equipment failures, and other asset dispositions. In 2025, loss on disposal of assets included the scrapping of certain equipment that was determined to be uneconomical to repair.
Inventory write-down for 2025 was recorded to reduce the inventory held at our Merryville sand mine to its net realizable value. See "Note 5. Impairments" for discussion of the impairment of long-lived assets at our Merryville sand mine.
Supply commitment charges for 2024 represent charges related to contractual inventory purchase commitments to certain proppant suppliers. These charges were attributable to our decreased volume of purchases from these suppliers due to certain customers decreasing their activity levels.
The acquisition earnout adjustments represent a decrease in the fair value of the contingent consideration related to our acquisition of REV in December 2022.
11. STOCK-BASED COMPENSATION
The compensation cost charged against income for all stock-based compensation was $10.4 million, $7.3 million, and $29.8 million in 2025, 2024, and 2023, respectively and was classified as selling, general, and administrative expenses in our consolidated statements of operations. The total income tax benefit for all stock-based compensation was $1.4 million, $0.3 million and $0.2 million in 2025, 2024, and 2023 respectively; however, such benefit was substantially offset by the valuation allowance against our deferred tax assets.
Long Term Incentive Plan
In May 2022, we adopted the ProFrac Holding Corp. 2022 Long Term Incentive Plan (“2022 Plan”) to attract and retain officers, employees, directors, and other key personnel and to provide those persons incentives and awards for performance. The 2022 Plan originally allocated 3,120,708 shares of our Class A Common Stock in the form of incentive stock options, non-qualified stock options, restricted stock, restricted stock units (“RSUs”), stock appreciation rights, or other stock-based awards. As of December 31, 2025, up to 756,173 shares were available for future grants under the 2022 Plan.
Pursuant to the 2022 Plan, we have granted time-based vesting RSUs to certain employees and directors. The RSUs granted generally vest over one to three years from the grant date. RSUs are generally equity awards settled in stock for directors and executive officers of the company and liability awards settled in cash for other employees. In 2025, the Company elected to pay cash to settle vested equity RSUs for our executive officers. The Company currently intends to settle future vested executive officer awards in cash until more shares are authorized under the 2022 Plan. As a result, outstanding equity awards for executive officers were considered modified to liability awards and awards granted to executive officers in 2025 were classified as liability awards upon grant. The grant date fair value of equity RSUs is determined using the closing price of our Class A Common Stock on the grant date.
The following table summarizes the current year activity related to our time-based vesting RSUs:
|
|
|
|
|
|
|
|
|
|
|
|
|
|
|
Liability Awards |
|
|
Equity Awards |
|
|
|
RSU's |
|
|
RSU's |
|
|
Grant Date Weighted-
Average Fair Value per
Unit |
|
Unvested balance at December 31, 2024 |
|
|
— |
|
|
|
440,053 |
|
|
$ |
9.74 |
|
Vested |
|
|
— |
|
|
|
(239,144 |
) |
|
|
10.36 |
|
Reclassified to liability award |
|
|
200,909 |
|
|
|
(200,909 |
) |
|
|
9.01 |
|
Granted |
|
|
621,691 |
|
|
|
94,580 |
|
|
|
7.93 |
|
Forfeited |
|
|
(53,722 |
) |
|
|
(18,916 |
) |
|
|
7.93 |
|
Unvested balance at December 31, 2025 |
|
|
768,878 |
|
|
|
75,664 |
|
|
$ |
7.93 |
|
ProFrac Holding Corp.
NOTES TO THE CONSOLIDATED FINANCIAL STATEMENTS
(Amounts in millions, except per share amounts, or where otherwise noted)
Stock-based compensation expense for these RSUs was $2.7 million, $5.9 million, and $9.3 million in 2025, 2024 and 2023, respectively. The weighted-average grant-date fair value per share of equity RSUs granted was $7.93, $8.61, and $11.94 in 2025, 2024 and 2023, respectively. The weighted-average fair value of equity RSUs vested was $10.36 and $12.10 in 2025 and 2024, respectively. As of December 31, 2025, there was $3.1 million of total unrecognized compensation cost related to unvested RSUs, which is expected to be recognized over a weighted average period of 1.6 years. As of December 31, 2025, we recorded a liability of $0.9 million for liability RSUs. The amount of cash paid to settled vested liability RSUs was zero in 2025, 2024 and 2023. The amount of cash paid to settle vested equity RSUs was $0.9 million in 2025.
Pursuant to the 2022 Plan, the Company authorized performance-based vesting RSUs (“PRSU”) to our executive officers. The PRSUs that met the definition of having a grant date for accounting purposes have a service component that vests over one to three years from the grant date and multiple performance conditions. The Company currently intends to settle future vested executive officer awards in cash until more shares are authorized under the 2022 Plan. As a result, awards granted to executive officers in 2025 were classified as liability awards upon grant. The performance conditions are based on an earnings metric and a cash flow metric and have an achievement range of 0% to 200% of the PRSUs granted. We recognize stock-based compensation expense for the awards we estimate will ultimately vest under the performance conditions. The grant date fair value of equity PRSUs is determined using the closing price of our Class A Common Stock on the grant date.
The following table summarizes the current year activity related to our performance-based vesting RSUs:
|
|
|
|
|
|
|
|
|
|
|
|
|
|
|
Liability Awards |
|
|
Equity Awards |
|
|
|
PRSU's |
|
|
PRSU's |
|
|
Grant Date Weighted-
Average Fair Value per
Unit |
|
Unvested balance at December 31, 2024 |
|
|
— |
|
|
|
20,916 |
|
|
$ |
9.16 |
|
Granted |
|
|
446,104 |
|
|
|
— |
|
|
|
|
Vested |
|
|
(24,543 |
) |
|
|
(6,610 |
) |
|
|
9.14 |
|
Reclassified to liability award |
|
|
3,580 |
|
|
|
(3,580 |
) |
|
|
9.16 |
|
Performance adjustment |
|
|
(363,773 |
) |
|
|
— |
|
|
|
|
Forfeited |
|
|
(23,114 |
) |
|
|
(10,726 |
) |
|
|
9.18 |
|
Unvested balance at December 31, 2025 |
|
|
38,254 |
|
|
|
— |
|
|
|
|
Stock-based compensation expense for these PRSUs was $0.3 million and $0.1 million in 2025 and 2024 respectively. The weighted-average grant-date fair value per share of equity PRSUs granted was zero, $9.16 and $12.65 in 2025, 2024 and 2023, respectively. The weighted-average fair value of equity PRSUs vested was $9.14 in 2025 and zero in 2024 and 2023. As of December 31, 2025, there was $0.3 million of total unrecognized compensation cost related to unvested PRSUs, which is expected to be recognized over a weighted average period of 1.9 years. As of December 31, 2025, we recorded a liability of $0.3 million for liability PRSUs. The amount of cash paid to settle vested liability PRSUs was $0.1 million in 2025 and zero in 2024 and 2023. The amount of cash paid to settle vested equity PRSUs was zero million in 2025.
Flotek Stock-Based Compensation
Flotek stockholders have approved long-term incentive plans under which Flotek may grant equity awards to officers, key employees, non-employee directors and service providers in the form of stock options, restricted stock, restricted stock units, and certain other incentive awards. Stock-based compensation expense related to Flotek awards was $2.3 million, $0.8 million and $0.3 million in 2025, 2024 and 2023, respectively. As of December 31, 2025, there was $5.5 million of unrecognized compensation cost for Flotek equity awards, which is expected to be recognized over a weighted-average period of 1.6 years.
Wilks Brothers, LLC Management Fee
In 2025, the Company and Wilks Brothers, LLC agreed to settle the second, third and fourth quarter management fee payments in shares of common stock. The number of shares of common stock to be issued is calculated by dividing the quarterly management fee by the 10-day VWAP for the common stock at the end of each quarter. Approximately $5.0
ProFrac Holding Corp.
NOTES TO THE CONSOLIDATED FINANCIAL STATEMENTS
(Amounts in millions, except per share amounts, or where otherwise noted)
million of stock-based compensation expense was recognized in 2025 related to this agreement. The number of shares to be issued under this agreement is 1.1 million shares.
Stock-based Compensation Related to Deemed Contributions
In connection with the Company’s IPO, our majority shareholders, Farris Wilks (“Farris”) and Dan Wilks (“Dan”) (together with certain family members or entities they control), sold Units representing approximately 1% of the equity interest in ProFrac LLC to an entity controlled by our Chief Executive Officer, Ladd Wilks (“Ladd”), and our Executive Chairman, Matt Wilks (“Matt”), respectively. These equity interests in ProFrac LLC entitled each of Ladd and Matt to 1,220,978 shares of Class B Common Stock in ProFrac Corp. These Units were sold in exchange for promissory notes. While some of the documentation relating to these transfers was subject to completion, we concluded that both transactions were consummated in connection with the Company’s IPO and, for accounting purposes, should be treated in accordance with ASC Topic 718, Compensation — Stock Compensation, as deemed contributions to the Company by Farris and Dan and grants of stock-based compensation to Ladd and Matt by the Company similar to stock options. As no future service period was required and because the promissory notes are prepayable at any time, all related stock-based compensation expense was recognized in the second quarter of 2022. The stock-based compensation expense was $33.7 million using the Black-Scholes-Merton option-pricing model with an average contractual term of 16.5 years, a volatility rate of 64%, and a 0% dividend yield.
Also in connection with the IPO, Farris engaged in estate planning that may result, subject to other terms and conditions, in additional shares being transferred by Farris to Ladd if the Company’s total market capitalization increases to certain target levels within the next five years, which resulted in a performance award being deemed granted by the Company to Ladd. We concluded that this arrangement should be treated, for accounting purposes, in accordance with ASC Topic 718, Compensation — Stock Compensation, as a deemed contribution to the Company by a related party and the grant of stock-based compensation with market conditions to Ladd by the Company.
The grant date fair value of this award was estimated to be $45.3 million and was recognized over the estimated derived service period of approximately one year. The grant date fair value and the derived service period of this award was determined using a Monte Carlo simulation method, which incorporates the possibility that the market capitalization targets may not be satisfied. The Monte Carlo simulation is affected by a number of variables, including the fair value of our underlying common shares ($18.00 at grant date), the expected common share price volatility over the expected term (79.2%), the expected dividend yield of our common shares over the expected term (0.0%), the risk-free interest rates over the expected term (2.86%), and the performance period of the award (five years).
The derived service period for the award was determined based on the median vesting time for the simulations that achieved the vesting hurdle. Stock-based compensation expense associated with this award was recognized over the derived service period. Stock-based compensation expense for this award was $19.7 million in 2023. As of December 31, 2023 and thereafter, there was no unrecognized compensation cost related to this award.
12. INCOME TAXES
ProFrac Corp. is a taxable entity and is required to account for income taxes under the asset and liability method. In connection with the Redemption in April 2023, ProFrac LLC became wholly owned by ProFrac Corp. In 2024, we effectuated a legal entity reorganization that resulted in ProFrac LLC becoming a disregarded entity for U.S. federal income tax purposes. As a result, our accounting under the asset and liability method in 2024 and 2025 is based on the underlying assets and liabilities of ProFrac LLC. Flotek is not part of the Company’s consolidated group for income tax purposes. Therefore, we account for Flotek’s income taxes as a stand-alone income tax payor and present its balances combined with the Company’s balances in our disclosures.
ProFrac Holding Corp.
NOTES TO THE CONSOLIDATED FINANCIAL STATEMENTS
(Amounts in millions, except per share amounts, or where otherwise noted)
The following table summarizes the components of income tax expense (benefit):
|
|
|
|
|
|
|
|
|
|
|
|
|
|
|
Year Ended December 31, |
|
|
|
2025 |
|
|
2024 |
|
|
2023 |
|
Current income taxes: |
|
|
|
|
|
|
|
|
|
Federal |
|
$ |
0.1 |
|
|
$ |
— |
|
|
$ |
(1.1 |
) |
State |
|
|
1.0 |
|
|
|
3.7 |
|
|
|
2.2 |
|
Foreign |
|
|
0.1 |
|
|
|
— |
|
|
|
— |
|
Total current |
|
|
1.2 |
|
|
|
3.7 |
|
|
|
1.1 |
|
|
|
|
|
|
|
|
|
|
|
Deferred income taxes: |
|
|
|
|
|
|
|
|
|
Federal |
|
|
(13.7 |
) |
|
|
(9.6 |
) |
|
|
— |
|
State |
|
|
(0.4 |
) |
|
|
(1.1 |
) |
|
|
0.1 |
|
Total deferred |
|
|
(14.1 |
) |
|
|
(10.7 |
) |
|
|
0.1 |
|
|
|
|
|
|
|
|
|
|
|
Income tax expense (benefit) |
|
$ |
(12.9 |
) |
|
$ |
(7.0 |
) |
|
$ |
1.2 |
|
Actual income tax expense (benefit) for 2025 differed from the amount computed by applying the statutory federal income tax rate to income (loss) before income taxes as follows:
|
|
|
|
|
|
|
|
|
|
|
Year Ended December 31, 2025 |
|
|
|
$ |
|
|
% |
|
Income (loss) before income taxes |
|
$ |
(368.4 |
) |
|
|
|
Federal income tax expense (benefit) at statutory rate |
|
|
(77.4 |
) |
|
|
21.0 |
|
State taxes, net of federal benefit |
|
|
0.4 |
|
|
|
(0.1 |
) |
Foreign tax effects |
|
|
0.3 |
|
|
|
(0.1 |
) |
Domestic Federal Reconciling Items |
|
|
|
|
|
|
Effect of Cross-Border Tax Laws |
|
|
0.1 |
|
|
|
— |
|
Changes in valuation allowance |
|
|
37.6 |
|
|
|
(10.2 |
) |
Nontaxable or nondeductible items |
|
|
0.7 |
|
|
|
(0.2 |
) |
Other adjustments |
|
|
|
|
|
|
Transactions with related parties |
|
|
25.2 |
|
|
|
(6.8 |
) |
Other items |
|
|
0.2 |
|
|
|
(0.1 |
) |
Income tax expense (benefit) |
|
$ |
(12.9 |
) |
|
|
3.5 |
|
Actual income tax expense (benefit) for 2023 and 2024 differed from the amount computed by applying the statutory federal income tax rate to income (loss) before income taxes as follows:
|
|
|
|
|
|
|
|
|
|
|
Year Ended December 31, |
|
|
|
2024 |
|
|
2023 |
|
Income (loss) before income taxes |
|
$ |
(214.8 |
) |
|
$ |
(58.0 |
) |
Statutory rate |
|
21% |
|
|
21% |
|
Federal income tax expense (benefit) at statutory rate |
|
|
(45.1 |
) |
|
|
(12.2 |
) |
State taxes, net of federal benefit |
|
|
(0.8 |
) |
|
|
0.8 |
|
Permanent items |
|
|
3.4 |
|
|
|
7.2 |
|
Other |
|
|
3.6 |
|
|
|
(1.3 |
) |
Non-controlling interest |
|
|
— |
|
|
|
(10.7 |
) |
Business combination adjustment |
|
|
— |
|
|
|
(8.3 |
) |
Valuation allowance |
|
|
31.9 |
|
|
|
25.7 |
|
Income tax expense (benefit) |
|
$ |
(7.0 |
) |
|
$ |
1.2 |
|
Effective tax rate |
|
|
3.3 |
% |
|
|
-2.1 |
% |
The Company’s effective tax rate was generally lower than the federal corporate income tax rate of 21% due to changes in the valuation allowance against our deferred tax assets for all periods. Additionally, our effective tax rate was impacted in
ProFrac Holding Corp.
NOTES TO THE CONSOLIDATED FINANCIAL STATEMENTS
(Amounts in millions, except per share amounts, or where otherwise noted)
2025 because of a permanent book-tax difference in the accounting for a sale-leaseback transaction with Flotek and in 2023 because income allocated to our Class B shareholders before the conversion of our Class B common stock to Class A common stock was not subject to tax on the Company’s tax returns.
On July 4, 2025, the One Big Beautiful Bill Act (“OBBBA”) was signed into law. The OBBBA contains, among other provisions, certain changes to U.S. federal income tax laws related to 100% bonus depreciation and the calculation of interest expense deductions, which will reduce our taxable income in 2025 and future years. The accounting for changes in tax rates and tax laws is required to be recognized in the period in which the legislation is enacted. The effects of this tax law change have been incorporated into these consolidated financial statements.
The tax effects of temporary differences that give rise to significant portions of the deferred tax assets and deferred tax liabilities are presented below:
|
|
|
|
|
|
|
|
|
|
|
December 31, |
|
|
|
2025 |
|
|
2024 |
|
Deferred tax assets: |
|
|
|
|
|
|
Net operating loss carryforward |
|
$ |
168.4 |
|
|
$ |
147.1 |
|
Interest carryforward |
|
|
33.2 |
|
|
|
31.4 |
|
Lease liability |
|
|
35.4 |
|
|
|
39.8 |
|
Intangible assets and goodwill |
|
|
190.1 |
|
|
|
198.6 |
|
Other |
|
|
36.2 |
|
|
|
31.8 |
|
Gross deferred tax assets |
|
|
463.3 |
|
|
|
448.7 |
|
Valuation allowance |
|
|
(182.5 |
) |
|
|
(139.2 |
) |
Total deferred tax assets |
|
|
280.8 |
|
|
|
309.5 |
|
|
|
|
|
|
|
|
Deferred tax liabilities: |
|
|
|
|
|
|
Property, Plant & Equipment |
|
|
(223.4 |
) |
|
|
(280.2 |
) |
Right-of-use asset |
|
|
(33.9 |
) |
|
|
(38.2 |
) |
Other |
|
|
(6.3 |
) |
|
|
(6.0 |
) |
Total deferred tax liabilities |
|
|
(263.6 |
) |
|
|
(324.4 |
) |
|
|
|
|
|
|
|
Net deferred tax assets (liabilities) |
|
$ |
17.2 |
|
|
$ |
(14.9 |
) |
As of December 31, 2025, the Company had approximately $553.0 million of federal net operating loss ("NOL") carryforwards, of which $5.3 million will expire in 2037 with the remaining losses carried forward indefinitely. Of the Company's federal NOLs, $401.6 million are subject to limitation under Section 382.
The Company also has $169.4 million of state NOLs, of which $20.9 million will expire on various dates between 2032 and 2045 with the remaining losses carried forward indefinitely. Of the Company's state NOLs, $119.5 million are subject to limitation under Section 382.
The Company also has $4.2 million of Canadian NOLs that will expire between 2043 and 2045.
We have established a valuation allowance for all deferred tax assets that will not be realized by future taxable income generated by our deferred tax liabilities. Deferred tax assets related to our U.S. federal and state tax net operating losses are still available to us to offset future taxable income, subject to limitations in the event of a change of control under Section 382 of the Internal Revenue Code. At December 31, 2025, we had not incurred such an ownership change.
At each reporting date, we consider all available positive and negative evidence to evaluate whether our deferred tax assets are more likely than not to be realized. A significant piece of negative evidence that we consider is cumulative losses (generally defined as losses before income taxes) incurred in recent years. Such evidence limits our ability to consider other subjective evidence such as our projections for future taxable income. We also concluded that this negative evidence was not overcome by considering other sources of taxable income, which included the reversal of taxable temporary differences and tax-planning strategies.
Flotek has historically maintained a valuation allowance on substantially all of its deferred tax assets. At each reporting date, Flotek considers all available positive and negative evidence to evaluate whether its deferred tax assets are more likely than not to be realized. A significant piece of positive evidence that Flotek considers is whether it has incurred cumulative income (generally defined as income before income taxes) in recent years. Flotek noted that for the three years ended December 31,
ProFrac Holding Corp.
NOTES TO THE CONSOLIDATED FINANCIAL STATEMENTS
(Amounts in millions, except per share amounts, or where otherwise noted)
2025, it recorded a cumulative income before income taxes of more than $50 million. As a result of this positive evidence, Flotek concluded that a valuation allowance was no longer required for a portion of its deferred tax assets at December 31, 2025, because it is more likely than not that the deferred tax assets will be realized.
The Company’s net deferred tax assets of $17.2 million as of December 31, 2025 include $29.0 million of net deferred tax assets from Flotek. Because Flotek is not part of our consolidated group for income tax purposes, we do not offset Flotek’s net deferred tax assets from the Company’s net deferred tax liabilities in our consolidated balance sheets.
At December 31, 2025, we had no liability for uncertain tax positions. We recognize accrued interest and penalties related to any uncertain tax positions as part of income tax expense. At December 31, 2025, we had no accrued interest expense associated with unrecognized tax benefits. Interest expense associated with unrecognized tax benefits was zero for all periods presented.
ProFrac LLC was obligated to make cash distributions to the redeemable noncontrolling interest holders to fund their respective income tax liabilities relating to their share of the income of ProFrac LLC. In the fourth quarter of 2022, the Company paid a distribution of $8.0 million to the redeemable noncontrolling interest holders. The revised estimate for the full year liability to these shareholders was $2.8 million. As of December 31, 2022, we recorded the $5.3 million overpayment of the distribution in prepaid expenses and other current assets on our consolidated balance sheets to be offset against future tax distributions. In connection with the conversion of our Class B common stock to Class A common stock, ProFrac LLC will no longer be required to make tax distributions to our former Class B shareholders. As a result, we recorded the $5.3 million overpayment as an equity transaction as of December 31, 2023.
ProFrac Holding Corp and its U.S. subsidiaries join in the filing of a U.S. federal consolidated income tax return. Our income tax returns, along with income tax returns for our acquired subsidiaries, are currently subject to examination in federal and state jurisdictions primarily for tax years from 2021-2024.
The following table summarizes income taxes paid net of refund received:
|
|
|
|
|
|
|
Year Ended December 31, |
|
|
|
2025 |
|
US Federal |
|
$ |
0.2 |
|
US State and Local |
|
|
|
Louisiana |
|
|
0.3 |
|
Pennsylvania |
|
|
0.2 |
|
Texas |
|
|
1.3 |
|
Other |
|
|
0.1 |
|
Total |
|
$ |
2.1 |
|
Tax Receivable Agreement
In connection with our initial public offering, ProFrac Corp. entered into a tax receivable agreement (the “TRA”) with certain holders of limited liability company interests in ProFrac LLC (the “TRA Holders”). The TRA generally provides for payment by ProFrac Corp. to the TRA Holders of 85% of the net cash savings, if any, in U.S. federal, state and local income tax and franchise tax that ProFrac Corp. actually realizes (or is deemed to realize in certain circumstances) as a result of (i) certain increases in tax basis that occur as a result of ProFrac Corp.'s acquisition (or deemed acquisition for U.S. federal income tax purposes) of all or a portion of such TRA Holder’s ProFrac LLC units in connection with the initial public offering or the exercise of the Redemption Right (as defined in the TRA) or the Call Right (as defined in the TRA), and (ii) imputed interest deemed to be paid by ProFrac Corp. as a result of, and additional tax basis arising from, any payments ProFrac Corp. makes under the TRA. Payments will generally be made under the TRA as ProFrac Corp. realizes actual cash tax savings from the tax benefits covered by the TRA. As a result of our IPO and the conversion of all our Class B common stock to Class A common stock (see “Note 1. Organization and Description of Business”) and the tax effects of these transactions, we recorded a $82.9 million noncurrent TRA liability. The recognition of the TRA liability was recorded as an equity transaction because the holders of Class B common stock and their affiliates control us through their Class A common stock holdings. As of December 31, 2025, the current liability and noncurrent liability for our TRA obligation was $4.6 million and $82.0 million, respectively.
ProFrac Holding Corp.
NOTES TO THE CONSOLIDATED FINANCIAL STATEMENTS
(Amounts in millions, except per share amounts, or where otherwise noted)
13. EARNINGS PER SHARE
The calculation of earnings per share ("EPS") for our Class A common stock is as follows:
|
|
|
|
|
|
|
|
|
|
|
|
|
|
|
Year Ended December 31, |
|
|
|
2025 |
|
|
2024 |
|
|
2023 |
|
Numerator: |
|
|
|
|
|
|
|
|
|
Net loss attributable to ProFrac Holding Corp. |
|
$ |
(369.0 |
) |
|
$ |
(215.1 |
) |
|
$ |
(97.7 |
) |
Adjust Series A redeemable convertible preferred stock to its maximum redemption value |
|
|
(5.3 |
) |
|
|
(4.8 |
) |
|
|
(9.8 |
) |
Net income (loss) used for basic and diluted earnings per Class A common share |
|
$ |
(374.3 |
) |
|
$ |
(219.9 |
) |
|
$ |
(107.5 |
) |
|
|
|
|
|
|
|
|
|
|
Denominator: |
|
|
|
|
|
|
|
|
|
Weighted average Class A common shares |
|
|
168.3 |
|
|
|
159.9 |
|
|
|
130.9 |
|
Dilutive potential of restricted stock units |
|
|
— |
|
|
|
— |
|
|
|
— |
|
Weighted average Class A common shares — diluted |
|
|
168.3 |
|
|
|
159.9 |
|
|
|
130.9 |
|
|
|
|
|
|
|
|
|
|
|
Basic and diluted earnings per Class A common share |
|
$ |
(2.22 |
) |
|
$ |
(1.38 |
) |
|
$ |
(0.82 |
) |
|
|
|
|
|
|
|
|
|
|
Antidilutive shares: |
|
|
|
|
|
|
|
|
|
Common stock equivalents related to Preferred Stock |
|
|
2.9 |
|
|
|
2.7 |
|
|
|
2.5 |
|
Restricted stock units which are antidilutive due to net loss position |
|
|
— |
|
|
|
0.1 |
|
|
|
0.2 |
|
Contingently issuable shares |
|
|
0.3 |
|
|
|
— |
|
|
|
— |
|
Total antidilutive shares |
|
|
3.2 |
|
|
|
2.8 |
|
|
|
2.7 |
|
The dilutive potential of restricted stock units was calculated using the treasury stock method. The dilutive potential of our Preferred Stock is calculated using the if-converted method.
14. COMMITMENTS AND CONTINGENCIES
Litigation
In the ordinary course of business, we are the subject of, or party to a number of pending or threatened legal actions and administrative proceedings. While many of these matters involve inherent uncertainty, we believe that the amount of the liability, if any, ultimately incurred with respect to proceedings or claims will not have a material adverse effect on our consolidated financial position as a whole or on our liquidity, capital resources or future annual results of operations.
We estimate and provide for potential losses that may arise out of legal proceedings and claims to the extent that such losses are probable and can be reasonably estimated. Significant judgment is required in making these estimates and our final liabilities may ultimately be materially different from these estimates. When preparing our estimates, we consider, among other factors, the progress of each legal proceeding and claim, our experience and the experience of others in similar legal proceedings and claims, and the opinions and views of legal counsel. Legal costs related to litigation contingencies are expensed as incurred.
Purchase Commitments
As of December 31, 2025, we had purchase commitments of $6.5 million in 2025.
ProFrac Holding Corp.
NOTES TO THE CONSOLIDATED FINANCIAL STATEMENTS
(Amounts in millions, except per share amounts, or where otherwise noted)
15. FAIR VALUE MEASUREMENTS
Recurring Measurements
Our assets and liabilities measured at fair value on a recurring basis consist of the following:
|
|
|
|
|
|
|
|
|
|
|
|
|
|
|
Fair Value Measurements Using |
|
|
|
Level 1 |
|
|
Level 2 |
|
|
Level 3 |
|
December 31, 2025: |
|
|
|
|
|
|
|
|
|
Liabilities — Munger make-whole provision |
|
$ |
— |
|
|
$ |
— |
|
|
$ |
— |
|
|
|
|
|
|
|
|
|
|
|
December 31, 2024: |
|
|
|
|
|
|
|
|
|
Liabilities — Munger make-whole provision |
|
$ |
— |
|
|
$ |
— |
|
|
$ |
8.6 |
|
Munger Make-Whole Provision
In November 2021, we entered into an agreement (“Munger Right Agreement”) to acquire approximately 6,700 acres near Lamesa, Texas (“West Munger Property”) for a purchase price of $30.0 million (“West Munger Purchase”). Under the Munger Right Agreement, the sellers elected to receive their consideration in shares of our Class A common stock, which was valued at $38.1 million at our IPO date.
The Munger Right Agreement included a ‘Make Whole’ provision. Under the Make Whole provision, as amended, if any seller liquidates 100% of their Class A Common Stock prior to the two-year anniversary of the IPO and the value of the shares sold does not equal such seller’s share of the $30.0 million cash purchase price, then we will pay the difference between their share of the cash purchase price and the amount they ultimately received upon the sale of their Class A shares. This Make Whole provision was accounted for as a written put option with a fair value of $8.6 million as of December 31, 2024 and is presented within other current liabilities in our consolidated balance sheet. The fair value of the Munger make-whole provision was estimated using a Black-Scholes model. The significant unobservable inputs used in the fair value measurement are the risk-free rate and volatility. The Munger make-whole provision was settled in cash in 2025.
The following is a reconciliation of our recurring Level 3 fair value measurements:
|
|
|
|
|
|
|
|
|
|
|
|
Year Ended December 31, |
|
|
2025 |
|
|
2024 |
|
|
Net asset (liability) balance at beginning of period |
|
$ |
(8.6 |
) |
|
$ |
15.9 |
|
|
Transfer of investment in BPC to acquisition purchase consideration |
|
|
— |
|
|
|
(24.9 |
) |
|
Change in fair value of Level 3 fair value measurements |
|
|
3.7 |
|
|
|
0.4 |
|
|
Munger liability settled in cash |
|
|
4.9 |
|
|
|
— |
|
|
Net asset (liability) balance at end of period |
|
$ |
— |
|
|
$ |
(8.6 |
) |
|
All of the changes in fair value of Level 3 fair value instruments were charged to income and classified as other income (expense), net on our consolidated statements of operations.
Nonrecurring Measurements
We have certain assets and liabilities that are not measured at fair value on an ongoing basis but were subjected to fair value adjustments at the time of acquisition. These include long-lived assets and liabilities acquired through our business combination activities and purchase consideration in the form of seller-financed long-term notes payable, the fair values of which were determined using applicable valuation models based on significant unobservable inputs classified as Level 3 in the fair value hierarchy. See “Note 4. Business Combinations” for additional information.
In 2025 long-lived assets held and used in our Merryville sand mine with a total carrying value of $44.6 million were written down to their fair value of $3.2 million, resulting in an impairment charge of $41.4 million that was included in our operating results for the period. The inputs used to calculate the fair value of these long-lived assets included estimated proceeds to sell these idle assets to market participants, which was based on significant unobservable inputs classified as Level 3 in the fair value hierarchy. A reasonably possible change in any of the inputs within the determination of fair value would not result in a material change to the impairment recorded.
ProFrac Holding Corp.
NOTES TO THE CONSOLIDATED FINANCIAL STATEMENTS
(Amounts in millions, except per share amounts, or where otherwise noted)
Financial Instruments
The estimated fair values of our financial instruments have been determined at discrete points in time based on relevant market information. Our financial instruments consist of cash and cash equivalents, restricted cash, accounts receivable, certain investments, accounts payable, accrued expenses and long-term debt.
The carrying amounts of our financial instruments other than long-term debt approximate fair value because of the short-term nature of the items. The carrying amounts of our floating rate debt approximate fair value due to their variable interest rates. The fair value of our fixed rate debt, classified as Level 2 in the fair value hierarchy, also approximated its carrying value.
16. BUSINESS SEGMENTS
The Company's segments are determined as those operations whose results are reviewed regularly by the chief operating decision maker ("CODM"), who is our Executive Chairman, in deciding how to allocate resources and assess performance. Our CODM manages our business segments primarily by the type of product or services provided. We have four reportable segments which we operate within the United States of America: Stimulation Services, Proppant Production, Manufacturing and Flotek. Amounts in the other category reflect our business activities that are not separately reportable, which includes Livewire Power, LLC (“Livewire”), which we launched in the fourth quarter of 2024. Livewire enables onsite power generation services for oilfield and non-oilfield customers that require off-grid power solutions. In 2025 our Flotek operating segment was identified as a reportable segment due to the quantitative thresholds for reportable segments. Prior-period segment information has been recast to conform to the current presentation.
The CODM assesses the performance of the segments based on segment adjusted EBITDA, which is defined as our net income (loss) before (i) interest expense, net, (ii) income taxes, (iii) depreciation, depletion and amortization, (iv) (loss) gain on disposal of assets, net, (v) stock-based compensation, and (vi) other charges, such as certain credit losses, gain (loss) on extinguishment of debt, gain (loss) on investments, acquisition and integration expenses, litigation expenses and accruals for legal contingencies, acquisition earnout adjustments, severance charges, goodwill impairments, gains on insurance recoveries, transaction costs, third-party supply commitment charges, lease termination costs and impairments of long-lived assets.
We account for intersegment transactions as if the transactions were with third parties, that is, at estimated current market prices.
ProFrac Holding Corp.
NOTES TO THE CONSOLIDATED FINANCIAL STATEMENTS
(Amounts in millions, except per share amounts, or where otherwise noted)
Summarized financial information for our reportable segments is as follows:
|
|
|
|
|
|
|
|
|
|
|
|
|
|
|
|
|
|
|
|
|
|
|
|
|
|
|
|
|
|
|
Stimulation Services |
|
|
Proppant Production |
|
|
Manufacturing |
|
|
Flotek |
|
|
Other |
|
|
Eliminations |
|
|
Total |
|
Year Ended December 31, 2025: |
|
|
|
|
|
|
|
|
|
|
|
|
|
|
|
|
|
|
|
|
|
Revenue |
|
|
|
|
|
|
|
|
|
|
|
|
|
|
|
|
|
|
|
|
|
External customers — services |
|
$ |
1,681.8 |
|
|
$ |
— |
|
|
$ |
— |
|
|
$ |
— |
|
|
$ |
0.1 |
|
|
$ |
10.8 |
|
|
$ |
1,692.7 |
|
External customers — product sales (1) |
|
|
— |
|
|
|
121.2 |
|
|
|
37.5 |
|
|
|
90.4 |
|
|
|
— |
|
|
|
— |
|
|
|
249.1 |
|
Intercompany (2) |
|
|
1.1 |
|
|
|
214.8 |
|
|
|
174.8 |
|
|
|
153.2 |
|
|
|
17.2 |
|
|
|
(561.1 |
) |
|
|
— |
|
Total Revenue |
|
$ |
1,682.9 |
|
|
$ |
336.0 |
|
|
$ |
212.3 |
|
|
$ |
243.6 |
|
|
$ |
17.3 |
|
|
$ |
(550.3 |
) |
|
$ |
1,941.8 |
|
Cost of revenues, exclusive of depreciation, depletion, and amortization |
|
|
1,368.1 |
|
|
|
259.3 |
|
|
|
174.1 |
|
|
|
174.8 |
|
|
|
16.6 |
|
|
|
(538.3 |
) |
|
|
1,454.6 |
|
Selling, general and administrative, excluding stock-based compensation |
|
|
108.9 |
|
|
|
19.7 |
|
|
|
19.7 |
|
|
|
30.9 |
|
|
|
0.9 |
|
|
|
— |
|
|
|
180.1 |
|
Other expense (income) |
|
|
(2.6 |
) |
|
|
(0.1 |
) |
|
|
— |
|
|
|
(0.3 |
) |
|
|
— |
|
|
|
— |
|
|
|
(3.0 |
) |
Adjusted EBITDA (3) |
|
$ |
208.5 |
|
|
$ |
57.1 |
|
|
$ |
18.5 |
|
|
$ |
38.2 |
|
|
$ |
(0.2 |
) |
|
$ |
(12.0 |
) |
|
$ |
310.1 |
|
Depreciation, depletion and amortization |
|
|
321.5 |
|
|
|
76.6 |
|
|
|
15.3 |
|
|
|
3.5 |
|
|
|
1.8 |
|
|
|
(2.4 |
) |
|
|
416.3 |
|
Investment in property, plant & equipment |
|
|
144.7 |
|
|
|
23.3 |
|
|
|
1.9 |
|
|
|
8.9 |
|
|
|
3.0 |
|
|
|
(11.9 |
) |
|
|
169.9 |
|
|
|
|
|
|
|
|
|
|
|
|
|
|
|
|
|
|
|
|
|
|
|
As of December 31, 2025: |
|
|
|
|
|
|
|
|
|
|
|
|
|
|
|
|
|
|
|
|
|
Cash and cash equivalents |
|
$ |
14.0 |
|
|
$ |
1.1 |
|
|
$ |
2.1 |
|
|
$ |
5.7 |
|
|
$ |
— |
|
|
$ |
— |
|
|
$ |
22.9 |
|
Total current assets |
|
|
403.1 |
|
|
|
78.5 |
|
|
|
315.7 |
|
|
|
110.4 |
|
|
|
3.5 |
|
|
|
(427.7 |
) |
|
|
483.5 |
|
Property, plant, and equipment, net (4) |
|
|
669.4 |
|
|
|
725.6 |
|
|
|
42.7 |
|
|
|
29.6 |
|
|
|
10.4 |
|
|
|
(13.4 |
) |
|
|
1,464.3 |
|
Total assets |
|
|
2,795.6 |
|
|
|
1,115.8 |
|
|
|
455.8 |
|
|
|
266.2 |
|
|
|
37.0 |
|
|
|
(2,097.3 |
) |
|
|
2,573.1 |
|
Current portion of long-term debt |
|
|
94.1 |
|
|
|
48.5 |
|
|
|
3.6 |
|
|
|
3.5 |
|
|
|
— |
|
|
|
— |
|
|
|
149.7 |
|
Long-term debt |
|
|
554.8 |
|
|
|
266.4 |
|
|
|
14.6 |
|
|
|
39.8 |
|
|
|
— |
|
|
|
— |
|
|
|
875.6 |
|
Total liabilities |
|
|
1,855.2 |
|
|
|
425.2 |
|
|
|
378.0 |
|
|
|
114.2 |
|
|
|
41.9 |
|
|
|
(1,122.1 |
) |
|
|
1,692.4 |
|
ProFrac Holding Corp.
NOTES TO THE CONSOLIDATED FINANCIAL STATEMENTS
(Amounts in millions, except per share amounts, or where otherwise noted)
|
|
|
|
|
|
|
|
|
|
|
|
|
|
|
|
|
|
|
|
|
|
|
|
|
|
|
|
|
|
|
Stimulation Services |
|
|
Proppant Production |
|
|
Manufacturing |
|
|
Flotek |
|
|
Other |
|
|
Eliminations |
|
|
Total |
|
Year Ended December 31, 2024: |
|
|
|
|
|
|
|
|
|
|
|
|
|
|
|
|
|
|
|
|
|
Revenue |
|
|
|
|
|
|
|
|
|
|
|
|
|
|
|
|
|
|
|
|
|
External customers — services |
|
$ |
1,886.7 |
|
|
$ |
— |
|
|
$ |
— |
|
|
$ |
— |
|
|
$ |
— |
|
|
$ |
— |
|
|
$ |
1,886.7 |
|
External customers — product sales (1) |
|
|
— |
|
|
|
181.5 |
|
|
|
50.8 |
|
|
|
71.3 |
|
|
|
0.6 |
|
|
|
— |
|
|
|
304.2 |
|
Intercompany (2) |
|
|
27.7 |
|
|
|
65.0 |
|
|
|
172.0 |
|
|
|
121.1 |
|
|
|
2.5 |
|
|
|
(388.3 |
) |
|
|
— |
|
Total Revenue |
|
$ |
1,914.4 |
|
|
$ |
246.5 |
|
|
$ |
222.8 |
|
|
$ |
192.4 |
|
|
$ |
3.1 |
|
|
$ |
(388.3 |
) |
|
$ |
2,190.9 |
|
Cost of revenues, exclusive of depreciation, depletion, and amortization |
|
|
1,394.8 |
|
|
|
137.6 |
|
|
|
190.5 |
|
|
|
147.5 |
|
|
|
5.0 |
|
|
|
(380.3 |
) |
|
|
1,495.1 |
|
Selling, general and administrative, excluding stock-based compensation |
|
|
123.6 |
|
|
|
23.3 |
|
|
|
24.6 |
|
|
|
24.8 |
|
|
|
1.0 |
|
|
|
— |
|
|
|
197.3 |
|
Other expense (income) |
|
|
(2.7 |
) |
|
|
— |
|
|
|
0.1 |
|
|
|
— |
|
|
|
— |
|
|
|
— |
|
|
|
(2.6 |
) |
Adjusted EBITDA (3) |
|
$ |
398.7 |
|
|
$ |
85.6 |
|
|
$ |
7.6 |
|
|
$ |
20.1 |
|
|
$ |
(2.9 |
) |
|
$ |
(8.0 |
) |
|
$ |
501.1 |
|
Depreciation, depletion and amortization |
|
|
348.5 |
|
|
|
77.8 |
|
|
|
13.8 |
|
|
|
2.8 |
|
|
|
— |
|
|
|
(0.7 |
) |
|
$ |
442.2 |
|
Investment in property, plant & equipment |
|
|
216.8 |
|
|
|
23.5 |
|
|
|
8.6 |
|
|
|
1.6 |
|
|
|
9.2 |
|
|
|
(4.7 |
) |
|
$ |
255.0 |
|
|
|
|
|
|
|
|
|
|
|
|
|
|
|
|
|
|
|
|
|
|
|
As of December 31, 2024: |
|
|
|
|
|
|
|
|
|
|
|
|
|
|
|
|
|
|
|
|
|
Cash and cash equivalents |
|
$ |
8.7 |
|
|
$ |
— |
|
|
$ |
1.7 |
|
|
$ |
4.4 |
|
|
$ |
— |
|
|
$ |
— |
|
|
$ |
14.8 |
|
Total current assets |
|
|
466.9 |
|
|
|
71.4 |
|
|
|
255.3 |
|
|
|
89.9 |
|
|
|
5.4 |
|
|
|
(314.8 |
) |
|
|
574.1 |
|
Property, plant, and equipment, net (4) |
|
|
839.3 |
|
|
|
817.6 |
|
|
|
82.5 |
|
|
|
16.7 |
|
|
|
9.2 |
|
|
|
(4.1 |
) |
|
|
1,761.2 |
|
Total assets |
|
|
2,911.3 |
|
|
|
929.5 |
|
|
|
443.2 |
|
|
|
204.7 |
|
|
|
44.9 |
|
|
|
(1,545.5 |
) |
|
|
2,988.1 |
|
Current portion of long-term debt |
|
|
87.5 |
|
|
|
65.5 |
|
|
|
6.8 |
|
|
|
4.8 |
|
|
|
— |
|
|
|
— |
|
|
|
164.6 |
|
Long-term debt |
|
|
649.1 |
|
|
|
278.0 |
|
|
|
17.3 |
|
|
|
— |
|
|
|
— |
|
|
|
— |
|
|
|
944.4 |
|
Total liabilities |
|
|
1,891.4 |
|
|
|
124.2 |
|
|
|
360.7 |
|
|
|
56.2 |
|
|
|
47.7 |
|
|
|
(631.7 |
) |
|
|
1,848.5 |
|
|
|
|
|
|
|
|
|
|
|
|
|
|
|
|
|
|
|
|
|
|
|
Year Ended December 31, 2023: |
|
|
|
|
|
|
|
|
|
|
|
|
|
|
|
|
|
|
|
|
|
Revenue |
|
|
|
|
|
|
|
|
|
|
|
|
|
|
|
|
|
|
|
|
|
External customers — services |
|
$ |
2,274.2 |
|
|
$ |
— |
|
|
$ |
— |
|
|
$ |
— |
|
|
$ |
— |
|
|
$ |
— |
|
|
$ |
2,274.2 |
|
External customers — product sales (1) |
|
|
— |
|
|
|
270.2 |
|
|
|
19.0 |
|
|
|
66.6 |
|
|
|
— |
|
|
|
— |
|
|
|
355.8 |
|
Intercompany (2) |
|
|
17.0 |
|
|
|
113.1 |
|
|
|
157.1 |
|
|
|
126.4 |
|
|
|
— |
|
|
|
(413.6 |
) |
|
|
— |
|
Total Revenue |
|
$ |
2,291.2 |
|
|
$ |
383.3 |
|
|
$ |
176.1 |
|
|
$ |
193.0 |
|
|
$ |
— |
|
|
$ |
(413.6 |
) |
|
$ |
2,630.0 |
|
Cost of revenues, exclusive of depreciation, depletion, and amortization |
|
|
1,668.9 |
|
|
|
171.6 |
|
|
|
147.0 |
|
|
|
166.2 |
|
|
|
— |
|
|
|
(413.6 |
) |
|
|
1,740.1 |
|
Selling, general and administrative, excluding stock-based compensation |
|
|
147.0 |
|
|
|
13.8 |
|
|
|
14.6 |
|
|
|
28.4 |
|
|
|
— |
|
|
|
— |
|
|
|
203.8 |
|
Other expense (income) |
|
|
(2.1 |
) |
|
|
(0.2 |
) |
|
|
— |
|
|
|
— |
|
|
|
— |
|
|
|
— |
|
|
|
(2.3 |
) |
Adjusted EBITDA (3) |
|
$ |
477.4 |
|
|
$ |
198.1 |
|
|
$ |
14.5 |
|
|
$ |
(1.6 |
) |
|
$ |
— |
|
|
$ |
— |
|
|
$ |
688.4 |
|
Depreciation, depletion and amortization |
|
|
363.0 |
|
|
|
68.1 |
|
|
|
4.2 |
|
|
|
3.1 |
|
|
|
— |
|
|
|
— |
|
|
$ |
438.4 |
|
Investment in property, plant & equipment |
|
|
221.8 |
|
|
|
40.9 |
|
|
|
3.3 |
|
|
|
1.0 |
|
|
|
— |
|
|
|
— |
|
|
$ |
267.0 |
|
(1)Our Proppant Production segment recognized noncash revenue associated with acquired contract liabilities of $7.6 million, $43.7 million and $57.5 million in 2025, 2024 and 2023, respectively.
(2)Flotek recorded $27.4 million. $32.5 million and $20.1 million of revenue in 2025, 2024 and 2023, respectively, related to contract shortfalls because the Stimulation Services segment did not purchase the minimum contractual commitment of chemistry products from Flotek.
(3)Adjusted EBITDA for the stimulated services segment included an intercompany supply commitment charge of $27.4 million, $32.5 million and $20.1 million in 2025, 2024 and 2023, respectively, because this segment did not purchase the minimum contractual commitment of chemistry products from Flotek.
ProFrac Holding Corp.
NOTES TO THE CONSOLIDATED FINANCIAL STATEMENTS
(Amounts in millions, except per share amounts, or where otherwise noted)
(4)In April 2025, Flotek acquired certain gas conditioning equipment from our Stimulation Services segment for total consideration of $107.5 million and our Stimulation Services segment leased these assets back from Flotek for a six year term. We believe this Flotek partnership provides ownership exposure to a highly-scalable gas quality and asset integrity business. The effects of this sale-leaseback transaction have been eliminated from our consolidated financial statements.
The following table reconciles consolidated Adjusted EBITDA to net income (loss):
|
|
|
|
|
|
|
|
|
|
|
|
|
|
|
Year Ended December 31, |
|
|
|
2025 |
|
|
2024 |
|
|
2023 |
|
Adjusted EBITDA of reportable segments |
|
$ |
310.1 |
|
|
$ |
501.1 |
|
|
$ |
688.4 |
|
Interest expense, net |
|
|
(138.8 |
) |
|
|
(156.6 |
) |
|
|
(154.9 |
) |
Depreciation, depletion and amortization |
|
|
(416.3 |
) |
|
|
(442.2 |
) |
|
|
(438.4 |
) |
Income tax benefit (expense) |
|
|
12.9 |
|
|
|
7.0 |
|
|
|
(1.2 |
) |
Gain (loss) on disposal of assets, net |
|
|
(18.1 |
) |
|
|
(0.3 |
) |
|
|
1.7 |
|
Loss on extinguishment of debt |
|
|
— |
|
|
|
(0.8 |
) |
|
|
(33.5 |
) |
Acquisition earnout adjustment |
|
|
— |
|
|
|
— |
|
|
|
6.6 |
|
Provision for credit losses, net of recoveries |
|
|
(13.7 |
) |
|
|
— |
|
|
|
(0.1 |
) |
Stock-based compensation (1) |
|
|
(10.4 |
) |
|
|
(7.3 |
) |
|
|
(10.1 |
) |
Stock-based compensation related to deemed contributions (1) |
|
|
— |
|
|
|
— |
|
|
|
(19.7 |
) |
Lease termination |
|
|
(1.1 |
) |
|
|
— |
|
|
|
— |
|
Transaction costs |
|
|
(8.0 |
) |
|
|
(3.9 |
) |
|
|
— |
|
Severance charges |
|
|
(0.4 |
) |
|
|
(2.5 |
) |
|
|
(1.1 |
) |
Acquisition and integration costs |
|
|
(0.2 |
) |
|
|
(7.8 |
) |
|
|
(21.8 |
) |
Supply commitment charges |
|
|
— |
|
|
|
(9.6 |
) |
|
|
— |
|
Impairment of long-lived assets and goodwill |
|
|
(52.6 |
) |
|
|
(74.5 |
) |
|
|
(2.5 |
) |
Inventory write-down |
|
|
(0.8 |
) |
|
|
— |
|
|
|
— |
|
Gain (loss) on insurance recoveries |
|
|
(0.3 |
) |
|
|
4.9 |
|
|
|
— |
|
Litigation expenses and accruals for legal contingencies |
|
|
(11.0 |
) |
|
|
(15.7 |
) |
|
|
(34.1 |
) |
Gain (loss) on investments, net |
|
|
(6.8 |
) |
|
|
0.4 |
|
|
|
(38.5 |
) |
Net loss |
|
$ |
(355.5 |
) |
|
$ |
(207.8 |
) |
|
$ |
(59.2 |
) |
(1)Stock-based compensation and stock-based compensation related to deemed contributions are reported in “Selling, general and administrative” in the consolidated statements of operations and are not allocated to the segments.
17. RELATED PARTY TRANSACTIONS
In the normal course of business, we have entered into transactions with related parties where the Wilks Parties hold a controlling financial interest. In the three year period ended December 31, 2025, the Company had related party transactions with the following related party entities:
•Logistix IQ, LLC (“Logistix IQ”, formally Automatize, LLC) is a logistics broker that facilitates the last-mile delivery of proppants on behalf of its customers, including the Company. Amounts paid to Logistix IQ include costs passed through to third-party trucking companies and a commission retained by Logistix IQ. These payments are recorded in cost of revenues, exclusive of depreciation and depletion in our consolidated statements of operations.
•PC Energy Credit I, LLC (“PC Energy”) is an investment company that provides financing to its customers, including the Company. Amounts paid to PC Energy are recorded in interest expense in our consolidated statements of operations, and repayments of long-term debt in our consolidated statements of cash flows. See “Note 7. Debt” for additional disclosures related to related party credit agreements.
•Equify Financial, LLC (“Equify Financial”) is a finance company that provides equipment and other financing to its customers, including the Company, and acts as the servicing agent for THRC Holdings, LP (“THRC Holdings”) under an equipment sale-leaseback arrangement between us and THRC Holdings. Amounts paid to Equify Financial are recorded in cost of revenue, interest expense in our consolidated statements of operations, and repayments of long-term debt in our consolidated statements of cash flows. See “Note 7. Debt” for additional disclosures related to related party credit agreements.
ProFrac Holding Corp.
NOTES TO THE CONSOLIDATED FINANCIAL STATEMENTS
(Amounts in millions, except per share amounts, or where otherwise noted)
•Wilks Brothers, LLC (“Wilks Brothers”) is a management company which provides administrative support to various businesses within its portfolio. Wilks Brothers and certain entities under its control will at times incur expenses on our behalf, billing us for these expenses at cost as well as certain management fees. Amounts paid to Wilks Brothers are generally recorded in selling, general and administrative expenses in our consolidated statements of operations. Payments made to Cisco Aero, LLC in 2024 have been reclassified to Wilks Brothers in the tables below to conform to current year presentation.
•Interstate Explorations, LLC (“Interstate”) is an exploration and development company for which we perform pressure pumping services.
•Flying A Pump Services, LLC (“Flying A”), along with its subsidiary MGB Manufacturing, LLC (“MG Bryan”), is an oilfield services company which provides pressure pumping, acid and cementing services. We rent and sell equipment and frac fleet components, and at times sell proppant, to Flying A. We also pay Flying A to rent, repair, or sell equipment or frac fleet components.
•MC Estates, LLC, The Shops at Crown Park, LLC (d/b/a The Shops at Willow Park), FTSI Industrial, LLC, 6100 IH 20, LLC (f/k/a 420 Shops Blvd, LLC), and Wilks Ranch Texas, LLC (collectively, the “Related Lessors”) own various industrial parks and office space leased by us. Amounts paid to the Related Lessors are recorded in selling, general and administrative expenses in our consolidated statements of operations.
•Wilks Construction Company, LLC (“Wilks Construction”) is a construction company that has built and made renovations to several buildings for us. Amounts paid to Wilks Construction are recorded as capital expenditures in our consolidated statements of cash flows.
•3 Twenty-Three, LLC (“3 Twenty-Three”) is a payroll administrator which performs payroll services on behalf of its customers, including us. Amounts paid to 3 Twenty-Three are recorded in cost of revenues, exclusive of depreciation and depletion and selling, general and administrative expenses in our consolidated statements of operations.
•Wilks Earthworks, LLC ("Wilks Earthworks") is an oilfield services company that provides mining, wet and dry loading, hauling and other services and equipment to its customers, including us. These payments are recorded in cost of revenues, exclusive of depreciation and depletion in our consolidated statements of operations.
•Carbo Ceramics Inc. (“Carbo”) is a provider of ceramic proppant which will at times purchase conventional proppant from us to act as a broker for its customers. Additionally, we will at times purchase manufactured proppant from Carbo for the Stimulation Services segment.
The following table summarizes revenue from related parties:
|
|
|
|
|
|
|
|
|
|
|
|
|
|
|
Year Ended December 31, |
|
|
|
2025 |
|
|
2024 |
|
|
2023 |
|
Flying A |
|
$ |
6.3 |
|
|
$ |
23.6 |
|
|
$ |
6.7 |
|
Carbo |
|
|
— |
|
|
|
— |
|
|
|
0.7 |
|
Total |
|
$ |
6.3 |
|
|
$ |
23.6 |
|
|
$ |
7.4 |
|
ProFrac Holding Corp.
NOTES TO THE CONSOLIDATED FINANCIAL STATEMENTS
(Amounts in millions, except per share amounts, or where otherwise noted)
The following table summarizes expenditures with related parties:
|
|
|
|
|
|
|
|
|
|
|
|
|
|
|
Year Ended December 31, |
|
|
|
2025 |
|
|
2024 |
|
|
2023 |
|
Logistix IQ |
|
$ |
143.4 |
|
|
$ |
86.2 |
|
|
$ |
134.0 |
|
Flying A |
|
|
2.8 |
|
|
|
— |
|
|
|
— |
|
FHE |
|
|
— |
|
|
|
— |
|
|
|
3.3 |
|
Wilks Brothers (1) |
|
|
7.5 |
|
|
|
9.1 |
|
|
|
19.2 |
|
Related Lessors |
|
|
15.9 |
|
|
|
15.2 |
|
|
|
13.2 |
|
Wilks Construction |
|
|
8.4 |
|
|
|
— |
|
|
|
6.8 |
|
Wilks Earthworks |
|
|
27.1 |
|
|
|
11.7 |
|
|
|
9.1 |
|
Equify Financial |
|
|
18.1 |
|
|
|
10.2 |
|
|
|
8.7 |
|
3 Twenty-Three |
|
|
— |
|
|
|
— |
|
|
|
1.3 |
|
Carbo |
|
|
2.3 |
|
|
|
1.7 |
|
|
|
1.6 |
|
Total |
|
$ |
225.5 |
|
|
$ |
134.1 |
|
|
$ |
197.2 |
|
The following table summarizes accounts receivable–related party:
|
|
|
|
|
|
|
|
|
|
|
December 31, |
|
|
|
2025 |
|
|
2024 |
|
Flying A |
|
$ |
18.8 |
|
|
$ |
15.7 |
|
Wilks Construction |
|
|
0.8 |
|
|
|
— |
|
Interstate |
|
|
0.3 |
|
|
|
0.4 |
|
Total |
|
$ |
19.9 |
|
|
$ |
16.1 |
|
The following table summarizes accounts payable–related party:
|
|
|
|
|
|
|
|
|
|
|
December 31, |
|
|
|
2025 |
|
|
2024 |
|
Logistix IQ |
|
$ |
27.6 |
|
|
$ |
11.6 |
|
Wilks Brothers (1) |
|
|
5.5 |
|
|
|
3.2 |
|
Wilks Earthworks |
|
|
5.2 |
|
|
|
2.8 |
|
Related Lessors |
|
|
0.1 |
|
|
|
0.1 |
|
Flying A |
|
|
2.8 |
|
|
|
— |
|
Carbo |
|
|
1.0 |
|
|
|
0.4 |
|
Total |
|
$ |
42.2 |
|
|
$ |
18.1 |
|
(1)In 2025 the Company and Wilks Brothers agreed to settle the second, third and fourth quarter management fee payments under a service agreement in shares of common stock. The number of shares of common stock to be issued is calculated by dividing the management fee payment by the 10-day VWAP of common stock at the end of each quarter. Approximately $5.0 million of expenditures were recorded as stock-based compensation expense in 2025 related to this agreement.
In December 2025, we entered into an agreement with MG Bryan pursuant to which MG Bryan will provide equipment brokerage services to us on an as needed, commission basis.
In September 2025, we sold certain nonessential assets originally acquired from AST to Flying A in exchange for cash consideration of $3.4 million. The cash consideration received was $0.9 million greater than the carrying value of these assets. Because this sale was to an affiliate under common control, we accounted for the $0.9 million as an equity transaction recorded as a deemed contribution within our consolidated statements of changes in equity.
In September 2025, we entered into four lease agreements with Flying A to rent pressure pumping equipment at a monthly rental rate of $75,000 per lease. The leases had respective initial terms ending November 1, 2025, November 30, 2025, December 31, 2025, and December 31, 2025, and continue on a month-to-month basis until terminated by us.
In April 2025, we entered into a contract with Wilks Construction to construct new facilities at our San Antonio Sand Mine.
In December 2024, we entered into a master agreement with MG Bryan, under which we have engaged MG Bryan to provide pump refurbishment services.
ProFrac Holding Corp.
NOTES TO THE CONSOLIDATED FINANCIAL STATEMENTS
(Amounts in millions, except per share amounts, or where otherwise noted)
In December 2024, we entered into an equipment lease agreement with THRC. See “Note 5. Leases” for discussion.
In August 2024, we entered into a master purchase agreement with Flying A pursuant to which we periodically sell sand to Flying A. In August 2024, we also entered into a consignment agreement with Flying A pursuant to which we periodically sell parts and equipment.
In June 2024, we entered into a real estate lease agreement with a Related Lessor. See “Note 5. Leases” for discussion.
In June 2023 and January 2024, we arranged to sell certain surplus equipment and inventory components and to assign certain pre-orders for equipment to Flying A, at prices which are consistent with fair market value, for a total consideration of $36.3 million and $8.4 million, respectively. We delivered $2.4 million, $12.6 million and $28.9 million of these components to Flying A in 2025, 2024 and 2023, respectively. We expect to deliver the remaining $0.8 million of product to Flying A in 2026. We accounted for the unapplied proceeds from these transactions as related party deposits presented as "Other current liabilities - related party" in our consolidated balance sheets.
In September 2023, the Company entered into a purchase agreement with THRC Holdings, LP and FARJO Holdings, LP, pursuant to which the Company issued and sold 50,000 shares of Preferred Stock for gross proceeds of $50.0 million. THRC Holdings, LP and FARJO Holdings, LP are Wilks Parties. See “Note 9. Equity” for more information.
On January 11, 2023, the board of directors of ProFrac Corp. approved the appointment of Mr. Coy Randle, the then Chief Operating Officer of ProFrac Corp., to the board of directors of ProFrac Corp. Additionally, Mr. Randle entered into a consulting agreement with ProFrac Corp., effective as of January 13, 2023, pursuant to which Mr. Randle agreed to provide general operational advice to ProFrac Corp. and its direct and indirect operating subsidiaries for an annual fee of $0.2 million. Pursuant to the consulting agreement, ProFrac Corp. paid healthcare insurance premiums on behalf of Mr. Randle and allowed Mr. Randle to use a Company vehicle for the duration of the consulting agreement. The consulting agreement had a term of one year.
18. SUBSEQUENT EVENTS
In January 2026 ProFrac Holdings II, LLC issued an additional $25.0 million aggregate principal amount of its 2029 Senior Notes at par to Beal Bank USA in a private placement to fund capital expenditures with any remaining proceeds used for general corporate purposes. These notes were issued as additional notes pursuant to the original indenture as amended. These new notes and the notes previously issued under the indenture are treated as a single series of securities under the indenture and the new notes have substantially identical terms, other than the issue date, issue price and first payment date, as the existing notes and are secured by a security interest in the same collateral.
On March 3, 2026, we entered into an amendment to the 2022 ABL Credit Facility pursuant to which, among other changes, (a) the maximum availability under the facility was reduced to $275.0 million, (b) the scheduled maturity date of the facility was extended six months to September 3, 2027, (c) the applicable margin for SOFR rate loans was revised to range from 1.75% to 2.25%, subject to step-ups of 0.25% at three month intervals following the amendment effective date, up to a range from 3.00% to 3.50%, (d) the unused line fee was revised to 0.375% at all times, (e) certain negative covenant exceptions were curtailed or removed and (f) the $15.0 million minimum liquidity covenant was replaced with a $45.0 million minimum availability covenant.
Item 9. Changes in and Disagreements With Accountants on Accounting and Financial Disclosure.
None.
Item 9A. Controls and Procedures
Evaluation of Disclosure Controls and Procedures
We maintain a system of disclosure controls and procedures (as defined in Exchange Act Rules 13a-15(e) and 15d-15(e)) designed to ensure that the information required to be disclosed by us in the reports that we file or submit under the Exchange Act is recorded, processed, summarized and reported within the time periods specified in the rules and forms of the SEC, and is accumulated and communicated to our management, including our Executive Chairman (our principal executive officer) and Chief Financial Officer (our principal financial officer), as appropriate, to allow timely decisions regarding required disclosure. In designing and evaluating the disclosure controls and procedures, management recognized that any controls and procedures, no matter how well designed and operated, can provide only reasonable assurance of achieving the desired control objectives, as ours are designed to do, and management necessarily was required to apply its judgment in evaluating the cost-benefit relationship of possible controls and procedures. Based on the evaluation of our disclosure controls and procedures as of December 31, 2025, our Executive Chairman and Chief Financial Officer concluded that, as of such date, our disclosure controls and procedures were effective at the reasonable assurance level.
Limitations on Controls and Procedures
In designing and evaluating our disclosure controls and procedures, management recognizes that disclosure controls and procedures, no matter how well conceived and operated, can provide only reasonable, not absolute, assurance that the objectives of the disclosure controls and procedures are met. Additionally, in designing disclosure controls and procedures, our management necessarily was required to apply its judgment in evaluating the cost-benefit relationship of possible disclosure controls and procedures. The design of any system of controls also is based in part upon certain assumptions about the likelihood of future events, and there can be no assurance that any design will succeed in achieving its stated goals under all potential future conditions; over time, controls may become inadequate because of changes in conditions, or the degree of compliance with policies or procedures may deteriorate. Because of the inherent limitations in a control system, misstatements due to error or fraud may occur and not be detected.
Changes in Internal Control over Financial Reporting
There were no changes in our internal control over financial reporting during the fourth quarter of 2024, which were identified in connection with management’s evaluation required by paragraph (d) of Rules 13a-15 and 15d-15 under the Exchange Act, that have materially affected, or are reasonably likely to materially affect, our internal control over financial reporting.
Management’s Annual Report on Internal Control over Financial Reporting
Our management, under the direction of our Executive Chairman (our principal executive officer) and Chief Financial Officer (our principal financial officer), is responsible for establishing and maintaining adequate internal control over financial reporting (as defined in Exchange Act Rule 13a-15(f)). Our system of internal control over financial reporting is designed to provide reasonable assurance to our management and to our board of directors regarding the reliability of financial reporting and the preparation of financial statements for external purposes in accordance with generally accepted accounting principles in the United States of America.
Our management conducted an evaluation of the effectiveness of our internal control over financial reporting as of December 31, 2025. In making this assessment, management used the criteria set forth by the Committee of Sponsoring Organizations of the Treadway Commission (COSO) in Internal Control – Integrated Framework (2013). Based on its evaluation under this framework, our management concluded that, as of December 31, 2025, our internal control over financial reporting was effective.
Our independent registered public accounting firm, Grant Thornton LLP, has audited the effectiveness of our internal control over financial reporting as of December 31, 2025.
REPORT OF INDEPENDENT REGISTERED PUBLIC ACCOUNTING FIRM
Board of Directors and Shareholders
ProFrac Holding Corp.
Opinion on internal control over financial reporting
We have audited the internal control over financial reporting of ProFrac Holding Corp. (a Delaware corporation) and subsidiaries (the “Company”) as of December 31, 2025, based on criteria established in the 2013 Internal Control—Integrated Framework issued by the Committee of Sponsoring Organizations of the Treadway Commission (“COSO”). In our opinion, the Company maintained, in all material respects, effective internal control over financial reporting as of December 31, 2025, based on criteria established in the 2013 Internal Control—Integrated Framework issued by COSO.
We also have audited, in accordance with the standards of the Public Company Accounting Oversight Board (United States) (“PCAOB”), the consolidated financial statements of the Company as of and for the year ended December 31, 2025, and our report dated March 13, 2026 expressed an unqualified opinion on those financial statements.
Basis for opinion
The Company’s management is responsible for maintaining effective internal control over financial reporting and for its assessment of the effectiveness of internal control over financial reporting, included in the accompanying Management’s Annual Report on Internal Control over Financial Reporting. Our responsibility is to express an opinion on the Company’s internal control over financial reporting based on our audit. We are a public accounting firm registered with the PCAOB and are required to be independent with respect to the Company in accordance with the U.S. federal securities laws and the applicable rules and regulations of the Securities and Exchange Commission and the PCAOB.
We conducted our audit in accordance with the standards of the PCAOB. Those standards require that we plan and perform the audit to obtain reasonable assurance about whether effective internal control over financial reporting was maintained in all material respects. Our audit included obtaining an understanding of internal control over financial reporting, assessing the risk that a material weakness exists, testing and evaluating the design and operating effectiveness of internal control based on the assessed risk, and performing such other procedures as we considered necessary in the circumstances. We believe that our audit provides a reasonable basis for our opinion.
Definition and limitations of internal control over financial reporting
A company’s internal control over financial reporting is a process designed to provide reasonable assurance regarding the reliability of financial reporting and the preparation of financial statements for external purposes in accordance with generally accepted accounting principles. A company’s internal control over financial reporting includes those policies and procedures that (1) pertain to the maintenance of records that, in reasonable detail, accurately and fairly reflect the transactions and dispositions of the assets of the company; (2) provide reasonable assurance that transactions are recorded as necessary to permit preparation of financial statements in accordance with generally accepted accounting principles, and that receipts and expenditures of the company are being made only in accordance with authorizations of management and directors of the company; and (3) provide reasonable assurance regarding prevention or timely detection of unauthorized acquisition, use, or disposition of the company’s assets that could have a material effect on the financial statements.
Because of its inherent limitations, internal control over financial reporting may not prevent or detect misstatements. Also, projections of any evaluation of effectiveness to future periods are subject to the risk that controls may become inadequate because of changes in conditions, or that the degree of compliance with the policies or procedures may deteriorate.
/s/ GRANT THORNTON LLP
Dallas, Texas
March 13, 2026
Item 9B. Other Information.
Rule 10b5-1 Trading Plans
During the three months ended December 31, 2025, none of our directors or executive officers adopted or terminated any contract, instruction or written plan for the purchase or sale of our securities that was intended to satisfy the affirmative defense conditions of Rule 10b5-1(c) or any “non-Rule 10b5-1 trading arrangement.”
Item 9C. Disclosure Regarding Foreign Jurisdictions that Prevent Inspections.
Not applicable.
PART III
Item 10. Directors, Executive Officers and Corporate Governance.
The information required by this Item is incorporated by reference to our Proxy Statement for the 2025 Annual Meeting of Stockholders, which is expected to be filed with the SEC within 120 days of December 31, 2025 (the “2025 Proxy Statement”). The Company has adopted an Insider Trading Policy, a copy of which is filed as Exhibit 19 to this Annual Report.
Item 11. Executive Compensation.
The information required by this Item is incorporated by reference to our 2026 Proxy Statement, which is expected to be filed with the SEC within 120 days of December 31, 2025.
Item 12. Security Ownership of Certain Beneficial Owners and Management and Related Stockholder Matters.
The information required by this Item is incorporated by reference to our 2026 Proxy Statement, which is expected to be filed with the SEC within 120 days of December 31, 2025.
Item 13. Certain Relationships and Related Transactions, and Director Independence.
The information required by this Item is incorporated by reference to our 2026 Proxy Statement, which is expected to be filed with the SEC within 120 days of December 31, 2025.
Item 14. Principal Accountant Fees and Services.
The information required by this Item is incorporated by reference to our 2026 Proxy Statement, which is expected to be filed with the SEC within 120 days of December 31, 2025.
PART IV
Item 15. Exhibit and Financial Statement Schedules.
(a) The following documents are filed as part of this Annual Report on Form 10-K:
Reference is made to Part II, Item 8 of this Annual Report on Form 10-K.
(2)Financial Statement Schedules
See below for Schedule I. The remaining financial statement schedules have been omitted because they are either not required, not applicable or the information required to be presented is included in the Company’s consolidated financial statements and notes thereto.
Schedule I - Condensed Financial Information of Registrant
ProFrac Holding Corp.
PARENT COMPANY BALANCE SHEETS
(in millions, except per share amounts or where otherwise noted)
|
|
|
|
|
|
|
|
|
|
|
December 31, |
|
|
|
2025 |
|
|
2024 |
|
ASSETS |
|
|
|
|
|
|
Current assets: |
|
|
|
|
|
|
Cash |
|
$ |
2.9 |
|
|
$ |
— |
|
Total current assets |
|
|
2.9 |
|
|
|
— |
|
Investment in subsidiaries |
|
|
881.8 |
|
|
|
1,171.5 |
|
Total assets |
|
$ |
884.7 |
|
|
$ |
1,171.5 |
|
|
|
|
|
|
|
|
LIABILITIES, MEZZANINE EQUITY, AND STOCKHOLDERS’ EQUITY |
|
|
|
|
|
|
Current liabilities: |
|
|
|
|
|
|
Current portion of tax receivable agreement liability |
|
|
4.6 |
|
|
|
3.3 |
|
Total current liabilities |
|
|
4.6 |
|
|
|
3.3 |
|
Deferred tax liabilities |
|
|
11.8 |
|
|
|
14.9 |
|
Tax receivable agreement liability |
|
|
82.0 |
|
|
|
82.9 |
|
Total liabilities |
|
|
98.4 |
|
|
|
101.1 |
|
Commitments and contingencies (Note 14) |
|
|
|
|
|
|
Mezzanine equity: |
|
|
|
|
|
|
Series A preferred stock, $0.01 par value, 50 thousand shares authorized, 50 thousand and zero shares issued and outstanding |
|
|
68.8 |
|
|
|
63.5 |
|
Redeemable noncontrolling interest |
|
|
— |
|
|
|
— |
|
|
|
|
|
|
|
|
Stockholders' equity: |
|
|
|
|
|
|
Preferred stock, $0.01 par value, 50.0 shares authorized, no shares issued and outstanding |
|
|
— |
|
|
|
— |
|
Class A common stock, $0.01 par value, 600.0 shares authorized, 180.9 and 160.2 shares issued and outstanding |
|
|
1.8 |
|
|
|
1.5 |
|
Class B common stock, $0.01 par value, 400.0 shares authorized, zero and no shares issued and outstanding |
|
|
— |
|
|
|
— |
|
Additional paid-in capital |
|
|
1,325.9 |
|
|
|
1,241.2 |
|
Accumulated deficit |
|
|
(610.2 |
) |
|
|
(235.9 |
) |
Accumulated other comprehensive income |
|
|
— |
|
|
|
0.1 |
|
Total stockholders' equity attributable to ProFrac Holding Corp. |
|
|
717.5 |
|
|
|
1,006.9 |
|
Total liabilities, mezzanine equity, and stockholders' equity |
|
$ |
884.7 |
|
|
$ |
1,171.5 |
|
The accompanying notes are an integral part of these condensed financial statements.
ProFrac Holding Corp.
PARENT COMPANY STATEMENTS OF OPERATIONS
(in millions, except per share amounts)
|
|
|
|
|
|
|
|
|
|
|
|
|
|
|
Year Ended December 31, |
|
|
|
2025 |
|
|
2024 |
|
|
2023 |
|
Revenues |
|
$ |
— |
|
|
$ |
— |
|
|
$ |
— |
|
Operating costs and expenses |
|
|
0.5 |
|
|
|
0.4 |
|
|
|
— |
|
Loss before income taxes and equity in income (loss) of subsidiaries |
|
|
(0.5 |
) |
|
|
(0.4 |
) |
|
|
— |
|
Income tax benefit |
|
|
3.0 |
|
|
|
10.4 |
|
|
|
1.0 |
|
Income (loss) before equity in income (loss) of subsidiaries |
|
|
2.5 |
|
|
|
10.0 |
|
|
|
1.0 |
|
Equity in income (loss) of subsidiaries, net of tax |
|
|
(371.5 |
) |
|
|
(225.1 |
) |
|
|
(56.9 |
) |
Net loss |
|
|
(369.0 |
) |
|
|
(215.1 |
) |
|
|
(55.9 |
) |
Less: net income attributable to redeemable noncontrolling interests |
|
|
— |
|
|
|
— |
|
|
|
(41.8 |
) |
Net loss attributable to ProFrac Holding Corp. |
|
$ |
(369.0 |
) |
|
$ |
(215.1 |
) |
|
$ |
(97.7 |
) |
Net loss attributable to Class A common shareholders |
|
$ |
(374.3 |
) |
|
$ |
(219.9 |
) |
|
$ |
(107.5 |
) |
|
|
|
|
|
|
|
|
|
|
Loss per Class A common share (basic and diluted) |
|
$ |
(2.22 |
) |
|
$ |
(1.38 |
) |
|
$ |
(0.82 |
) |
|
|
|
|
|
|
|
|
|
|
Weighted average Class A common shares outstanding: |
|
|
|
|
|
|
|
|
|
Basic |
|
|
168.3 |
|
|
|
159.9 |
|
|
|
130.9 |
|
Diluted |
|
|
168.3 |
|
|
|
159.9 |
|
|
|
130.9 |
|
The accompanying notes are an integral part of these condensed financial statements.
ProFrac Holding Corp.
PARENT COMPANY STATEMENTS OF CASH FLOWS
(in millions)
|
|
|
|
|
|
|
|
|
|
|
|
|
|
|
Year Ended December 31, |
|
|
|
2025 |
|
|
2024 |
|
|
2023 |
|
Cash flows from operating activities: |
|
|
|
|
|
|
|
|
|
Net loss |
|
$ |
(369.0 |
) |
|
$ |
(215.1 |
) |
|
$ |
(55.9 |
) |
Adjustments to reconcile net loss to net cash provided by operating activities: |
|
|
|
|
|
|
|
|
|
Equity in loss (income) of subsidiaries, net of tax |
|
|
371.5 |
|
|
|
225.1 |
|
|
|
56.9 |
|
Deferred tax expense (benefit) |
|
|
(3.1 |
) |
|
|
(10.7 |
) |
|
|
— |
|
Distributions received from ProFrac Holdings, LLC |
|
|
0.3 |
|
|
|
0.4 |
|
|
|
0.7 |
|
Changes in operating assets and liabilities: |
|
|
|
|
|
|
|
|
|
Income tax receivable |
|
|
— |
|
|
|
0.3 |
|
|
|
2.7 |
|
Income tax payable |
|
|
— |
|
|
|
— |
|
|
|
(0.1 |
) |
Tax receivable agreement liability |
|
|
0.3 |
|
|
|
— |
|
|
|
— |
|
Net cash provided by operating activities |
|
|
— |
|
|
|
— |
|
|
|
4.3 |
|
|
|
|
|
|
|
|
|
|
|
Cash flows from investing activities: |
|
|
|
|
|
|
|
|
|
Contributions to ProFrac Holdings, LLC |
|
|
(76.0 |
) |
|
|
— |
|
|
|
(53.2 |
) |
Net cash used in investing activities |
|
|
(76.0 |
) |
|
|
— |
|
|
|
(53.2 |
) |
|
|
|
|
|
|
|
|
|
|
Cash flows from financing activities: |
|
|
|
|
|
|
|
|
|
Proceeds from issuance of Series A preferred stock |
|
|
— |
|
|
|
— |
|
|
|
50.0 |
|
Payment of Series A preferred stock issuance costs |
|
|
— |
|
|
|
— |
|
|
|
(1.1 |
) |
Proceeds from issuance of common stock |
|
|
82.4 |
|
|
|
— |
|
|
|
— |
|
Payment of common stock issuance costs |
|
|
(3.5 |
) |
|
|
— |
|
|
|
— |
|
Net cash provided by financing activities |
|
|
78.9 |
|
|
|
— |
|
|
|
48.9 |
|
|
|
|
|
|
|
|
|
|
|
Net increase in cash, cash equivalents, and restricted cash |
|
|
2.9 |
|
|
|
— |
|
|
|
— |
|
Cash, cash equivalents, and restricted cash beginning of period |
|
|
— |
|
|
|
— |
|
|
|
— |
|
Cash, cash equivalents, and restricted cash end of period |
|
$ |
2.9 |
|
|
$ |
— |
|
|
$ |
— |
|
|
|
|
|
|
|
|
|
|
|
Supplemental cash flow information: |
|
|
|
|
|
|
|
|
|
Cash payments (refunds received) for income taxes, net |
|
$ |
0.3 |
|
|
$ |
0.4 |
|
|
$ |
(3.6 |
) |
The accompanying notes are an integral part of these condensed financial statements.
ProFrac Holding Corp.
NOTES TO PARENT COMPANY FINANCIAL STATEMENTS
1. ORGANIZATION AND DESCRIPTION OF BUSINESS
ProFrac Holding Corp. (“ProFrac Corp.” or “the Company”) is a holding company with substantially all of its assets and operations held by ProFrac Holdings, LLC (“ProFrac LLC”), which is a vertically integrated and innovation-driven energy services holding company providing hydraulic fracturing, proppant production, other completion services and other complementary products and services to leading upstream oil and natural gas companies engaged in the exploration and production of North American unconventional oil and natural gas resources.
Mr. Dan Wilks and Mr. Farris Wilks are brothers and are the founders and principal stockholders of the Company. Their sons, Mr. Matthew D. Wilks and Mr. Johnathan Ladd Wilks are the Company’s Executive Chairman and Chief Executive Officer, respectively. In the normal course of business, we enter into transactions with related parties where Mr. Dan Wilks and Mr. Farris Wilks and entities owned by or affiliated with them (collectively, the "Wilks Parties") hold a controlling financial interest. Under Nasdaq rules and the Company’s Related Party Transactions Policy, our Audit Committee is responsible for reviewing all related party transactions. Under the policy, potential related party transactions are subject to approval by the Audit Committee in advance or, in certain circumstances, ratification by the Audit Committee, in each case if such transactions satisfy the terms and conditions set forth in the policy. See “Note 17. Related Party Transactions” in the notes to our consolidated financial statements for further information.
Basis of Presentation
These condensed parent company financial statements reflect the unconsolidated financial position of ProFrac Corp. as the parent company to ProFrac LLC. Given that certain of our subsidiaries are restricted in their ability to transfer funds to us as a result of their debt covenants, we have prepared these condensed parent company financial statements in accordance with Rules 5-04 and 12-04 of Regulation S-X, as the restricted net assets of ProFrac LLC and its consolidated subsidiaries exceed 25% of the consolidated net assets of ProFrac Corp. This information should be read in conjunction with the consolidated financial statements and the accompanying notes of ProFrac Corp. For purposes of these condensed financial statements, the Company’s majority owned subsidiaries are recorded based upon its proportionate share of the subsidiaries’ net assets.
Company Formation
ProFrac Corp. was incorporated as a Delaware corporation on August 17, 2021, to become a holding corporation for ProFrac LLC and its subsidiaries upon completion of a corporate reorganization in conjunction with a planned initial public offering (“IPO”). On May 17, 2022, ProFrac Corp. completed its IPO and corporate reorganization and became the managing member of ProFrac LLC.
The condensed parent company financial statements presented herein are those of ProFrac Corp. In these notes to parent company financial statements, ProFrac Corp. and ProFrac LLC together are also referred to as “we,” “us,” “our,” or the “Company.”
Redeemable Noncontrolling Interests
ProFrac Corp.’s only material asset is an equity interest consisting of units representing limited liability company interests in ProFrac LLC (the “Units”). As the sole managing member of ProFrac LLC, ProFrac Corp. consolidates the financial results of ProFrac LLC and its subsidiaries and reports a noncontrolling interest related to the portion of Units not owned by ProFrac Corp. Historically, the holders of Units not owned by ProFrac Corp. also held shares of ProFrac Corp.’s Class B common stock, such that a single share of Class B common stock was issued for each Unit not owned by ProFrac Corp.
Pursuant to the Third Amended and Restated Limited Liability Company Agreement of ProFrac LLC and the Second Amended and Restated Certificate of Incorporation of ProFrac Corp., certain members of ProFrac LLC had the right to cause ProFrac LLC to redeem all or a portion of each such member's Units, together with the surrender of the same number of each such member's shares of Class B common stock, for an equivalent number of shares of Class A common stock or, at the election of our board of directors, cash. In connection with the exercise of such redemption, a corresponding number of shares of Class B common stock would be canceled. The redemption election was not considered to be within our control because the holders of Class B common stock and their affiliates controlled us through direct representation on our board of directors. As a result, we have historically presented the noncontrolling interests in ProFrac LLC as redeemable noncontrolling interests outside of permanent equity.
In April 2023, all the eligible holders of the Units (the “Redeeming Members”) submitted redemption notices with respect to all of their Units, representing an aggregate of 104.2 million ProFrac LLC units (the “Redeemed Units”), together with the
surrender and delivery of the same number of shares of our Class B common stock. The Redeeming Members include entities owned or affiliated with ProFrac Corp.'s controlling stockholders, Mr. Dan Wilks and Mr. Farris Wilks, as well as Mr. Matthew D. Wilks, our Executive Chairman, an entity affiliated with Mr. Johnathan L. Wilks, our Chief Executive Officer, and Mr. Coy Randle, a former member of our board of directors.
In April 2023, we delivered a written notice to ProFrac LLC and the Redeeming Members setting forth our election to exercise our right to purchase directly and acquire the Redeemed Units, together with the surrender and delivery of the same number of shares of our Class B common stock from the Redeeming Members.
We subsequently acquired the Redeemed Units from the Redeeming Members by issuing an aggregate of 101.1 million shares of Class A common stock on or about April 10, 2023 and the remaining 3.1 million shares on or about April 13, 2023. The surrendered shares of Class B common stock were canceled, and no shares of our Class B common stock remain issued and outstanding.
2. PREFERRED STOCK
For details regarding our preferred stock, see “Note 9. Equity” in the notes to our consolidated financial statements.
3. INCOME TAXES
For details regarding income taxes, see “Note 12. Income Taxes” in the notes to our consolidated financial statements.
4. COMMITMENTS AND CONTINGENCIES
For details regarding contingencies related to litigation, see "Note 14. Commitments and Contingencies" in the notes to our consolidated financial statements. For details regarding guarantees of certain debt instruments of our indirectly owned subsidiaries and our consolidated schedule of debt maturities, see "Note 7. Debt" in the notes to our consolidated financial statements.
|
|
|
Exhibit No. |
|
Description |
1.1† |
|
Underwriting Agreement, dated August 12, 2025, among ProFrac Holding Corp., J.P. Morgan Securities LLC and Piper Sandler & Co (incorporated by reference to Exhibit 1.1 to ProFrac Holding Corp.’s Current Report on Form 8-K filed with the SEC on August 14, 2025). |
2.1 |
|
Agreement and Plan of Merger, dated as of October 21, 2021, by and between FTS International, Inc., ProFrac Holdings, LLC and ProFrac Acquisitions, Inc. (incorporated by reference to Exhibit 2.1 to ProFrac Holding Corp.’s Registration Statement on Form S-1 (File No. 333-261255) filed with the SEC on November 22, 2021). |
2.2 |
|
Master Reorganization Agreement, dated as of May 12, 2022, by and among ProFrac Holdings, LLC, ProFrac Holding Corp. and the other parties thereto (incorporated by reference to Exhibit 2.1 to ProFrac Holding Corp.’s Current Report on Form 8-K filed with the SEC on May 18, 2022). |
2.3† |
|
Agreement and Plan of Merger, dated as of June 21, 2022, by and among U.S. Well Services, Inc., ProFrac Holding Corp. and Thunderclap Merger Sub I, Inc. (incorporated by reference to Exhibit 2.1 to ProFrac Holding Corp.’s Current Report on Form 8-K filed with the SEC on June 24, 2022). |
2.4 |
|
Master Reorganization Agreement, dated as of November 1, 2022, by and among U.S. Well Services Holdings, LLC, ProFrac Manufacturing, LLC, ProFrac Services, LLC, USWS Holdings LLC, U.S. Well Services, LLC, USWS Fleet 10, LLC and USWS Fleet 11, LLC (incorporated by reference to Exhibit 10.1 to U.S. Well Services, Holdings, LLC’s Current Report on Form 8-K filed with the SEC on Nov. 7, 2022). |
3.1 |
|
Second Amended and Restated Certificate of Incorporation of ProFrac Holding Corp. (incorporated by reference to Exhibit 3.1 to ProFrac Holding Corp.’s Current Report on Form 8-K filed with the SEC on March 28, 2023). |
3.2 |
|
Amended and Restated Bylaws of ProFrac Holding Corp., effective as of May 17, 2022 (incorporated by reference to Exhibit 3.2 to ProFrac Holding Corp.’s Current Report on Form 8-K filed with the SEC on May 18, 2022). |
3.3 |
|
Certificate of Designation of Series A Redeemable Convertible Preferred Stock (incorporated by reference to Exhibit 3.1 to ProFrac Holding Corp.’s Current Report on Form 8-K filed with the SEC on October 2, 2023). |
4.1 |
|
Form of Class A Common Stock Certificate (incorporated by reference to Exhibit 4.1 to Amendment No. 1 to ProFrac Holding Corp.’s Registration Statement on Form S-1 (File No. 333-261255) filed with the SEC on November 30, 2021). |
4.2 |
|
Registration Rights Agreement dated as of May 17, 2022, by and among ProFrac Holding Corp., THRC Holdings, LP, Farris C. Wilks and the other parties thereto (incorporated by reference to Exhibit 4.1 to ProFrac Holding Corp.’s Current Report on Form 8-K filed with the SEC on May 18, 2022). |
4.3 |
|
Third Amended and Restated Limited Liability Company Agreement of ProFrac Holdings, LLC, dated as of May 17, 2022 (incorporated by reference to Exhibit 4.2 to ProFrac Holding Corp.’s Current Report on Form 8-K filed with the SEC on May 18, 2022). |
4.4 |
|
Stockholders’ Agreement, dated as of May 17, 2022, by and among ProFrac Holding Corp., THRC Holdings, LP, Farris C. Wilks, FARJO Holdings, LP and the Farris and Jo Ann Wilks 2022 Family Trust (incorporated by reference to Exhibit 4.3 to ProFrac Holding Corp.’s Current Report on Form 8-K filed with the SEC on May 18, 2022). |
4.5 |
|
First Amendment to Stockholders’ Agreement, effective as of January 13, 2023 between ProFrac Holding Corp. and THRC Holdings, LP, Farris C. Wilks, FARJO Holdings, LP and the Farris and Jo Ann Wilks 2022 Family Trust (incorporated by reference to Exhibit 10.2 to ProFrac Holding Corp.’s Current Report on Form 8-K filed with the SEC on January 12, 2023). |
4.6 |
|
Right Agreement, dated as of December 20, 2021, by and among ProFrac Holdings, LLC and Eagleton Ventures, Inc. (incorporated by reference to Exhibit 4.5 to Amendment No. 2 to ProFrac Holding Corp.’s Registration Statement on Form S-1 (File No. 333-261255) filed with the SEC on March 31, 2022). |
4.7 |
|
Form of West Munger Registration Rights Agreement (incorporated by reference to Exhibit 4.6 to Amendment No. 3 to ProFrac Holding Corp.’s Registration Statement on Form S-1 (File No. 333-261255) originally filed with the SEC on November 22, 2021). |
4.8 |
|
Amended and Restated Placement Agent Warrants of ProFrac Holding Corp. (incorporated by reference to Exhibit 10.5 to ProFrac Holding Corp.’s Current Report on Form 8-K filed with the SEC on November 1, 2022). |
4.9 |
|
Amended and Restated RDO Warrants of ProFrac Holding Corp. (incorporated by reference to Exhibit 10.6 to ProFrac Holding Corp.’s Current Report on Form 8-K filed with the SEC on November 1, 2022). |
|
|
|
4.10 |
|
Form of Restricted Stock Unit Agreement (incorporated by reference to Exhibit 4.4 to ProFrac Holding Corp.’s Registration Statement on Form S-8 (File No. 333-265176) filed with the SEC on May 24, 2022). |
4.11 |
|
Form of Restricted Stock Unit Agreement (Directors) (incorporated by reference to Exhibit 4.5 to ProFrac Holding Corp.’s Registration Statement on Form S-8 (File No. 333-265176) filed with the SEC on May 24, 2022). |
4.12* |
|
Description of ProFrac Holding Corp.’s Securities. |
4.13 |
|
Indenture, dated December 27, 2023, by and among ProFrac Holdings II, LLC, the guarantors party thereto and U.S. Bank Trust Company, National Association, as trustee, calculation agent and collateral agent (incorporated by reference to Exhibit 4.1 to ProFrac Holding Corp.’s Current Report on Form 8-K filed with the SEC on December 28, 2023). |
4.14 |
|
Form of Senior Secured Float Rate Note (incorporated by reference to Exhibit 4.2 to ProFrac Holding Corp.’s Current Report on Form 8-K filed with the SEC on December 28, 2023). |
4.15 |
|
First Supplemental Indenture, dated as of June 12, 2024, among ProFrac Holdings II, LLC, the guarantors party thereto and U.S. Bank Trust Company, National Association, as trustee, calculation agent and collateral agent (incorporated by reference to Exhibit 4.3 to ProFrac Holding Corp.’s Current Report on Form 8-K filed with the SEC on June 14, 2024). |
4.16 |
|
Second Supplemental Indenture, dated as of June 12, 2024, among ProFrac Holdings II, LLC, Advanced Stimulation Technologies, Inc. and U.S. Bank Trust Company, National Association, as trustee, calculation agent and collateral agent (incorporated by reference to Exhibit 4.4 to ProFrac Holding Corp.’s Current Report on Form 8-K filed with the SEC on June 14, 2024). |
4.17 |
|
Fifth Supplemental Indenture, dated June 30, 2025, among ProFrac Holdings II, LLC, the guarantors party thereto and U.S. Bank Trust Company, National Association, as trustee, calculation agent and collateral agent (incorporated by reference to Exhibit 4.3 to ProFrac Holding Corp.’s Current Report on Form 8-K filed with the SEC on June 30, 2025). |
4.18 |
|
Sixth Supplemental Indenture, dated as of January 7, 2026, among ProFrac Holdings II, LLC, the guarantors party thereto and U.S. Bank Trust Company, National Association, as trustee, calculation agent and collateral agent (incorporated by reference to Exhibit 4.3 to ProFrac Holding Corp.’s Current Report on Form 8-K filed with the SEC on January 9, 2026). |
10.1 |
|
Tax Receivable Agreement, dated as of May 17, 2022, by and among ProFrac Holding Corp., the TRA Holders and the Agents named therein (incorporated by reference to Exhibit 10.1 to ProFrac Holding Corp.’s Current Report on Form 8-K filed with the SEC on May 18, 2022). |
10.2 |
|
Shared Services Agreement, dated as of May 3, 2022, by and between Wilks Brothers, LLC and ProFrac Holdings II, LLC (incorporated by reference to Exhibit 10.3 to ProFrac Holding Corp.’s Current Report on Form 8-K filed with the SEC on May 18, 2022). |
10.3 |
|
First Amendment to Term Loan Credit Agreement, dated as of July 25, 2022, by and among ProFrac Holdings II, LLC, ProFrac Holdings, LLC, the guarantors party thereto, the lenders party thereto, and Piper Sandler Finance LLC, as the agent and collateral agent for the lenders (incorporated by reference to Exhibit 10.1 to ProFrac Holding Corp.’s Current Report on Form 8-K filed with the SEC on July 29, 2022). |
10.4 |
|
First Amendment to Credit Agreement, dated as of July 25, 2022, by and among ProFrac Holdings II, LLC, ProFrac Holdings, LLC, the guarantors party thereto, the lenders party thereto, and JPMorgan Chase Bank, N.A., as the agent and collateral agent for the lenders (incorporated by reference to Exhibit 10.2 to ProFrac Holding Corp.’s Current Report on Form 8-K filed with the SEC on July 29, 2022). |
10.5^ |
|
Second Amendment to Term Loan Credit Agreement, dated as of November 1, 2022, by and among ProFrac Holdings II, LLC, ProFrac Holdings, LLC, the guarantors party thereto, the lenders party thereto, and Piper Sandler Finance LLC, as the agent and collateral agent for the lenders (incorporated by reference to Exhibit 10.1 to ProFrac Holding Corp.’s Current Report on Form 8-K filed with the SEC on November 1, 2022). |
10.6^ |
|
Second Amendment to Credit Agreement, dated as of November 1, 2022, by and among ProFrac Holdings II, LLC, ProFrac Holdings, LLC, the guarantors party thereto, the lenders party thereto, and JPMorgan Chase Bank, N.A., as the agent and collateral agent for the lenders (incorporated by reference to Exhibit 10.2 to ProFrac Holding Corp.’s Current Report on Form 8-K filed with the SEC on November 1, 2022). |
10.7 |
|
Third Amendment, Consent and Limited Waiver to Term Loan Credit Agreement, dated as of December 30, 2022, by and among ProFrac Holdings II, LLC, ProFrac Holdings, LLC, the guarantors party thereto, the lenders party thereto, and Piper Sandler Finance LLC, as the agent and collateral agent for the lenders (incorporated by reference to Exhibit 10.1 to ProFrac Holding Corp.’s Current Report on Form 8-K filed with the SEC on January 6, 2023). |
|
|
|
10.8 |
|
Third Amendment to Credit Agreement, dated as of December 30, 2022, by and among ProFrac Holdings II, LLC, ProFrac Holdings, LLC, the guarantors party thereto, the lenders party thereto, and JPMorgan Chase Bank, N.A., as the agent and collateral agent for the lenders (incorporated by reference to Exhibit 10.2 to ProFrac Holding Corp.’s Current Report on Form 8-K filed with the SEC on January 6, 2023). |
10.9 |
|
Fourth Amendment to Term Loan Credit Agreement, dated as of February 1, 2023, by and among ProFrac Holdings II, LLC, ProFrac Holdings, LLC, the guarantors party thereto, the lenders party thereto, and Piper Sandler Finance LLC, as the agent and collateral agent for the lenders (incorporated by reference to Exhibit 10.1 to ProFrac Holding Corp.’s Current Report on Form 8-K filed with the SEC on February 2, 2023). |
10.10^ |
|
Fourth Amendment to Credit Agreement, dated as of February 23, 2023, by and among ProFrac Holdings II, LLC, as borrower, ProFrac Holdings, the lenders party thereto, the letter of credit issuers party thereto and the guarantors party thereto, and JPMorgan Chase Bank, N.A., as the agent, the collateral agent and the swingline lender (incorporated by reference to Exhibit 10.11 to ProFrac Holding Corp.’s Quarterly Report on Form 10-Q filed with the SEC on May 12, 2023). |
10.11^ |
|
Fifth Amendment to Term Loan Credit Agreement, dated as of February 23, 2023, by and among ProFrac Holdings II, LLC, ProFrac Holdings, LLC, the lenders and guarantors party thereto, and Piper Sandler Finance LLC, as the agent and collateral agent for the lenders (incorporated by reference to Exhibit 10.10 to ProFrac Holding Corp.’s Quarterly Report on Form 10-Q filed with the SEC on May 12, 2023). |
10.12 |
|
Securities Purchase Agreement dated February 16, 2022 by and between Flotek Industries, Inc. and ProFrac Holdings, LLC (incorporated by reference to Exhibit 10.14 to Amendment No. 2 to ProFrac Holding Corp.’s Registration Statement on Form S-1 (File No. 333-261255) filed with the SEC on March 31, 2022). |
10.13 |
|
Securities Purchase Agreement between Flotek Industries, Inc. and ProFrac Holdings II, LLC dated June 17, 2022 (incorporated by reference to Exhibit 10.1 to Flotek Industries, Inc.’s Current Report on Form 8-K filed with the SEC on June 23, 2022). |
10.14 |
|
Purchase and Sale Agreement, dated as of February 18, 2022, by and between ProFrac Holdings, LLC and Wilks Development, LLC (incorporated by reference to Exhibit 10.6 to Amendment No. 3 to ProFrac Holding Corp.’s Registration Statement on Form S-1 (File No. 333-261255) filed with the SEC on April 26, 2022). |
10.15 |
|
Chemical Products Supply Agreement between Flotek Chemistry, LLC and ProFrac Services, LLC dated February 2, 2022 (incorporated by reference to Exhibit 10.2 to ProFrac Holding Corp.’s Current Report on Form 8-K filed with the SEC on May 23, 2022). |
10.16 |
|
Amendment No. 1 to Chemical Products Supply Agreement between Flotek Chemistry, LLC and ProFrac Services, LLC, dated May 17, 2022 (incorporated by reference to Exhibit 10.1 to ProFrac Holding Corp.’s Current Report on Form 8-K filed with the SEC on May 23, 2022). |
10.17# |
|
Consulting Agreement, effective as of January 13, 2023, between ProFrac Holding Corp. and James Coy Randle (incorporated by reference to Exhibit 10.1 to ProFrac Holding Corp.’s Current Report on Form 8-K filed with the SEC on January 12, 2023). |
10.18# |
|
ProFrac Holding Corp. 2022 Long Term Incentive Plan (incorporated by reference to Exhibit 10.2 to ProFrac Holding Corp.’s Current Report on Form 8-K filed with the SEC on May 18, 2022). |
10.19# |
|
Assignment Agreement, dated as of May 10, 2022, by and between Farris Wilks and Jo Ann Wilks, as Co-Trustees of the Farris and Jo Ann Wilks 2022 Family Trust, created by Trust Agreement dated as of May 10, 2022, as assignor, and KWELL Holdings, LP, as assignee and Declaration of Intent (incorporated by reference to Exhibit 10.18 to ProFrac Holding Corp.’s Quarterly Report on Form 10-Q filed with the SEC on August 15, 2022). |
10.20# |
|
Assignment and Assumption Agreement by and between THRC Holdings, LP, a Texas limited liability company, as assignor, and Matthew D. Wilks, as assignee (incorporated by reference to Exhibit 10.19 to ProFrac Holding Corp.’s Quarterly Report on Form 10-Q filed with the SEC on August 15, 2022). |
10.21 |
|
Amended and Restated Series A Warrant Agreement, dated November 1, 2022, between ProFrac Holding Corp. and Continental Stock Transfer & Trust Company (incorporated by reference to Exhibit 10.3 to ProFrac Holding Corp.’s Current Report on Form 8-K filed with the SEC on November 1, 2022). |
10.22 |
|
Amendment No. 1 to Amended and Restated Series A Warrant Agreement, dated November 1, 2022, between ProFrac Holding Corp., Continental Stock Transfer & Trust Company and American Stock Transfer & Trust Company, LLC (incorporated by reference to Exhibit 10.7 to ProFrac Holding Corp.’s Current Report on Form 8-K filed with the SEC on November 1, 2022). |
10.23 |
|
Amendment No. 2 to Amended and Restated Series A Warrant Agreement, dated March 29, 2023, between ProFrac Holding Corp., Continental Stock Transfer & Trust Company and American Stock |
|
|
|
|
|
Transfer & Trust Company, LLC (incorporated by reference to Exhibit 10.52 to ProFrac Holding Corp.’s Annual Report on Form 10-K filed with the SEC on March 30, 2023). |
10.24 |
|
Promissory Note, dated as of July 18, 2022, by U.S. Well Services, LLC in favor of Equify Financial, LLC (incorporated by reference to Exhibit 10.1 to U.S. Well Services Holdings, LLC’s (f/k/a U.S. Well Services, Inc.) Current Report on Form 8-K (File No. 001-38025) filed with the SEC on July 18, 2022). |
10.25 |
|
Security Agreement, dated as of July 18, 2022, by U.S. Well Services, LLC in favor of Equify Financial, LLC (incorporated by reference to Exhibit 10.2 to U.S. Well Services Holdings, LLC’s (f/k/a U.S. Well Services, Inc.) Current Report on Form 8-K (File No. 001-38025) filed with the SEC on July 18, 2022). |
10.26 |
|
Continuing Guaranty, dated as of July 18, 2022, by U.S. Well Services, Inc. in favor of Equify Financial, LLC (incorporated by reference to Exhibit 10.3 to U.S. Well Services Holdings, LLC’s (f/k/a U.S. Well Services, Inc.) Current Report on Form 8-K (File No. 001-38025) filed with the SEC on July 18, 2022). |
10.27 |
|
Promissory Note, dated as of September 30, 2022, by U.S. Well Services, LLC in favor of Equify Financial, LLC (incorporated by reference to Exhibit 10.1 to U.S. Well Services Holdings, LLC’s (f/k/a U.S. Well Services, Inc.) Current Report on Form 8-K (File No. 001-38025) filed with the SEC on September 30, 2022). |
10.28 |
|
Security Agreement, dated as of September 30, 2022, by U.S. Well Services, LLC in favor of Equify Financial, LLC (incorporated by reference to Exhibit 10.2 to U.S. Well Services Holdings, LLC’s (f/k/a U.S. Well Services, Inc.) Current Report on Form 8-K (File No. 001-38025) filed with the SEC on September 30, 2022). |
10.29† |
|
Membership Interest Purchase Agreement, dated as of December 23, 2022, by and among ProFrac Holdings II, LLC, Performance Holdings I, LLC, and Performance Holdings II, LLC (incorporated by reference to Exhibit 10.1 to ProFrac Holding Corp.’s Current Report on Form 8-K filed with the SEC on December 30, 2022). |
10.30 |
|
Assignment and Amendment of Membership Interest Purchase Agreement, dated as of February 24, 2023, by and among ProFrac Holdings II, LLC, Performance Holdings I, LLC, Performance Holdings II, LLC and Alpine Silica, LLC (incorporated by reference to Exhibit 10.2 to ProFrac Holding Corp.’s Current Report on Form 8-K filed with the SEC on February 28, 2023). |
10.31 |
|
Term Loan Credit Agreement, dated December 27, 2023, among Alpine Holdings II, LLC, PF Proppant Holdings, LLC, the guarantors party hereto, the lenders party thereto and CLMG Corp. as agent and collateral agent (incorporated by reference to Exhibit 10.1 ProFrac Holding Corp.’s Current Report on Form 8-K filed with the SEC on December 28, 2023). |
10.32 |
|
Guarantee Agreement, dated December 27, 2023, may by ProFrac Holdings Corp., as guarantor, and CLMG Group, as agent (incorporated by reference to Exhibit 10.2 ProFrac Holding Corp.’s Current Report on Form 8-K filed with the SEC on December 28, 2023. |
10.33 |
|
Guarantee Agreement, dated December 27, 2023, made by the guarantors in favor of CLMG Corp., as agent (incorporated by reference to Exhibit 10.3 to ProFrac Holding Corp.’s Current Report on Form 8-K filed with the SEC on December 28, 2023). |
10.34 |
|
Term Loan Security Agreement, dated December 27, 2023, among Alpine Holdings II, LLC, PF Proppant Holdings, LLC, certain other Affiliates of the Borrower party, Red River Land Holdings, LLC, Performance Royalty LLC, Alpine Monahans, LLC, Alpine Monahans II, LLC, Monarch Silica, LLC, Alpine Real Estate Holdings, LLC, and CLMG Corporation, as collateral agent (incorporated by reference to Exhibit 10.4 to ProFrac Holding Corp.’s Current Report on Form 8-K filed with the SEC on December 28, 2023). |
10.35 |
|
Purchase Agreement, dated December 27, 2023, by and among ProFrac Holdings II, LLC, the guarantors party thereto and the purchasers named therein (incorporated by reference to Exhibit 10.5 to ProFrac Holding Corp.’s Current Report on Form 8-K filed with the SEC on December 28, 2023). |
10.36 |
|
Guaranty Agreement, dated as of December 27, 2023, made by ProFrac Holding Corp., as parent guarantor, and U.S. Bank Trust Company, National Association, as trustee and collateral agent (incorporated by reference to Exhibit 10.6 to ProFrac Holding Corp.’s Current Report on Form 8-K filed with the SEC on December 28, 2023). |
10.37 |
|
Security Agreement, dated December 27, 2023, among ProFrac Holdings, LLC, ProFrac Holdings II, LLC, the subsidiary grantors party thereto and U.S. Bank Trust Company, National Association, as collateral agent (incorporated by reference to Exhibit 10.7 to ProFrac Holding Corp.’s Current Report on Form 8-K filed with the SEC on December 28, 2023). |
10.38† |
|
Seventh Amendment to Credit Agreement, dated December 27, 2023, by and among ProFrac Holdings II, LLC, ProFrac Holdings, LLC, the guarantors party thereto, the lenders party thereto and JP Morgan Chase Bank, N.A. (incorporated by reference to Exhibit 10.8 to ProFrac Holding Corp.’s Current Report on Form 8-K filed with the SEC on December 28, 2023). |
|
|
|
10.39 |
|
Contribution Agreement, dated as of February 24, 2023, by and among ProFrac Holding Corp., Alpine Silica LLC, Tidewater Partners, LLC, Performance Holdings I, LLC, and Performance Holdings II, LLC (incorporated by reference to Exhibit 10.3 to ProFrac Holding Corp.’s Current Report on Form 8-K filed with the SEC on February 28, 2023). |
10.40^ |
|
Master Services Agreement, effective as of December 1, 2022, by and between Alpine Silica, LLC and Interstate Earthworks, LLC (incorporated by reference to Exhibit 10.53 to ProFrac Holding Corp.’s Annual Report on Form 10-K filed with the SEC on March 30, 2023). |
10.41 |
|
Industrial Lease, effective as of November 1, 2022, by and between ProFrac Holdings II, LLC and Wilks Ranch Texas, LTD (incorporated by reference to Exhibit 10.54 to ProFrac Holding Corp.’s Annual Report on Form 10-K filed with the SEC on March 30, 2023). |
10.42 |
|
Series A Redeemable Convertible Preferred Stock Purchase Agreement, dated September 29, 2023, by and among ProFrac Holding Corp. and THRC Holdings, LP and FARJO Holdings, LP (incorporated by reference to Exhibit 10.1 to ProFrac Holding Corp.’s Current Report on Form 8-K filed with the SEC on October 2, 2023). |
10.43# |
|
Employment Agreement, dated as of June 17, 2024, between ProFrac Holding Corp. and Austin Harbour (incorporated by reference to Exhibit 10.3 to ProFrac Holding Corp.’s Quarterly Report on Form 10-Q filed with the SEC on August 9, 2024). |
10.44 |
|
Eighth Amendment to Credit Agreement, dated as of June 10, 2024, by and among ProFrac Holdings II, LLC, ProFrac Holdings, LLC, the other guarantors party thereto, the lenders party thereto and JPMorgan Chase Bank, N.A., as the agent and collateral agent for the lenders (incorporated by reference to Exhibit 10.1 to ProFrac Holding Corp.’s Current Report on Form 8-K filed with the SEC on June 14, 2024). |
10.45 |
|
Amendment to the Term Loan Security Agreement, dated June 19, 2024, among Alpine Holdings II, LLC, PF Proppant Holdings, LLC, certain other Affiliates of the Borrower party, Red River Land Holdings, LLC, Performance Royalty LLC, Alpine Monahans, LLC, Alpine Monahans II, LLC, Monarch Silica, LLC, Alpine Real Estate Holdings, LLC, and CLMG Corporation, as collateral agent (incorporated by reference to Exhibit 10.5 to ProFrac Holding Corp.’s Quarterly Report on Form 10-Q filed with the SEC on August 9, 2024). |
10.46# |
|
First Amendment to Employment Agreement, effective as of September 25, 2024, between ProFrac Holdings II, LLC and Michael Henry (incorporated by reference to Exhibit 10.1 to ProFrac Holding Corp.’s Current Report on Form 8-K filed with the SEC on October 1, 2024). |
10.47 |
|
Amendment No. 3 to Term Loan Credit Agreement and Amendment No. 1 to Guarantee Agreement, dated as of June 26, 2025, by and among Alpine Holding II, LLC, PF Proppant Holding, LLC, the subsidiary guarantor parties thereto, ProFrac Holding Corp., the several lenders thereto, and CLMG Corp. as the agent and collateral agent (incorporated by reference to Exhibit 10.1 to ProFrac Holding Corp.’s Current Report on Form 8-K filed with the SEC on June 30, 2025). |
10.48† |
|
Purchase Agreement, dated June 30, 2025, among ProFrac Holdings II, LLC, the guarantors party thereto and Beal Bank USA and Wilks Brothers, LLC (incorporated by reference to Exhibit 10.2 to ProFrac Holding Corp.’s Current Report on Form 8-K filed with the SEC on June 30, 2025). |
10.49 |
|
Letter Agreement to Shared Services Agreement, dated June 30, 2025, by and between ProFrac Holdings II, LLC and Wilks Brothers, LLC. |
10.50 |
|
ProFrac Holding Corp. 2025 Employee Stock Purchase Plan (incorporated by reference to Exhibit 4.5 to ProFrac Holding Corp.’s Registration Statement on Form S-8 (File No. 333-290012) filed with the SEC on September 3, 2025). |
10.51 |
|
Amendment No. 4 to Credit Agreement, dated as of December 19, 2025, by and among Alpine Holding II, LLC, PF Proppant Holding, LLC, the subsidiary guarantors party thereto, the lenders thereto, and CLMG Corp. as the agent and collateral agent (incorporated by reference to Exhibit 10.1 to ProFrac Holding Corp.’s Current Report on Form 8-K filed with the SEC on December 19, 2025). |
10.52* |
|
Form of Indemnification Agreement. |
10.53 |
|
Ninth Amendment to Credit Agreement, dated as of March 3, 2026, by and among ProFrac, Holdings II, LLC, a Texas limited liability company, ProFrac Holdings, LLC, a Texas limited liability company, the other Guarantors party hereto, each of the Lenders party hereto and JPMorgan Chase Bank, N.A., as the agent and the collateral agent (incorporated by reference to Exhibit 10.1 to ProFrac Holding Corp.’s Current Report on Form 8-K filed with the SEC on March 9, 2026). |
19* |
|
Insider Trading Policy. |
21.1* |
|
List of Subsidiaries of ProFrac Holding Corp. |
23.1* |
|
Consent of Grant Thornton LLP. |
23.2* |
|
Consent of John T. Boyd Company. |
____________________________
* Filed herewith.
** Furnished herewith.
# Compensatory plan or arrangement.
† The schedules have been omitted pursuant to Item 601(a)(5) of Regulation S-K. The Company agrees to furnish supplementally a copy of such schedules, or any section thereof, to the SEC upon request.
^ Certain portions of this exhibit have been redacted pursuant to Item 601(b)(10)(iv) of Regulation S-K. The registrant agrees to furnish supplementally an unredacted copy of the exhibit to the Securities and Exchange Commission upon its request.
Item 16. Form 10-K Summary
None.
SIGNATURES
Pursuant to the requirements of Section 13 or 15(d) of the Securities Exchange Act of 1934, the registrant has duly caused this report to be signed on its behalf by the undersigned, thereunto duly authorized.
|
|
|
|
PROFRAC HOLDING CORP. |
|
|
|
Date: March 13, 2026 |
By: |
/s/ Matthew D. Wilks |
|
|
Name: Matthew D. Wilks |
|
|
Title: Executive Chairman and Director (Principal Executive Officer) |
Pursuant to the requirements of the Securities Exchange Act of 1934, this Annual Report on Form 10-K has been signed below by the following persons on behalf of the registrant and in the capacities and on the dates indicated.
|
|
|
|
|
|
|
|
|
|
|
Signature |
|
Title |
Date |
|
|
|
/s/ Matthew D. Wilks Matthew D. Wilks |
|
Executive Chairman and Director (Principal Executive Officer) |
March 13, 2026 |
|
|
|
/s/ Johnathan Ladd Wilks Johnathan Ladd Wilks |
|
Chief Executive Officer |
March 13, 2026 |
|
|
|
/s/Austin Harbour Austin Harbour |
Chief Financial Officer (Principal Financial Officer) |
March 13, 2026 |
|
|
|
/s/Michael S. Henry Michael S. Henry |
|
Principal Accounting Officer (Principal Accounting Officer) |
March 13, 2026 |
|
|
|
|
/s/Theresa Glebocki |
|
Director |
March 13, 2026 |
Theresa Glebocki |
|
|
|
|
|
/s/Gerald Haddock |
|
Director |
March 13, 2026 |
Gerald Haddock |
|
|
|
|
|
/s/Sergei Krylov |
|
Director |
March 13, 2026 |
Sergei Krylov |
|
|
|
|
|
/s/Stacy Nieuwoudt |
|
Director |
March 13, 2026 |
Stacy Nieuwoudt |
|
|
|
|
|
/s/Matthew Rinaldi Matthew Rinaldi |
|
Director |
March 13, 2026 |
|
|