
Exhibit 99.1 ProFrac Holdings Investor Presentation June 2023 w w w . P F H o l d i n g s C o r p . c o m J u n e 2 0 2 3

2 Cautionary Statements Forward-Looking Statements Certain statements in this presentation may be considered “forward-looking statements” within the meaning of the “safe harbor” provisions of the Private Securities Litigation Reform Act of 1995. In some cases, the reader can identify forward-looking statements by words such as “may,” “should,” “expect,” “intend,” “will,” “estimate,” “anticipate,” “believe,” “predict,” or similar words. Forward-looking statements relate to future events or ProFrac’s future financial or operating performance. These forward-looking statements include, among other things, statements regarding: ProFrac’s strategies and plans for growth; ProFrac’s positioning, resources, capabilities, and expectations for future performance; market and industry expectations; perceived advantages of ProFrac’s Clean Fleet Technology and Engine Standby Controllers systems, including expectations of reduced costs, improved and operational efficiencies; the anticipated benefits of ProFrac’s portfolio companies and other investments, including benefits associated with scaling ProFrac’s vertically integrated business model, increasing ProFrac’s sand mining capabilities and sand supply, improving ProFrac’s operational efficiency, increasing ProFrac’s nameplate production capabilities, capturing proppant and logistics margins, and realizing other potential cost savings, minimizing supply chain disruptions, increasing value to ProFrac’s customers, increasing ProFrac’s pressure pumping service capabilities and expanding ProFrac’s geographic footprint and active fleet count; expectations of demand for ProFrac’s products and services; industry shifts toward utilization of ProFrac’s products and services; the expected impact of inflationary pressures, global crude oil supply-demand balance and supply chain constraints on ProFrac’s business operations and financial performance; any financial or other information based upon or otherwise incorporating judgments or estimates relating to future performance, events or expectations; and any estimates and forecasts of financial and other performance metrics including, but not limited to, related to supply and demand of and for ProFrac’s products and services and industry wide pricing and demand expectations. Such forward-looking statements are based upon assumptions made by ProFrac as of the date hereof and are subject to risks, uncertainties, and other factors that could cause actual results to differ materially from those expressed or implied by such forward looking statements. Factors that may cause actual results to differ materially from current expectations include, but are not limited to: the risk that ProFrac will not realize the anticipated benefits of its completed and potential future acquisitions or other strategic transactions; the failure to operationalize and upgrade, as applicable, acquired operations, services and assets in a timely manner or at all; risks associated with ProFrac’s ability to effectively scale its operations and integrate acquired services, assets and personnel into its existing business model; ProFrac’s ability to execute its business strategy and plans for growth; industry conditions, including fluctuations in supply, demand and prices for ProFrac’s products and services; global and regional economic and financial conditions; the effectiveness of ProFrac’s risk management strategies; and other risks and uncertainties set forth in the sections entitled “Risk Factors” and “Cautionary Note Regarding Forward-Looking Statements” in ProFrac’s filings with the Securities and Exchange Commission (“SEC”), which are available on the SEC’s website at www.sec.gov. Nothing in this presentation should be regarded as a representation by any person that the forward-looking statements set forth in this presentation will be achieved or that any of the contemplated results of such forward looking statements will be achieved. There may be additional risks about which ProFrac is presently unaware or that ProFrac currently believes are immaterial that could also cause actual results to differ from those contained in the forward-looking statements. The reader should not place undue reliance on forward-looking statements, which speak only as of the date they are made. ProFrac anticipates that subsequent events and developments will cause its assessments to change. However, while ProFrac may elect to update these forward-looking statements at some point in the future, it expressly disclaims any duty to update these forward-looking statements, except as otherwise required by law. Industry and Market Data This presentation has been prepared by ProFrac and includes market data and certain other statistical information from third-party sources. Although we believe these third-party sources are reliable as of their respective dates, we have not independently verified the accuracy or completeness of this information. Some data is also based on our good faith estimates. The industry in which we operate is subject to a high degree of uncertainty and risk due to a variety of factors. These and other factors could cause results to differ materially from those expressed in these publications. Additionally, descriptions herein of market conditions and opportunities are presented for informational purposes only; there can be no assurance that such conditions will actually occur. Please also see “Forward-Looking Statements.” Non-GAAP Financial Measures We have included certain financial measures that are not calculated in accordance with generally accepted accounting principles (“GAAP”) in this presentation, including Adjusted EBITDA, Adjusted EBITDA margin and Annualized EBITDA per fleet. Adjusted EBITDA, Adjusted EBITDA margin and Annualized EBITDA per fleet are non-GAAP financial measures and should not be considered as substitutes for net income, net loss, operating loss or any other performance measure derived in accordance with GAAP or as an alternative to net cash provided by operating activities as a measure of our profitability or liquidity. Adjusted EBITDA, Adjusted EBITDA margin and Annualized EBITDA per fleet are supplemental measures utilized by our management and other users of our financial statements such as investors, commercial banks, research analysts and others, to assess our financial performance because they allow us to compare our operating performance on a consistent basis across periods by removing the effects of our capital structure (such as varying levels of interest expense), asset base (such as depreciation and amortization) and items outside the control of our management team (such as income tax rates). We view Adjusted EBITDA, Adjusted EBITDA margin and Annualized EBITDA per fleet as important indicators of performance. We define Adjusted EBITDA as our net income (loss), before (i) interest expense, net, (ii) income tax provision, (iii) depreciation, depletion and amortization, (iv) loss on disposal of assets, stock-based compensation and (v) other unusual or non-recurring charges, such as costs related to our initial public offering, non-recurring supply commitment charges, certain bad debt expense and gain on extinguishment of debt. We define Adjusted EBITDA margin as Adjusted EBITDA divided by total revenue. We define Annualized EBITDA per fleet as for a particular quarter as Adjusted EBITDA multiplied by four and divided by the average number of active fleets for the quarter. Annualized information contained in this presentation is calculated by multiplying the relevant metric for a given quarter by four. You should not unduly rely on annualized metrics as they are based on assumptions that may prove to be inaccurate. Our actual reported results for future periods may differ significantly from those implied by illustrative annualized information. We believe that our presentation of Adjusted EBITDA, Adjusted EBITDA margin and Annualized EBITDA per fleet will provide useful information to investors in assessing our financial condition and results of operations. In particular, we believe Annualized EBITDA per fleet allows investors to compare the performance of our fleets across comparable periods and against the fleets of our competitors who may have different capital structures, which may make a fleet-for-fleet comparison more difficult. Net income (loss) is the GAAP measure most directly comparable to Adjusted EBITDA and net income (loss) per fleet is the GAAP measure most directly comparable to Annualized EBITDA per fleet. Adjusted EBITDA should not be considered as an alternative to net income (loss), and Annualized EBITDA per fleet should not be considered as an alternative to net income (loss) per fleet. Adjusted EBITDA, Adjusted EBITDA margin and Annualized EBITDA per fleet have important limitations as analytical tools because they exclude some but not all items that affect the most directly comparable GAAP financial measure. You should not consider Adjusted EBITDA, Adjusted EBITDA margin or Annualized EBITDA per fleet in isolation or as a substitute for an analysis of our results as reported under GAAP. Because Adjusted EBITDA, Adjusted EBITDA margin and Annualized EBITDA per fleet may be defined differently by other companies in our industry, our definition of these non-GAAP financial measures may not be comparable to similarly titled measures of other companies, thereby diminishing their utility. Unless otherwise indicated, non-GAAP financial measures presented herein include the results of Flotek and only include the results from acquisitions from their respective dates of acquisition.

3 Snapshot of ProFrac Holding Corp. • W h i t e s p a c e e x p e r i e n c e d i n p a r t o f Q 1 h a s p e r s i s t e d t h r o u g h o u t Q 2 • R i g h t - s i z i n g o f c o s t s t r u c t u r e i m p l e m e n t e d Emerging i n J u n e Q2 Themes • F u l l - c y c l e c o m m e r c i a l a p p r o a c h i m p l e m e n t e d n d • D e p l o y e d 2 P r o F r a c c o n s t r u c t e d e l e c t r i c f l e e t d u r i n g t h e q u a r t e r ~35 22.8 MM $2.2B $3.3B E s t i m a t e d A n n u a l S a n d M a r k e t E n t e r p r i s e A v e r a g e P r o d u c t i o n C a p V a l e ( 2 ) F l e e t s C a p a c i t y ( 6 / 1 6 / 2 3 ) ( 6 / 1 6 / 2 3 ) Q 2 2 0 2 3 (1) Excludes net debt attributable to FloTek. (2) Defined as the annualized sum of cash from operations and cash from investing, excluding acquisitions, as a percentage of Market Cap. Market Cap as of June 16, 2023.
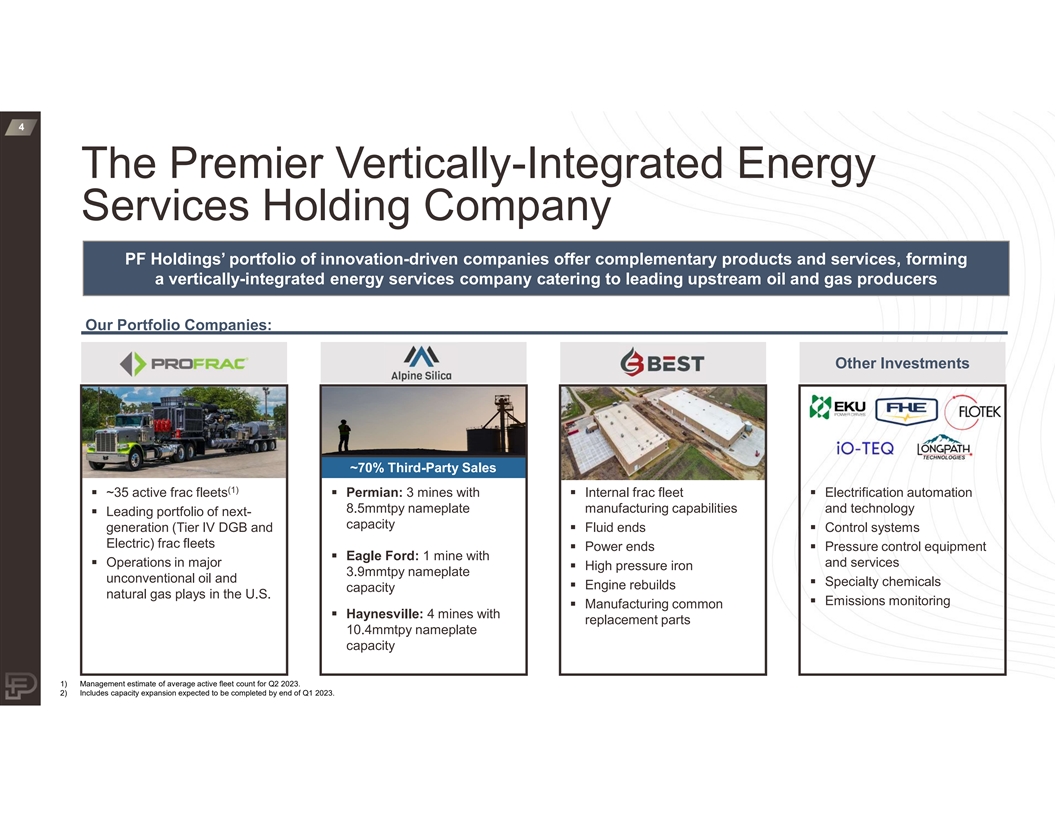
4 The Premier Vertically-Integrated Energy Services Holding Company PF Holdings’ portfolio of innovation-driven companies offer complementary products and services, forming a vertically-integrated energy services company catering to leading upstream oil and gas producers Our Portfolio Companies: Other Investments ~70% Third-Party Sales (1) § ~35 active frac fleets§ Permian: 3 mines with § Internal frac fleet § Electrification automation 8.5mmtpy nameplate manufacturing capabilities and technology § Leading portfolio of next- capacity generation (Tier IV DGB and § Fluid ends § Control systems Electric) frac fleets § Power ends§ Pressure control equipment § Eagle Ford: 1 mine with § Operations in major and services § High pressure iron 3.9mmtpy nameplate unconventional oil and § Specialty chemicals § Engine rebuilds capacity natural gas plays in the U.S. § Emissions monitoring § Manufacturing common § Haynesville: 4 mines with replacement parts 10.4mmtpy nameplate capacity 1) Management estimate of average active fleet count for Q2 2023. 2) Includes capacity expansion expected to be completed by end of Q1 2023.
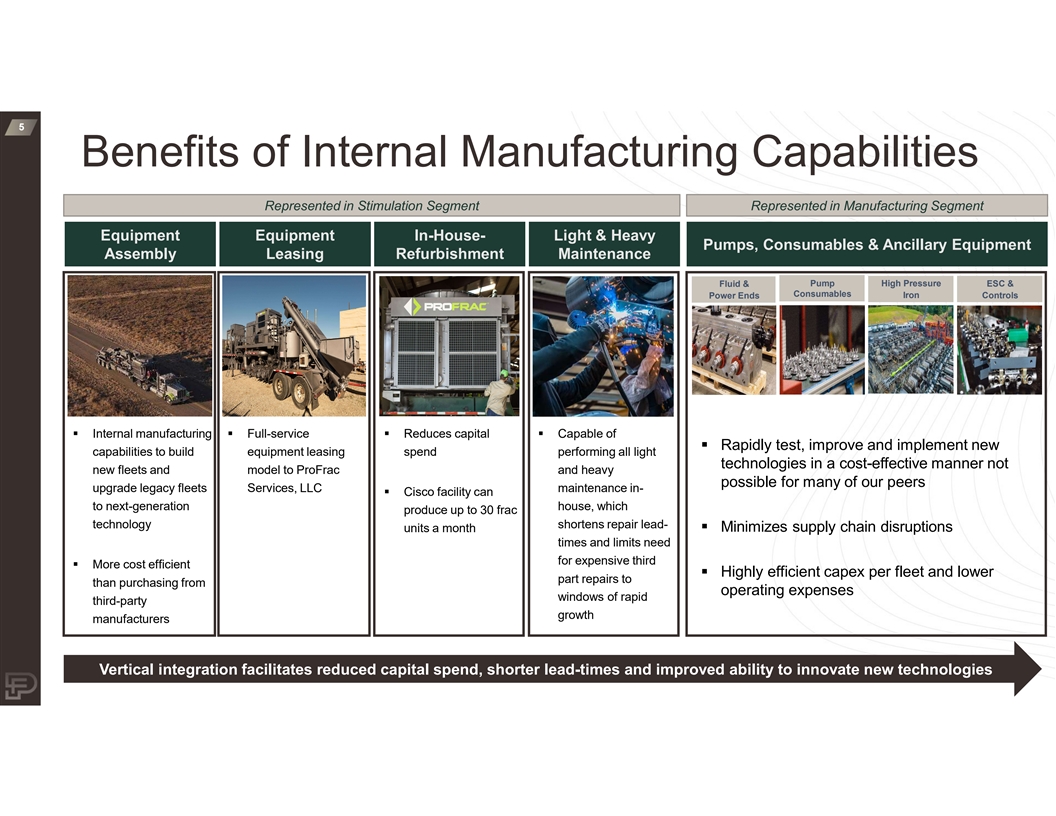
5 Benefits of Internal Manufacturing Capabilities Represented in Stimulation Segment Represented in Manufacturing Segment Equipment Equipment In-House- Light & Heavy Pumps, Consumables & Ancillary Equipment Assembly Leasing Refurbishment Maintenance Fluid & Pump High Pressure ESC & Consumables Power Ends Iron Controls § Internal manufacturing § Full-service § Reduces capital § Capable of § Rapidly test, improve and implement new capabilities to build equipment leasing spend performing all light technologies in a cost-effective manner not new fleets and model to ProFrac and heavy possible for many of our peers upgrade legacy fleets Services, LLC maintenance in- § Cisco facility can to next-generation house, which produce up to 30 frac technology shortens repair lead- units a month§ Minimizes supply chain disruptions times and limits need for expensive third § More cost efficient § Highly efficient capex per fleet and lower part repairs to than purchasing from operating expenses windows of rapid third-party growth manufacturers Vertical integration facilitates reduced capital spend, shorter lead-times and improved ability to innovate new technologies
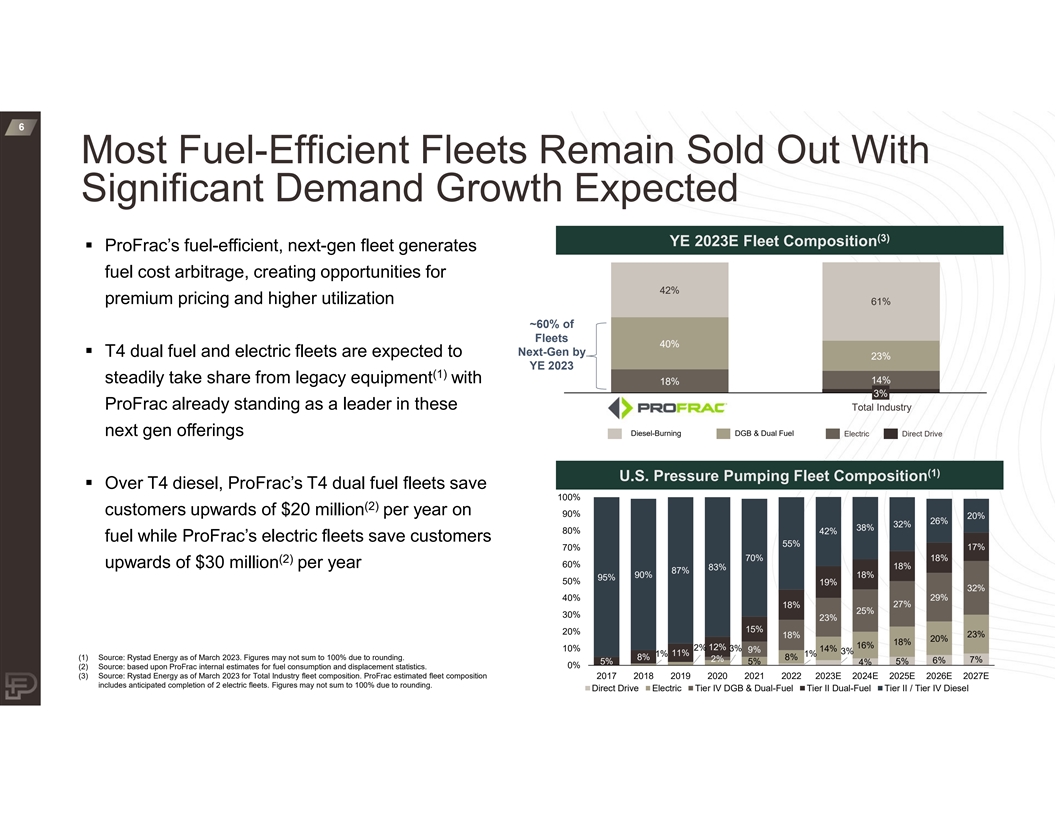
6 Most Fuel-Efficient Fleets Remain Sold Out With Significant Demand Growth Expected (3) YE 2023E Fleet Composition § ProFrac’s fuel-efficient, next-gen fleet generates fuel cost arbitrage, creating opportunities for 42% premium pricing and higher utilization 61% ~60% of Fleets 40% Next-Gen by § T4 dual fuel and electric fleets are expected to 23% YE 2023 (1) steadily take share from legacy equipment with 14% 18% 3% ProFrac already standing as a leader in these Total Industry next gen offerings Diesel-Burning DGB & Dual Fuel Electric Direct Drive (1) U.S. Pressure Pumping Fleet Composition § Over T4 diesel, ProFrac’s T4 dual fuel fleets save 100% (2) customers upwards of $20 million per year on 90% 20% 26% 32% 38% 80% 42% fuel while ProFrac’s electric fleets save customers 55% 70% 17% 70% 18% (2) upwards of $30 million per year 60% 18% 83% 87% 90% 18% 95% 50% 19% 32% 40% 29% 18% 27% 25% 30% 23% 15% 20% 23% 18% 20% 18% 16% 2% 12% 10% 3% 14% 9% 3% 11% 1% 1% (1) Source: Rystad Energy as of March 2023. Figures may not sum to 100% due to rounding. 8% 8% 2% 7% 5% 5% 5% 6% 4% 0% (2) Source: based upon ProFrac internal estimates for fuel consumption and displacement statistics. (3) Source: Rystad Energy as of March 2023 for Total Industry fleet composition. ProFrac estimated fleet composition 2017 2018 2019 2020 2021 2022 2023E 2024E 2025E 2026E 2027E includes anticipated completion of 2 electric fleets. Figures may not sum to 100% due to rounding. Direct Drive Electric Tier IV DGB & Dual-Fuel Tier II Dual-Fuel Tier II / Tier IV Diesel

7 Attractively Positioned with Diversification Across Customer Base and Basin Stimulation Segment ~2 Active Fleets In (1) (1) Est. Q2 Average the Bakken ~5.5 Active Fleets In Appalachia ~1 Active Fleet In the Rockies Operating Locations ProFrac Willow Park Headquarters ~7 Active Fleets In ProFrac Houston Offices Haynesville ProFrac Mine Locations 4 Mines with 10.4MMTPY ProFrac Manufacturing Hubs Capacity BEST Pump & Flow ~12 Active Fleets ~7.5 Active Fleets In the Permian In the Eagle Ford 3 Mines with 1 Mine with 8.3MMTPY 3.9MMTPY Capacity Capacity Note: Represents estimated Q2 2023 averages for fleet counts.

8 Pressure Pumping Industry Backdrop Remains Constructive § Pressure pumping supply tightly held by small group of disciplined players § Equipment utilization expected to remain elevated, supporting industry pricing and profitability § Global crude oil supply-demand balance expected to remain tight for the foreseeable future § Natural gas forward curve is supportive of future activity in key unconventional gas basins Industry Supply and Utilization¹ Global Crude Oil Supply-Demand Balance² Natural Gas Forward Curve³ (MMHHP) (% Utilization) (MMBbls/day) ($MMBtu at Henry Hub) 1) Source: Rystad Energy as of March 2023. 2) Source: EIA and Bloomberg. As of June 1, 2023. 3) Source: Bloomberg as of June 1, 2023.
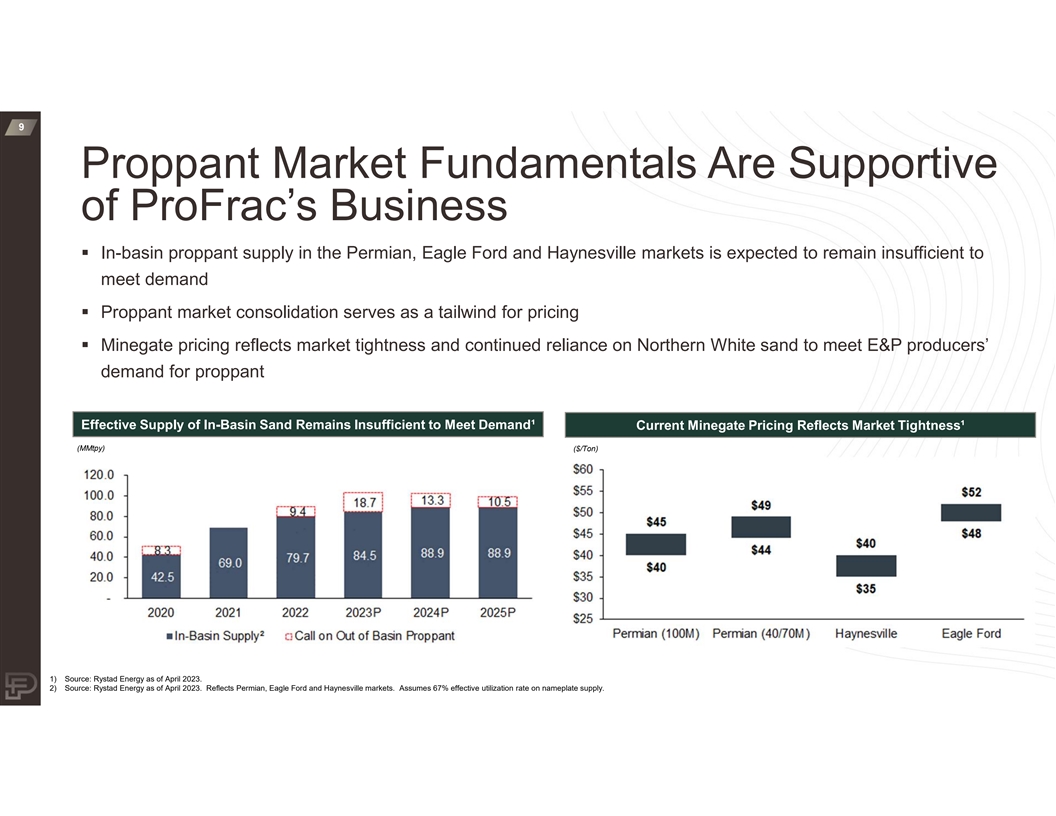
9 Proppant Market Fundamentals Are Supportive of ProFrac’s Business § In-basin proppant supply in the Permian, Eagle Ford and Haynesville markets is expected to remain insufficient to meet demand § Proppant market consolidation serves as a tailwind for pricing § Minegate pricing reflects market tightness and continued reliance on Northern White sand to meet E&P producers’ demand for proppant Effective Supply of In-Basin Sand Remains Insufficient to Meet Demand¹ Current Minegate Pricing Reflects Market Tightness¹ (MMtpy) ($/Ton) 1) Source: Rystad Energy as of April 2023. 2) Source: Rystad Energy as of April 2023. Reflects Permian, Eagle Ford and Haynesville markets. Assumes 67% effective utilization rate on nameplate supply.
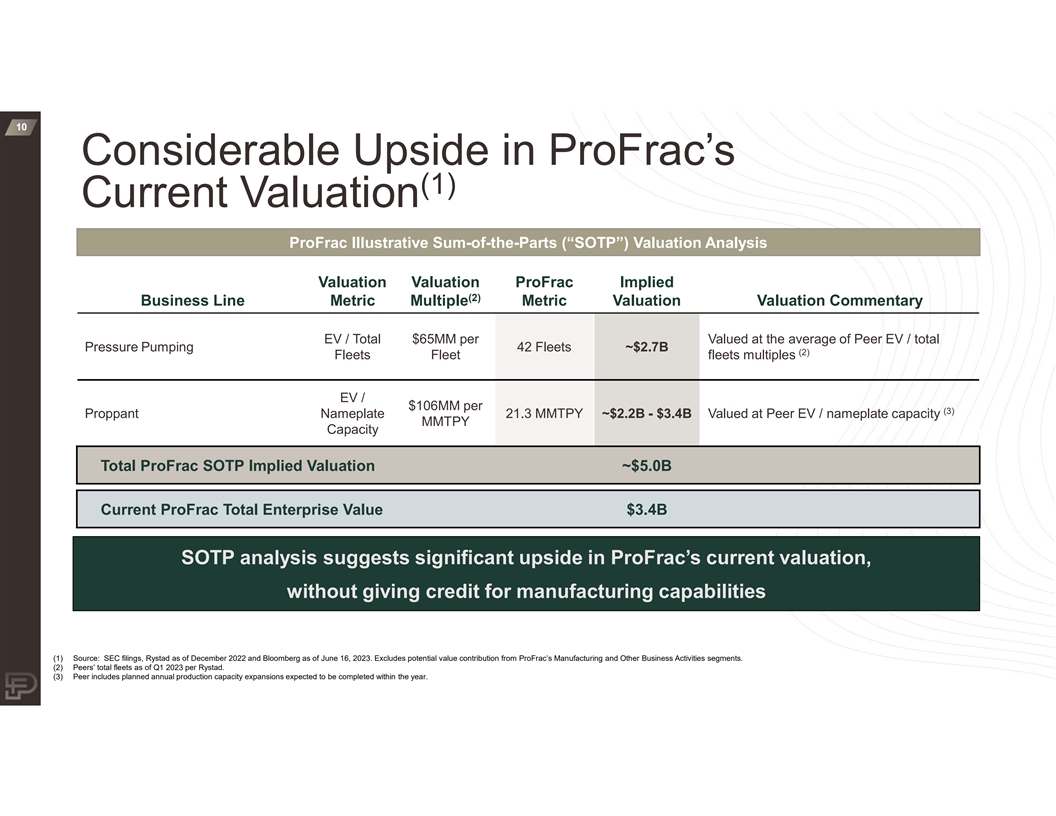
10 Considerable Upside in ProFrac’s (1) Current Valuation ProFrac Illustrative Sum-of-the-Parts (“SOTP”) Valuation Analysis Valuation Valuation ProFrac Implied (2) Business Line Metric Multiple Metric Valuation Valuation Commentary EV / Total $65MM per Valued at the average of Peer EV / total Pressure Pumping 42 Fleets ~$2.7B (2) Fleets Fleet fleets multiples EV / $106MM per (3) Proppant Nameplate 21.3 MMTPY ~$2.2B - $3.4B Valued at Peer EV / nameplate capacity MMTPY Capacity Total ProFrac SOTP Implied Valuation ~$5.0B Current ProFrac Total Enterprise Value $3.4B SOTP analysis suggests significant upside in ProFrac’s current valuation, without giving credit for manufacturing capabilities (1) Source: SEC filings, Rystad as of December 2022 and Bloomberg as of June 16, 2023. Excludes potential value contribution from ProFrac’s Manufacturing and Other Business Activities segments. (2) Peers’ total fleets as of Q1 2023 per Rystad. (3) Peer includes planned annual production capacity expansions expected to be completed within the year.
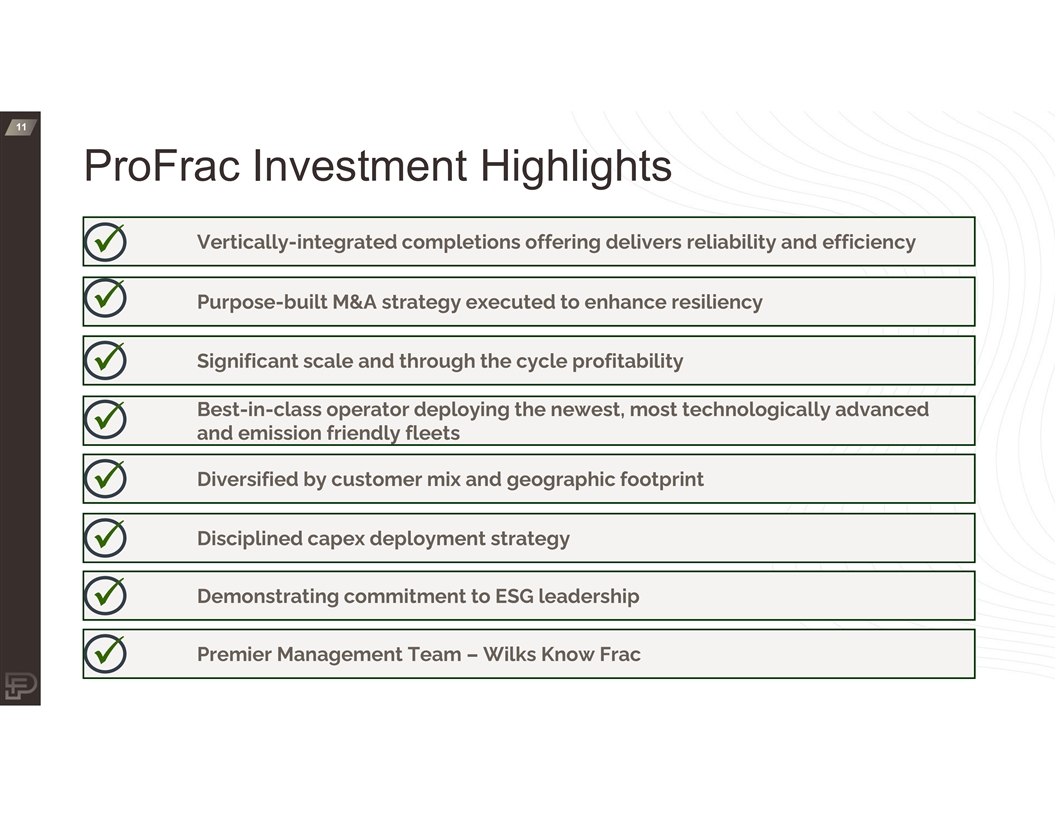
11 ProFrac Investment Highlights Vertically-integrated completions offering delivers reliability and efficiency ü Purpose-built M&A strategy executed to enhance resiliency ü Significant scale and through the cycle profitability ü B Be es st t- -i in n- -c cl la as ss s o op pe er ra at to or r d de ep pl lo oy yi in ng g t th he e n ne ew we es st t,, m mo os st t t te ec ch hn no ol lo og gi ic ca al ll ly y a ad dv va an nc ce ed d ü and emission friendly fleets Diversified by customer mix and geographic footprint ü Disciplined capex deployment strategy ü Demonstrating commitment to ESG leadership ü Premier Management Team – Wilks Know Frac ü