

ProFrac Holdings Investor Presentation February 2023 www.PFHoldingsCorp.com February 2023 Exhibit 99.1

Cautionary Statements Forward-Looking Statements Certain statements in this presentation may be considered “forward-looking statements” within the meaning of the “safe harbor” provisions of the Private Securities Litigation Reform Act of 1995. In some cases, the reader can identify forward-looking statements by words such as “may,” “should,” “expect,” “intend,” “will,” “estimate,” “anticipate,” “believe,” “predict,” or similar words. Forward-looking statements relate to future events or ProFrac’s future financial or operating performance. These forward-looking statements include, among other things, statements regarding: ProFrac’s strategies and plans for growth; ProFrac’s positioning, resources, capabilities, and expectations for future performance; market and industry expectations; ProFrac’s expected sources and uses of capital in future periods, including any capital that may become available to ProFrac under its credit facilities; perceived advantages of ProFrac’s Clean Fleet Technology and Engine Standby Controllers systems, including expectations of reduced costs, improved operational efficiencies and safety enhancements; expectations regarding ProFrac’s ability to execute on its M&A strategy and secure adequate funding to consummate any future acquisitions or other strategic transactions ProFrac may enter into in a sufficient and timely manner and without impairing ProFrac’s liquidity position; the anticipated benefits of ProFrac’s acquisitions of FTS International, U.S. Well Services, REV Energy Services and Monarch’s Eagle Ford sand mining operations, including benefits associated with scaling ProFrac’s vertically integrated business model, increasing ProFrac’s sand mining capabilities and sand supply, improving ProFrac’s operational efficiency, increasing ProFrac’s nameplate production capabilities, capturing proppant and logistics margins, reducing royalty payments and realizing other potential cost savings, increasing value to ProFrac’s customers, increasing ProFrac’s pressure pumping service capabilities and expanding ProFrac’s geographic footprint and active fleet count; expectations of demand for ProFrac’s products and services; the expected impact of inflationary pressures and supply chain constraints on ProFrac’s business operations and financial performance; any financial or other information based upon or otherwise incorporating judgments or estimates relating to future performance, events or expectations; and any estimates and forecasts of financial and other performance metrics. Such forward-looking statements are based upon assumptions made by ProFrac as of the date hereof and are subject to risks, uncertainties, and other factors that could cause actual results to differ materially from those expressed or implied by such forward-looking statements. Factors that may cause actual results to differ materially from current expectations include, but are not limited to: the risk that ProFrac will be unable to expand or otherwise modify its existing credit facilities in a timely manner, on favorable terms, or at all; risks relating to ProFrac’s liquidity needs; the risk that ProFrac will not realize the anticipated benefits of its completed and potential future acquisitions or other strategic transactions; the failure to operationalize and upgrade, as applicable, acquired operations, services and assets in a timely manner or at all; risks associated with ProFrac’s ability to effectively scale its operations and integrate acquired services, assets and personnel into its existing business model; ProFrac’s ability to execute its business strategy and plans for growth; industry conditions, including fluctuations in supply, demand and prices for ProFrac’s products and services; global and regional economic and financial conditions; the effectiveness of ProFrac’s risk management strategies; and other risks and uncertainties set forth in the sections entitled “Risk Factors” and “Cautionary Note Regarding Forward-Looking Statements” in ProFrac’s filings with the Securities and Exchange Commission (“SEC”), which are available on the SEC’s website at www.sec.gov. Nothing in this presentation should be regarded as a representation by any person that the forward-looking statements set forth in this presentation will be achieved or that any of the contemplated results of such forward looking statements will be achieved. There may be additional risks about which ProFrac is presently unaware or that ProFrac currently believes are immaterial that could also cause actual results to differ from those contained in the forward-looking statements. The reader should not place undue reliance on forward-looking statements, which speak only as of the date they are made. ProFrac anticipates that subsequent events and developments will cause its assessments to change. However, while ProFrac may elect to update these forward-looking statements at some point in the future, it expressly disclaims any duty to update these forward-looking statements, except as otherwise required by law. Industry and Market Data This presentation has been prepared by ProFrac and includes market data and certain other statistical information from third-party sources. Although we believe these third-party sources are reliable as of their respective dates, we have not independently verified the accuracy or completeness of this information. Some data is also based on our good faith estimates. The industry in which we operate is subject to a high degree of uncertainty and risk due to a variety of factors. These and other factors could cause results to differ materially from those expressed in these publications. Additionally, descriptions herein of market conditions and opportunities are presented for informational purposes only; there can be no assurance that such conditions will actually occur. Please also see “Forward-Looking Statements.” Non-GAAP Financial Measures We have included certain financial measures that are not calculated in accordance with generally accepted accounting principles (“GAAP”) in this presentation, including Adjusted EBITDA, Adjusted EBITDA margin and Annualized EBITDA per fleet. Adjusted EBITDA, Adjusted EBITDA margin and Annualized EBITDA per fleet are non-GAAP financial measures and should not be considered as substitutes for net income, net loss, operating loss or any other performance measure derived in accordance with GAAP or as an alternative to net cash provided by operating activities as a measure of our profitability or liquidity. Adjusted EBITDA, Adjusted EBITDA margin and Annualized EBITDA per fleet are supplemental measures utilized by our management and other users of our financial statements such as investors, commercial banks, research analysts and others, to assess our financial performance because they allow us to compare our operating performance on a consistent basis across periods by removing the effects of our capital structure (such as varying levels of interest expense), asset base (such as depreciation and amortization) and items outside the control of our management team (such as income tax rates). We view Adjusted EBITDA, Adjusted EBITDA margin and Annualized EBITDA per fleet as important indicators of performance. We define Adjusted EBITDA as our net income (loss), before (i) interest expense, net, (ii) income tax provision, (iii) depreciation, depletion and amortization, (iv) loss on disposal of assets, stock-based compensation and (v) other unusual or non-recurring charges, such as costs related to our initial public offering, non-recurring supply commitment charges, certain bad debt expense and gain on extinguishment of debt. We define Adjusted EBITDA margin as Adjusted EBITDA divided by total revenue. We define Annualized EBITDA per fleet as for a particular quarter as Adjusted EBITDA multiplied by four and divided by the average number of active fleets for the quarter. Annualized information contained in this presentation is calculated by multiplying the relevant metric for a given quarter by four. You should not unduly rely on annualized metrics as they are based on assumptions that may prove to be inaccurate. Our actual reported results for future periods may differ significantly from those implied by illustrative annualized information. We believe that our presentation of Adjusted EBITDA, Adjusted EBITDA margin and Annualized EBITDA per fleet will provide useful information to investors in assessing our financial condition and results of operations. In particular, we believe Annualized EBITDA per fleet allows investors to compare the performance of our fleets across comparable periods and against the fleets of our competitors who may have different capital structures, which may make a fleet-for-fleet comparison more difficult. Net income (loss) is the GAAP measure most directly comparable to Adjusted EBITDA and net income (loss) per fleet is the GAAP measure most directly comparable to Annualized EBITDA per fleet. Adjusted EBITDA should not be considered as an alternative to net income (loss), and Annualized EBITDA per fleet should not be considered as an alternative to net income (loss) per fleet. Adjusted EBITDA, Adjusted EBITDA margin and Annualized EBITDA per fleet have important limitations as analytical tools because they exclude some but not all items that affect the most directly comparable GAAP financial measure. You should not consider Adjusted EBITDA, Adjusted EBITDA margin or Annualized EBITDA per fleet in isolation or as a substitute for an analysis of our results as reported under GAAP. Because Adjusted EBITDA, Adjusted EBITDA margin and Annualized EBITDA per fleet may be defined differently by other companies in our industry, our definition of these non-GAAP financial measures may not be comparable to similarly titled measures of other companies, thereby diminishing their utility. Unless otherwise indicated, non-GAAP financial measures presented herein include the results of Flotek and only include the results from acquisitions from their respective dates of acquisition.
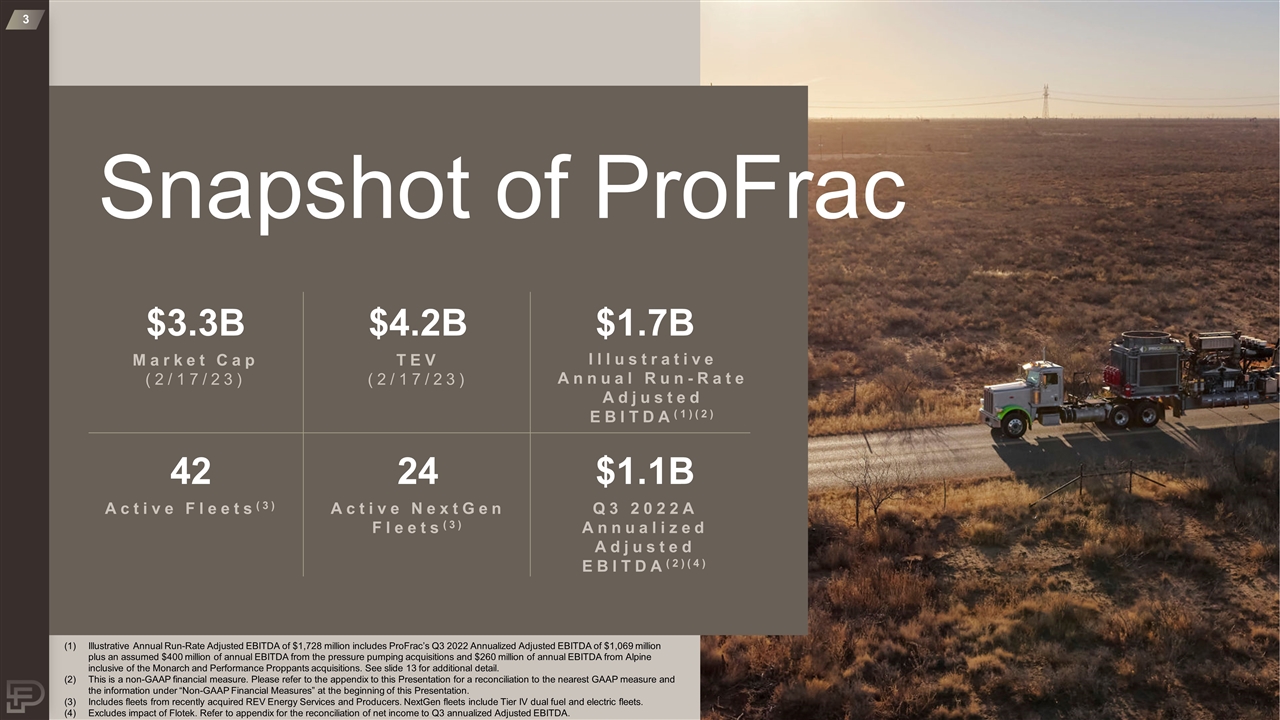
Snapshot of ProFrac $3.3B Market Cap (2/17/23) $4.2B TEV (2/17/23) $1.7B Illustrative Annual Run-Rate Adjusted EBITDA(1)(2) 24 Active NextGen Fleets(3) $1.1B Q3 2022A Annualized Adjusted EBITDA(2)(4) 42 Active Fleets(3) Illustrative Annual Run-Rate Adjusted EBITDA of $1,728 million includes ProFrac’s Q3 2022 Annualized Adjusted EBITDA of $1,069 million plus an assumed $400 million of annual EBITDA from the pressure pumping acquisitions and $260 million of annual EBITDA from Alpine inclusive of the Monarch and Performance Proppants acquisitions. See slide 13 for additional detail. This is a non-GAAP financial measure. Please refer to the appendix to this Presentation for a reconciliation to the nearest GAAP measure and the information under “Non-GAAP Financial Measures” at the beginning of this Presentation. Includes fleets from recently acquired REV Energy Services and Producers. NextGen fleets include Tier IV dual fuel and electric fleets. Excludes impact of Flotek. Refer to appendix for the reconciliation of net income to Q3 annualized Adjusted EBITDA.
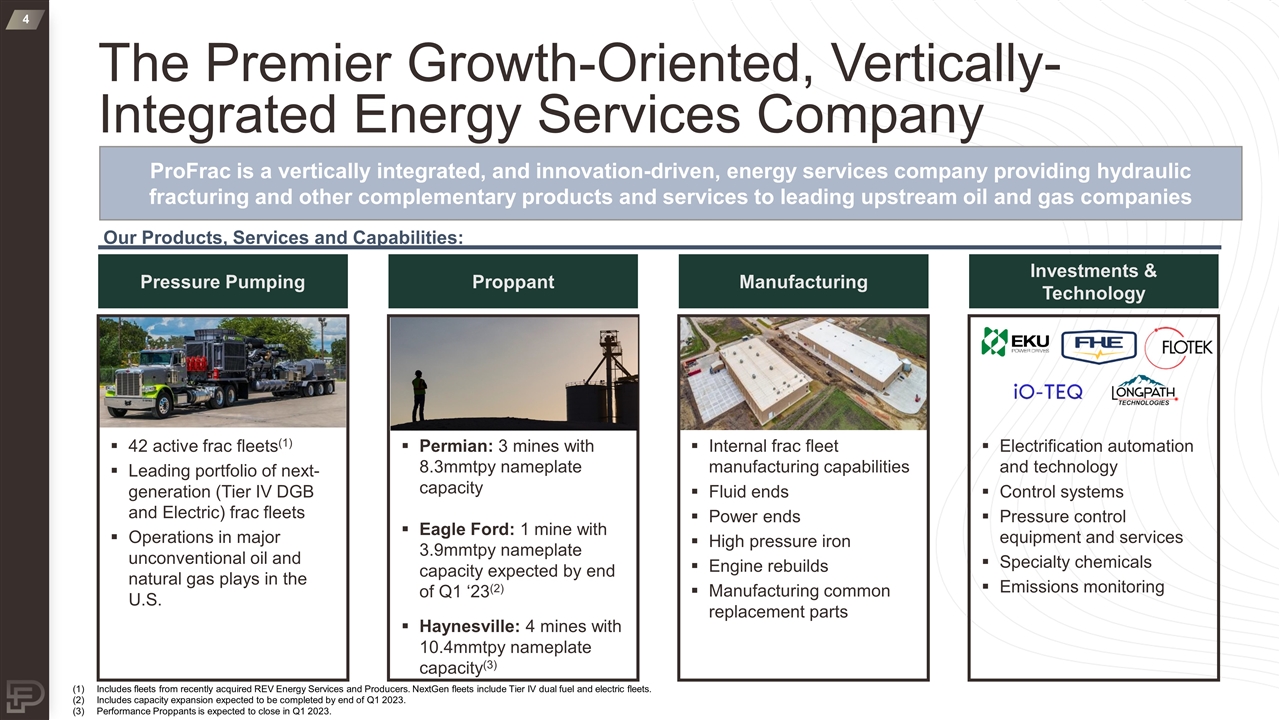
The Premier Growth-Oriented, Vertically-Integrated Energy Services Company Our Products, Services and Capabilities: Pressure Pumping Proppant Manufacturing Investments & Technology 42 active frac fleets(1) Leading portfolio of next-generation (Tier IV DGB and Electric) frac fleets Operations in major unconventional oil and natural gas plays in the U.S. Permian: 3 mines with 8.3mmtpy nameplate capacity Eagle Ford: 1 mine with 3.9mmtpy nameplate capacity expected by end of Q1 ‘23(2) Haynesville: 4 mines with 10.4mmtpy nameplate capacity(3) Internal frac fleet manufacturing capabilities Fluid ends Power ends High pressure iron Engine rebuilds Manufacturing common replacement parts Electrification automation and technology Control systems Pressure control equipment and services Specialty chemicals Emissions monitoring Includes fleets from recently acquired REV Energy Services and Producers. NextGen fleets include Tier IV dual fuel and electric fleets. Includes capacity expansion expected to be completed by end of Q1 2023. Performance Proppants is expected to close in Q1 2023. ProFrac is a vertically integrated, and innovation-driven, energy services company providing hydraulic fracturing and other complementary products and services to leading upstream oil and gas companies
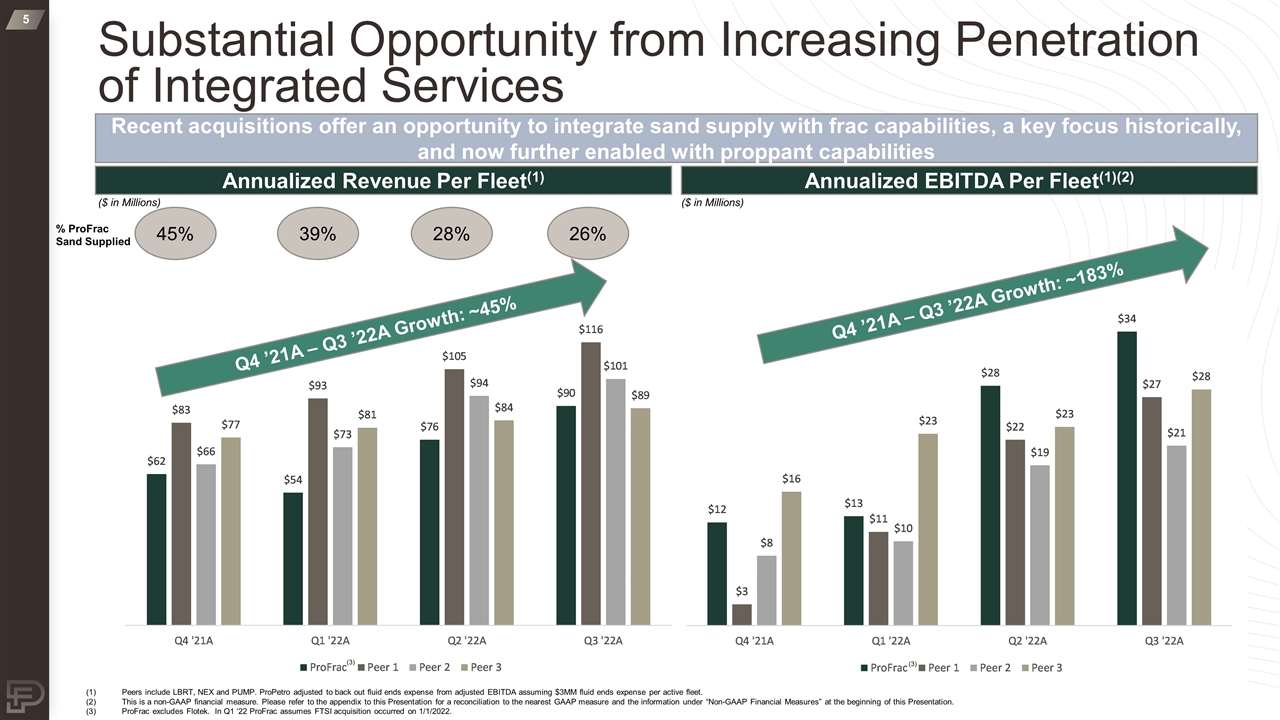
Substantial Opportunity from Increasing Penetration of Integrated Services Peers include LBRT, NEX and PUMP. ProPetro adjusted to back out fluid ends expense from adjusted EBITDA assuming $3MM fluid ends expense per active fleet. This is a non-GAAP financial measure. Please refer to the appendix to this Presentation for a reconciliation to the nearest GAAP measure and the information under “Non-GAAP Financial Measures” at the beginning of this Presentation. ProFrac excludes Flotek. In Q1 ‘22 ProFrac assumes FTSI acquisition occurred on 1/1/2022. ($ in Millions) Annualized Revenue Per Fleet(1) Annualized EBITDA Per Fleet(1)(2) ($ in Millions) % ProFrac Sand Supplied 45% 39% 28% 26% (3) (3) Q4 ’21A – Q3 ’22A Growth: ~45% Q4 ’21A – Q3 ’22A Growth: ~183% Recent acquisitions offer an opportunity to integrate sand supply with frac capabilities, a key focus historically, and now further enabled with proppant capabilities
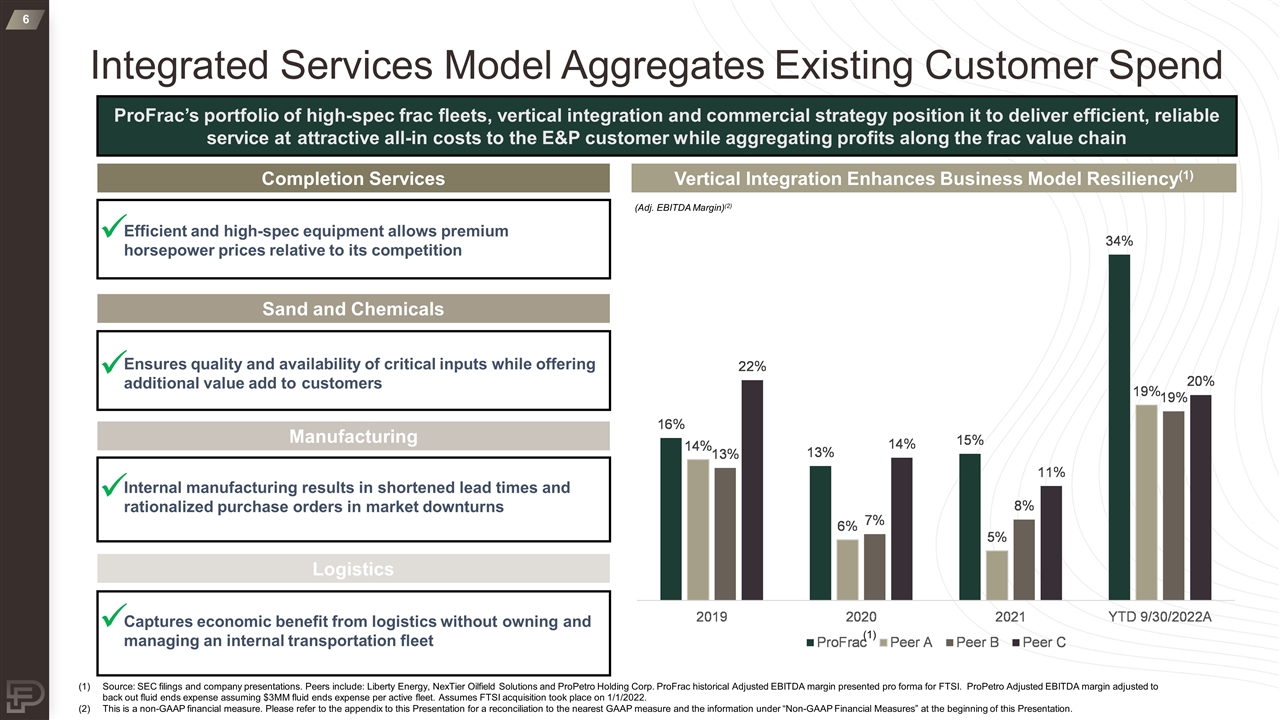
Integrated Services Model Aggregates Existing Customer Spend Completion Services Sand and Chemicals Logistics Efficient and high-spec equipment allows premium horsepower prices relative to its competition Ensures quality and availability of critical inputs while offering additional value add to customers Captures economic benefit from logistics without owning and managing an internal transportation fleet ü ü ü Manufacturing Internal manufacturing results in shortened lead times and rationalized purchase orders in market downturns ü (Adj. EBITDA Margin)(2) Vertical Integration Enhances Business Model Resiliency(1) ProFrac’s portfolio of high-spec frac fleets, vertical integration and commercial strategy position it to deliver efficient, reliable service at attractive all-in costs to the E&P customer while aggregating profits along the frac value chain Source: SEC filings and company presentations. Peers include: Liberty Energy, NexTier Oilfield Solutions and ProPetro Holding Corp. ProFrac historical Adjusted EBITDA margin presented pro forma for FTSI. ProPetro Adjusted EBITDA margin adjusted to back out fluid ends expense assuming $3MM fluid ends expense per active fleet. Assumes FTSI acquisition took place on 1/1/2022. This is a non-GAAP financial measure. Please refer to the appendix to this Presentation for a reconciliation to the nearest GAAP measure and the information under “Non-GAAP Financial Measures” at the beginning of this Presentation. (1)
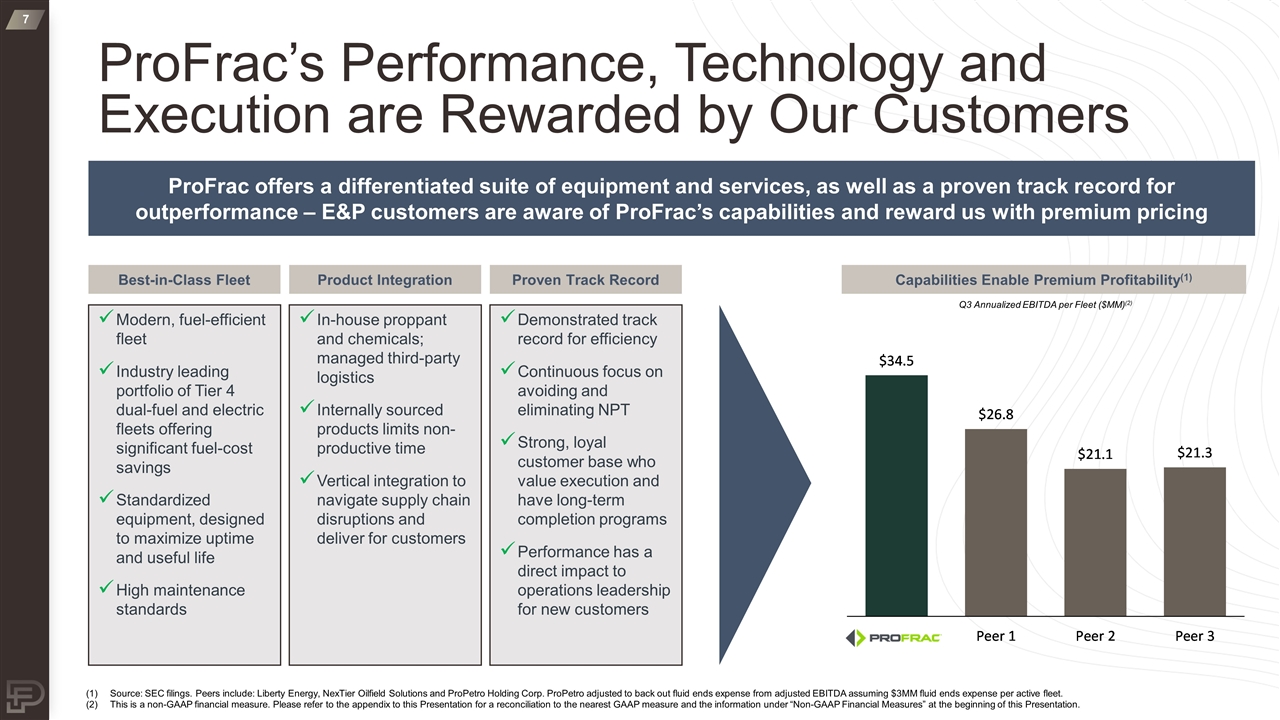
ProFrac’s Performance, Technology and Execution are Rewarded by Our Customers Best-in-Class Fleet Product Integration Proven Track Record Modern, fuel-efficient fleet Industry leading portfolio of Tier 4 dual-fuel and electric fleets offering significant fuel-cost savings Standardized equipment, designed to maximize uptime and useful life High maintenance standards In-house proppant and chemicals; managed third-party logistics Internally sourced products limits non-productive time Vertical integration to navigate supply chain disruptions and deliver for customers Demonstrated track record for efficiency Continuous focus on avoiding and eliminating NPT Strong, loyal customer base who value execution and have long-term completion programs Performance has a direct impact to operations leadership for new customers Capabilities Enable Premium Profitability(1) ProFrac offers a differentiated suite of equipment and services, as well as a proven track record for outperformance – E&P customers are aware of ProFrac’s capabilities and reward us with premium pricing Source: SEC filings. Peers include: Liberty Energy, NexTier Oilfield Solutions and ProPetro Holding Corp. ProPetro adjusted to back out fluid ends expense from adjusted EBITDA assuming $3MM fluid ends expense per active fleet. This is a non-GAAP financial measure. Please refer to the appendix to this Presentation for a reconciliation to the nearest GAAP measure and the information under “Non-GAAP Financial Measures” at the beginning of this Presentation. Q3 Annualized EBITDA per Fleet ($MM)(2)
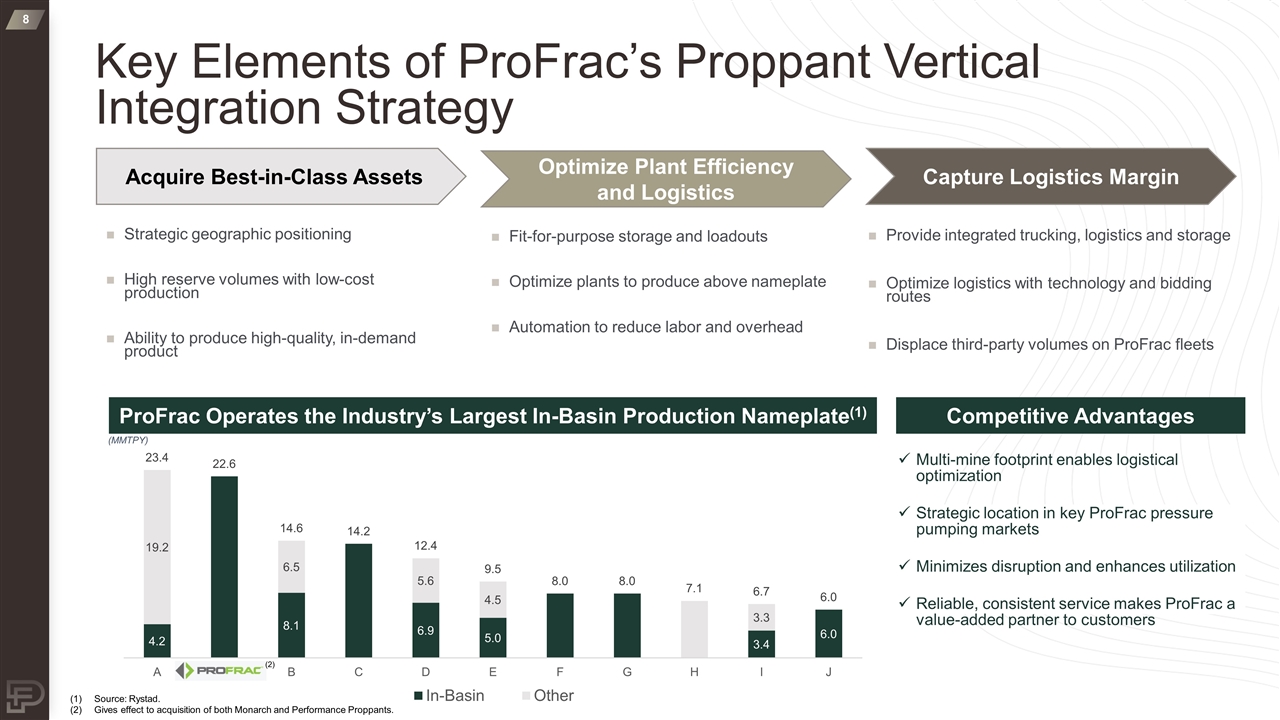
Key Elements of ProFrac’s Proppant Vertical Integration Strategy Acquire Best-in-Class Assets Optimize Plant Efficiency and Logistics Capture Logistics Margin Strategic geographic positioning High reserve volumes with low-cost production Ability to produce high-quality, in-demand product Fit-for-purpose storage and loadouts Optimize plants to produce above nameplate Automation to reduce labor and overhead Provide integrated trucking, logistics and storage Optimize logistics with technology and bidding routes Displace third-party volumes on ProFrac fleets ProFrac Operates the Industry’s Largest In-Basin Production Nameplate(1) Multi-mine footprint enables logistical optimization Strategic location in key ProFrac pressure pumping markets Minimizes disruption and enhances utilization Reliable, consistent service makes ProFrac a value-added partner to customers Competitive Advantages (MMTPY) Source: Rystad. Gives effect to acquisition of both Monarch and Performance Proppants. (2)
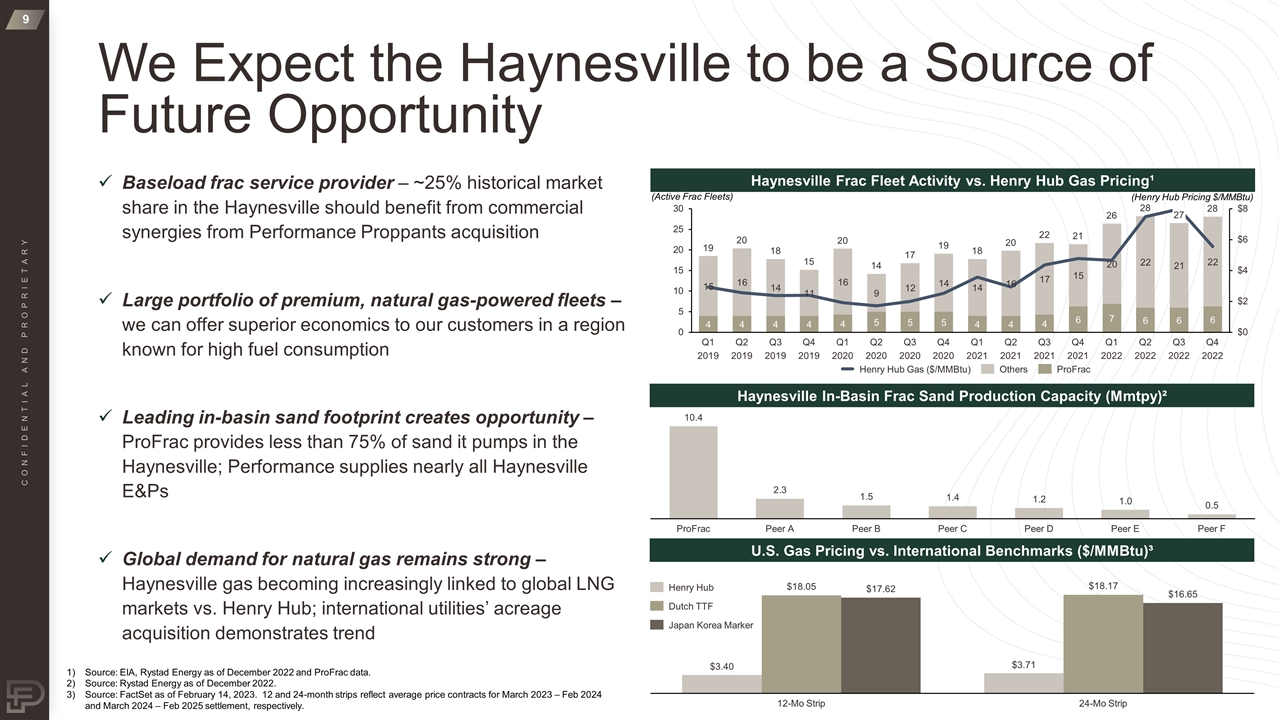
We Expect the Haynesville to be a Source of Future Opportunity CONFIDENTIAL AND PROPRIETARY Baseload frac service provider – ~25% historical market share in the Haynesville should benefit from commercial synergies from Performance Proppants acquisition Large portfolio of premium, natural gas-powered fleets – we can offer superior economics to our customers in a region known for high fuel consumption Leading in-basin sand footprint creates opportunity – ProFrac provides less than 75% of sand it pumps in the Haynesville; Performance supplies nearly all Haynesville E&Ps Global demand for natural gas remains strong – Haynesville gas becoming increasingly linked to global LNG markets vs. Henry Hub; international utilities’ acreage acquisition demonstrates trend Haynesville Frac Fleet Activity vs. Henry Hub Gas Pricing¹ (Active Frac Fleets) (Henry Hub Pricing $/MMBtu) Haynesville In-Basin Frac Sand Production Capacity (Mmtpy)² U.S. Gas Pricing vs. International Benchmarks ($/MMBtu)³ Source: EIA, Rystad Energy as of December 2022 and ProFrac data. Source: Rystad Energy as of December 2022. Source: FactSet as of February 14, 2023. 12 and 24-month strips reflect average price contracts for March 2023 – Feb 2024 and March 2024 – Feb 2025 settlement, respectively.
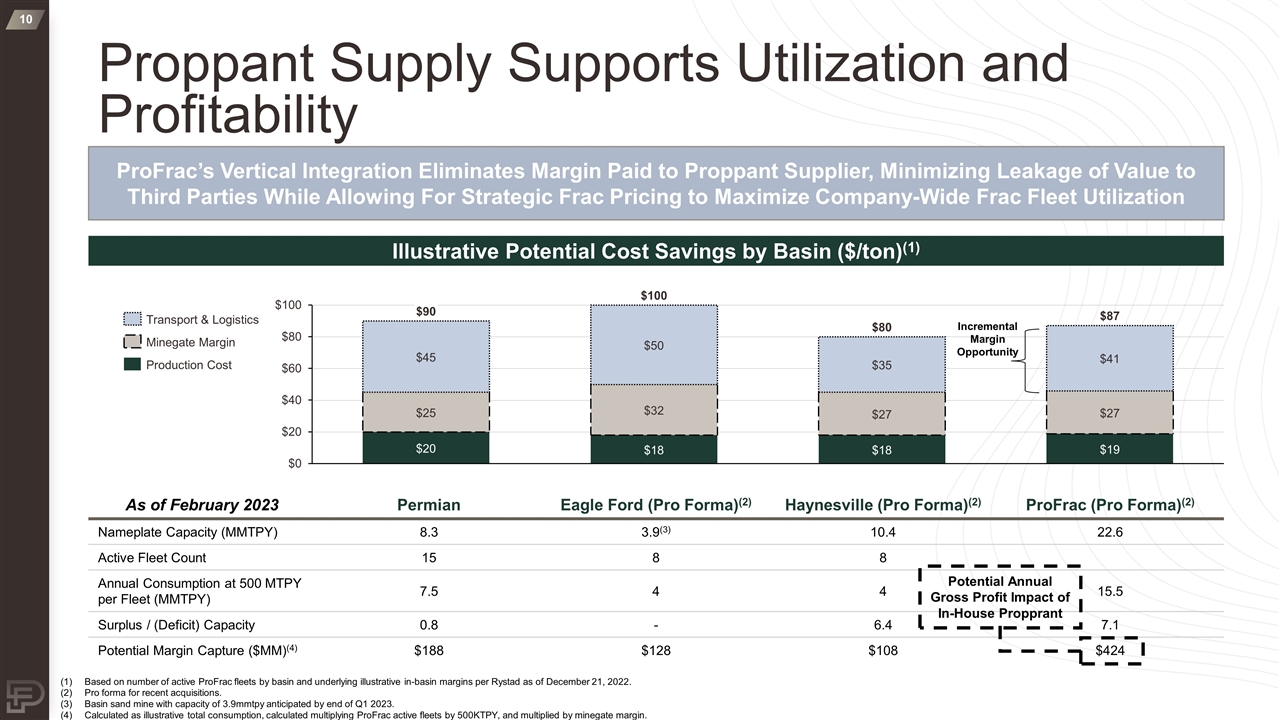
Proppant Supply Supports Utilization and Profitability Illustrative Potential Cost Savings by Basin ($/ton)(1) As of February 2023 Permian Eagle Ford (Pro Forma)(2) Haynesville (Pro Forma)(2) ProFrac (Pro Forma)(2) Nameplate Capacity (MMTPY) 8.3 3.9(3) 10.4 22.6 Active Fleet Count 15 8 8 Annual Consumption at 500 MTPY per Fleet (MMTPY) 7.5 4 4 15.5 Surplus / (Deficit) Capacity 0.8 - 6.4 7.1 Potential Margin Capture ($MM)(4) $188 $128 $108 $424 Incremental Margin Opportunity Based on number of active ProFrac fleets by basin and underlying illustrative in-basin margins per Rystad as of December 21, 2022. Pro forma for recent acquisitions. Basin sand mine with capacity of 3.9mmtpy anticipated by end of Q1 2023. Calculated as illustrative total consumption, calculated multiplying ProFrac active fleets by 500KTPY, and multiplied by minegate margin. Potential Annual Gross Profit Impact of In-House Propprant ProFrac’s Vertical Integration Eliminates Margin Paid to Proppant Supplier, Minimizing Leakage of Value to Third Parties While Allowing For Strategic Frac Pricing to Maximize Company-Wide Frac Fleet Utilization
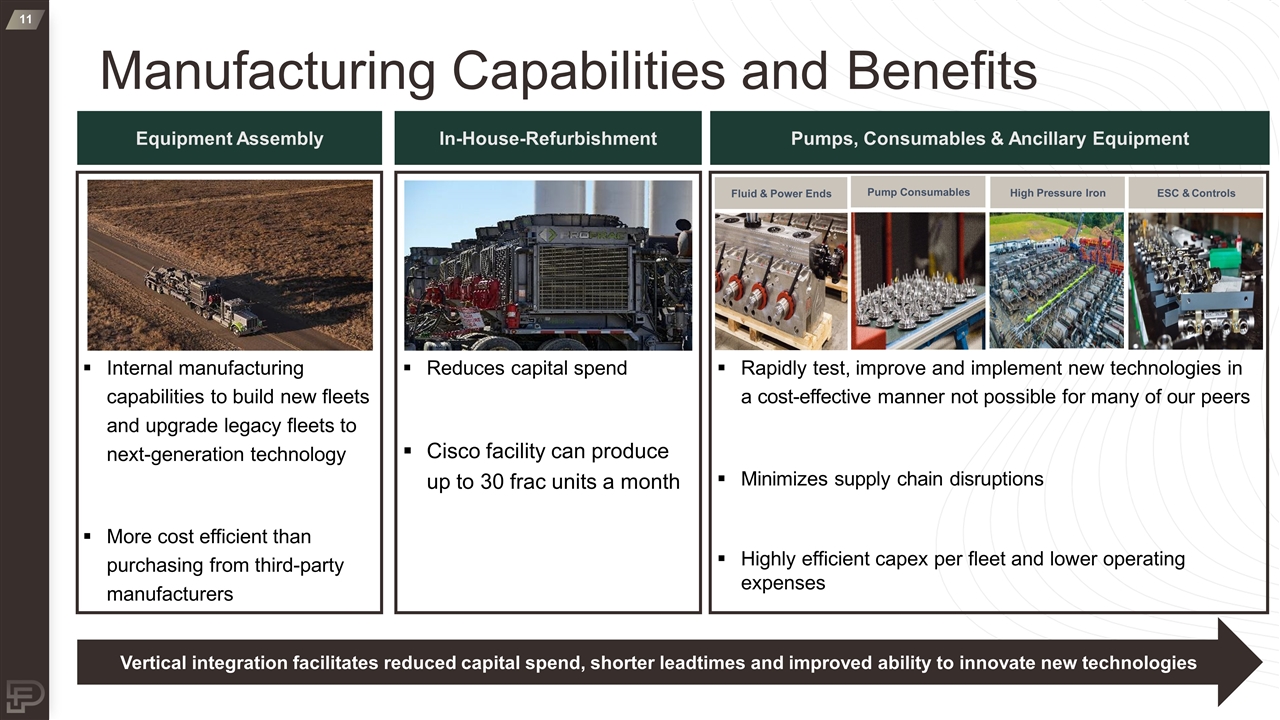
Manufacturing Capabilities and Benefits Equipment Assembly Internal manufacturing capabilities to build new fleets and upgrade legacy fleets to next-generation technology More cost efficient than purchasing from third-party manufacturers In-House-Refurbishment Reduces capital spend Cisco facility can produce up to 30 frac units a month Pumps, Consumables & Ancillary Equipment Rapidly test, improve and implement new technologies in a cost-effective manner not possible for many of our peers Minimizes supply chain disruptions Highly efficient capex per fleet and lower operating expenses Fluid & Power Ends Pump Consumables High Pressure Iron ESC & Controls Vertical integration facilitates reduced capital spend, shorter leadtimes and improved ability to innovate new technologies

ProFrac is Purpose Built to Withstand Cyclicality Excess Marketed Supply Historical & Projected U.S. Frac Marketed Supply and Demand(1) (MM HHP) (% Fleet Utilization) (1) Source: Rystad Energy as of December 2022. Metrics are reflective of total U.S. market. Total marketed supply equal to active and warm-stacked horsepower. Fleet utilization is defined as market demand as a percentage of marketed supply. (2) Source: Enverus. Estimate of horsepower, sand and chemicals cost relative to total cost for a 10,000’ hz, 3 string Permian well. ProFrac is Enhancing Business Model Resiliency Positioning Fleet at Low Point of the Cost Curve Expanded Tier 4 dual fuel fleet through upgrades and acquired electric fleets through USWS acquisition Leading portfolio of fuel-efficient fleets expected to remain active in a downturn Vertically Integrating Key Products and Services Sand acquisitions and FloTek relationship provide internal proppant and chemical supply capabilities Enables ProFrac to both maximize wallet share, but also position itself as mission critical supplier to customers (~26% of total well cost(2)) Building Scale and Expanding Operating Footprint Combination of organic and inorganic growth has expanded ProFrac into nearly all major unconventional play, resulting in diversified basin, customer and commodity exposure ProFrac is well insulated from basin / commodity idiosyncratic risk Mitigating Supply Chain Risk Internal manufacturing and refurbishment reduces order lead times for inventory and improves capital efficiency Enables ProFrac to order goods when and as needed, rather than as dictated by suppliers with power to substantially disrupt operations 1 2 3 4 CONFIDENTIAL AND PROPRIETARY
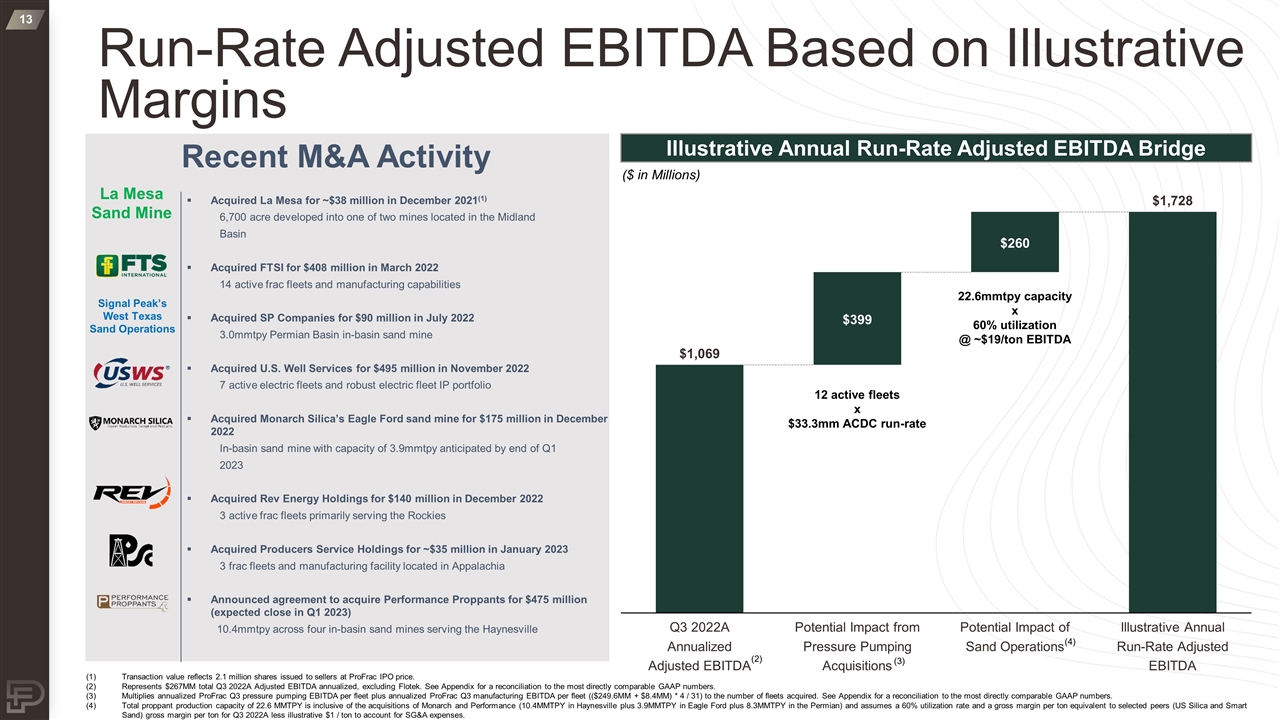
Run-Rate Adjusted EBITDA Based on Illustrative Margins Acquired La Mesa for ~$38 million in December 2021(1) 6,700 acre developed into one of two mines located in the Midland Basin Acquired FTSI for $408 million in March 2022 14 active frac fleets and manufacturing capabilities Acquired SP Companies for $90 million in July 2022 3.0mmtpy Permian Basin in-basin sand mine Acquired U.S. Well Services for $495 million in November 2022 7 active electric fleets and robust electric fleet IP portfolio Acquired Monarch Silica’s Eagle Ford sand mine for $175 million in December 2022 In-basin sand mine with capacity of 3.9mmtpy anticipated by end of Q1 2023 Acquired Rev Energy Holdings for $140 million in December 2022 3 active frac fleets primarily serving the Rockies Acquired Producers Service Holdings for ~$35 million in January 2023 3 frac fleets and manufacturing facility located in Appalachia Announced agreement to acquire Performance Proppants for $475 million (expected close in Q1 2023) 10.4mmtpy across four in-basin sand mines serving the Haynesville Recent M&A Activity La Mesa Sand Mine Transaction value reflects 2.1 million shares issued to sellers at ProFrac IPO price. Represents $267MM total Q3 2022A Adjusted EBITDA annualized, excluding Flotek. See Appendix for a reconciliation to the most directly comparable GAAP numbers. Multiplies annualized ProFrac Q3 pressure pumping EBITDA per fleet plus annualized ProFrac Q3 manufacturing EBITDA per fleet (($249.6MM + $8.4MM) * 4 / 31) to the number of fleets acquired. See Appendix for a reconciliation to the most directly comparable GAAP numbers. Total proppant production capacity of 22.6 MMTPY is inclusive of the acquisitions of Monarch and Performance (10.4MMTPY in Haynesville plus 3.9MMTPY in Eagle Ford plus 8.3MMTPY in the Permian) and assumes a 60% utilization rate and a gross margin per ton equivalent to selected peers (US Silica and Smart Sand) gross margin per ton for Q3 2022A less illustrative $1 / ton to account for SG&A expenses. Illustrative Annual Run-Rate Adjusted EBITDA Bridge ($ in Millions) Illustrative Annual Run-Rate Adjusted EBITDA Q3 2022A Annualized Adjusted EBITDA (2) (3) (4) 12 active fleets x $33.3mm ACDC run-rate 22.6mmtpy capacity x 60% utilization @ ~$19/ton EBITDA Signal Peak’s West Texas Sand Operations
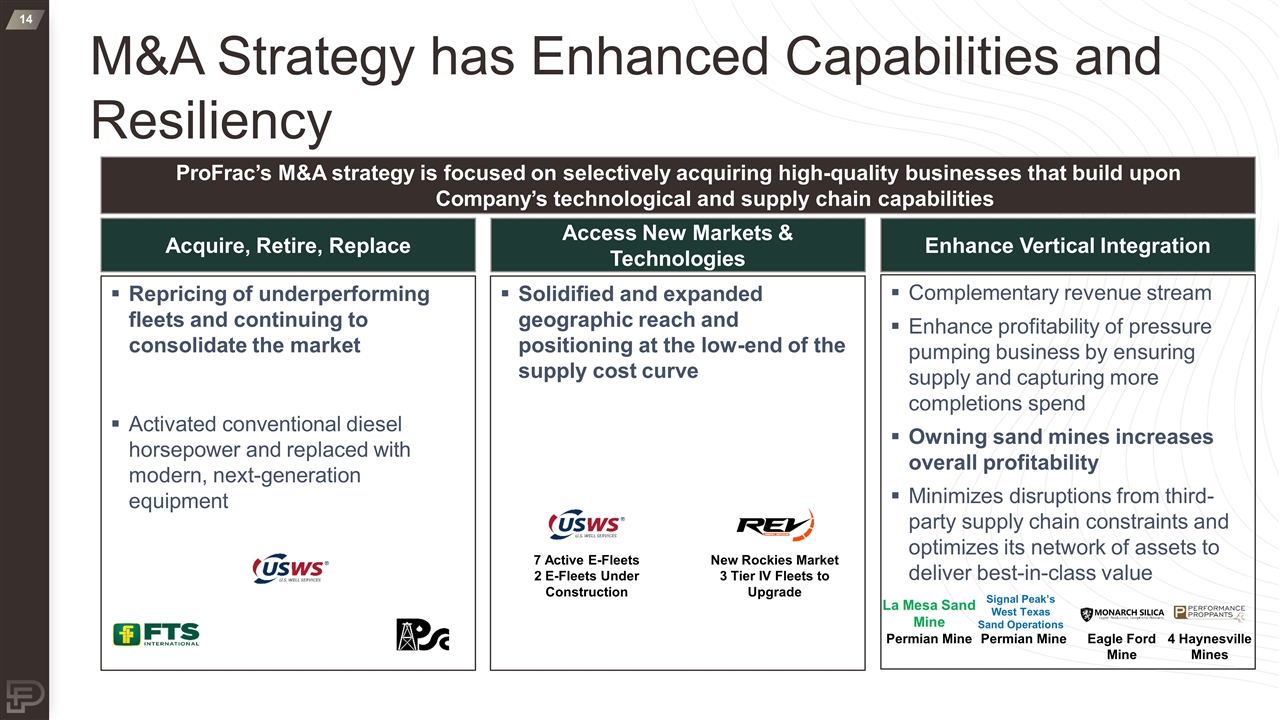
Repricing of underperforming fleets and continuing to consolidate the market Activated conventional diesel horsepower and replaced with modern, next-generation equipment Solidified and expanded geographic reach and positioning at the low-end of the supply cost curve Complementary revenue stream Enhance profitability of pressure pumping business by ensuring supply and capturing more completions spend Owning sand mines increases overall profitability Minimizes disruptions from third-party supply chain constraints and optimizes its network of assets to deliver best-in-class value M&A Strategy has Enhanced Capabilities and Resiliency Acquire, Retire, Replace Access New Markets & Technologies Enhance Vertical Integration ProFrac’s M&A strategy is focused on selectively acquiring high-quality businesses that build upon Company’s technological and supply chain capabilities La Mesa Sand Mine 7 Active E-Fleets 2 E-Fleets Under Construction New Rockies Market 3 Tier IV Fleets to Upgrade 4 Haynesville Mines Permian Mine Eagle Ford Mine Permian Mine Signal Peak’s West Texas Sand Operations
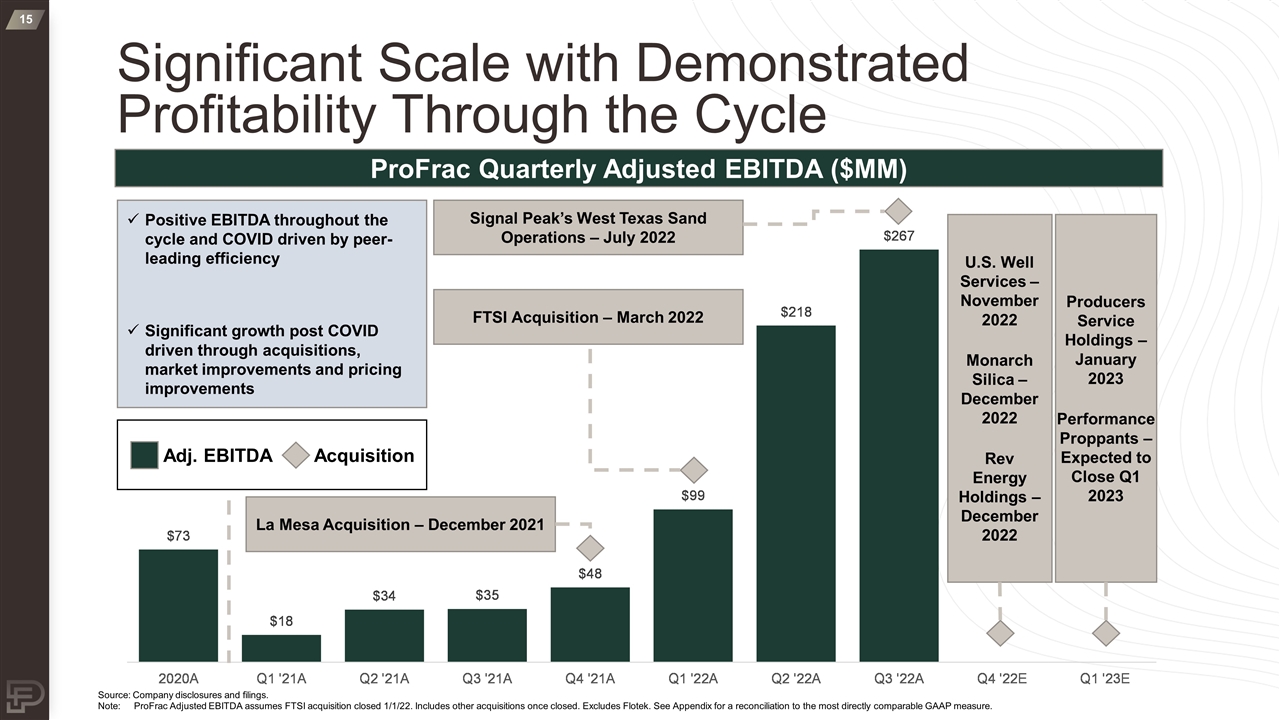
Significant Scale with Demonstrated Profitability Through the Cycle Positive EBITDA throughout the cycle and COVID driven by peer-leading efficiency Significant growth post COVID driven through acquisitions, market improvements and pricing improvements ProFrac Quarterly Adjusted EBITDA ($MM) Source: Company disclosures and filings. Note: ProFrac Adjusted EBITDA assumes FTSI acquisition closed 1/1/22. Includes other acquisitions once closed. Excludes Flotek. See Appendix for a reconciliation to the most directly comparable GAAP measure. FTSI Acquisition – March 2022 La Mesa Acquisition – December 2021 Signal Peak’s West Texas Sand Operations – July 2022 Producers Service Holdings – January 2023 Performance Proppants – Expected to Close Q1 2023 U.S. Well Services – November 2022 Monarch Silica – December 2022 Rev Energy Holdings – December 2022 Adj. EBITDA Acquisition
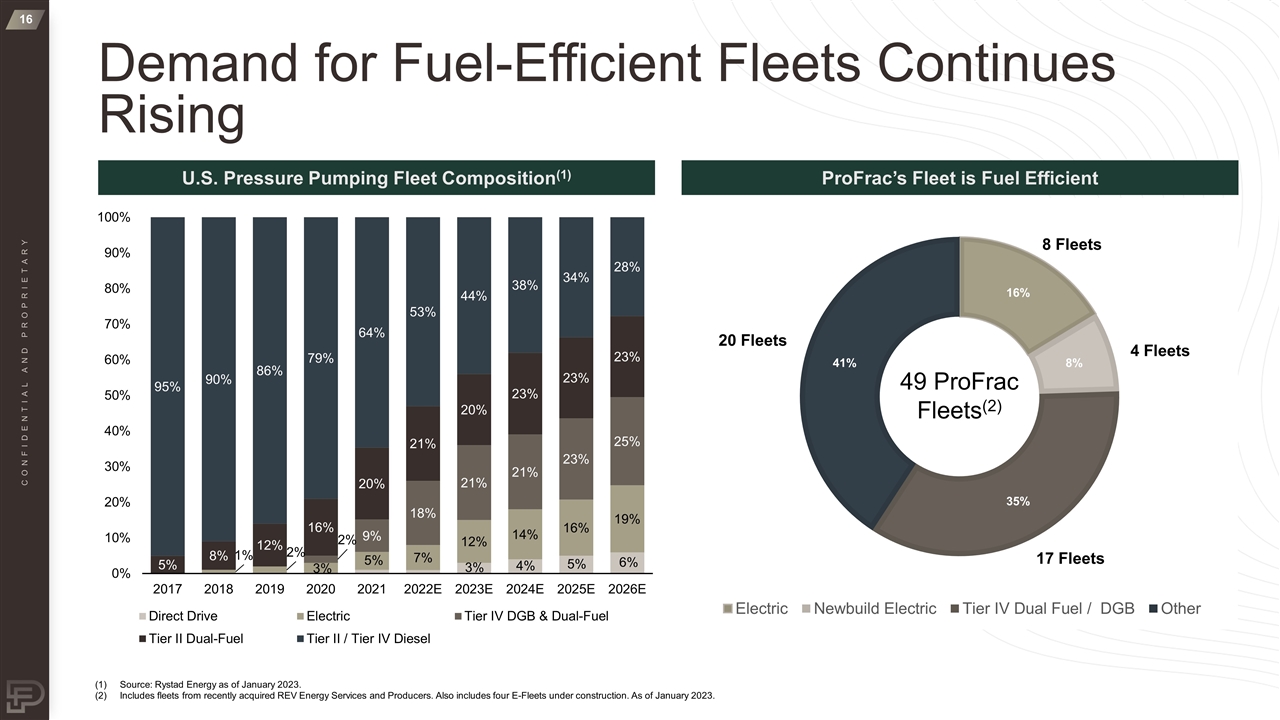
Demand for Fuel-Efficient Fleets Continues Rising U.S. Pressure Pumping Fleet Composition(1) ProFrac’s Fleet is Fuel Efficient (1) Source: Rystad Energy as of January 2023. (2) Includes fleets from recently acquired REV Energy Services and Producers. Also includes four E-Fleets under construction. As of January 2023. 49 ProFrac Fleets(2) 8 Fleets 4 Fleets 17 Fleets 20 Fleets CONFIDENTIAL AND PROPRIETARY
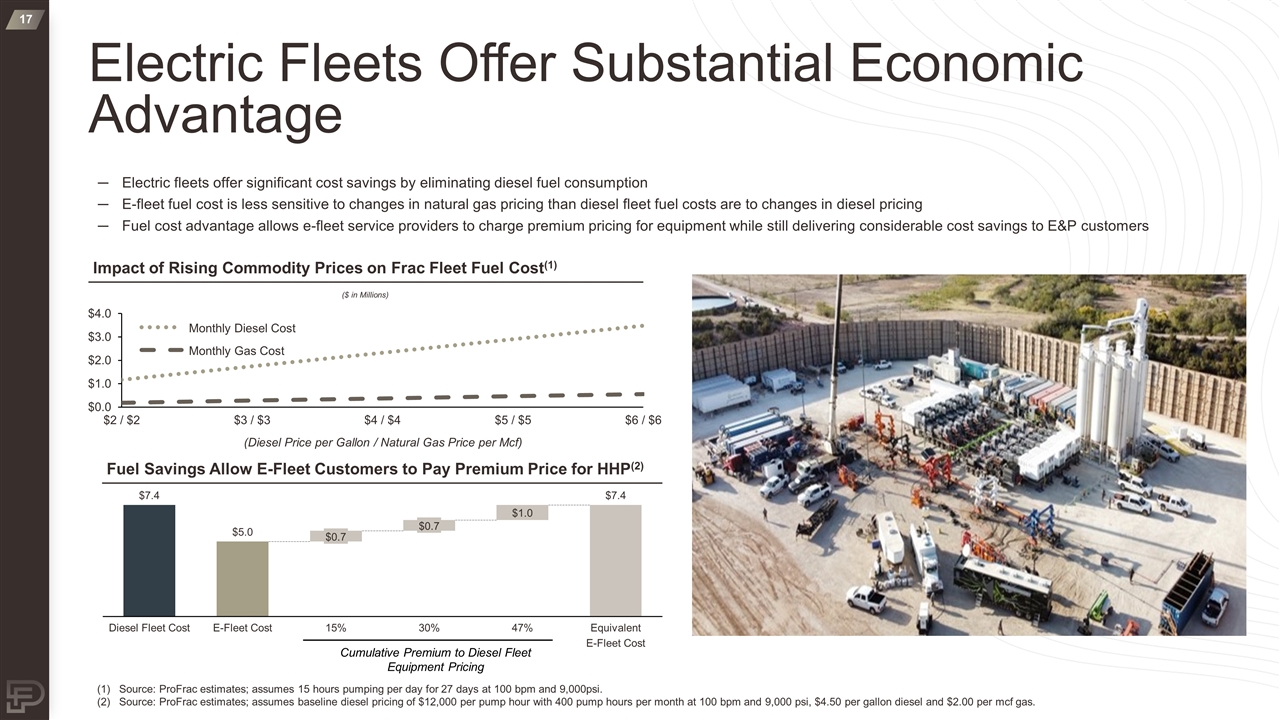
(1) Source: ProFrac estimates; assumes 15 hours pumping per day for 27 days at 100 bpm and 9,000psi. (2) Source: ProFrac estimates; assumes baseline diesel pricing of $12,000 per pump hour with 400 pump hours per month at 100 bpm and 9,000 psi, $4.50 per gallon diesel and $2.00 per mcf gas. Electric Fleets Offer Substantial Economic Advantage Electric fleets offer significant cost savings by eliminating diesel fuel consumption E-fleet fuel cost is less sensitive to changes in natural gas pricing than diesel fleet fuel costs are to changes in diesel pricing Fuel cost advantage allows e-fleet service providers to charge premium pricing for equipment while still delivering considerable cost savings to E&P customers Impact of Rising Commodity Prices on Frac Fleet Fuel Cost(1) Fuel Savings Allow E-Fleet Customers to Pay Premium Price for HHP(2) $3 / $3 $2 / $2 $4 / $4 $5 / $5 $6 / $6 Monthly Monthly ($ in Millions) (Diesel Price per Gallon / Natural Gas Price per Mcf) Cumulative Premium to Diesel Fleet Equipment Pricing
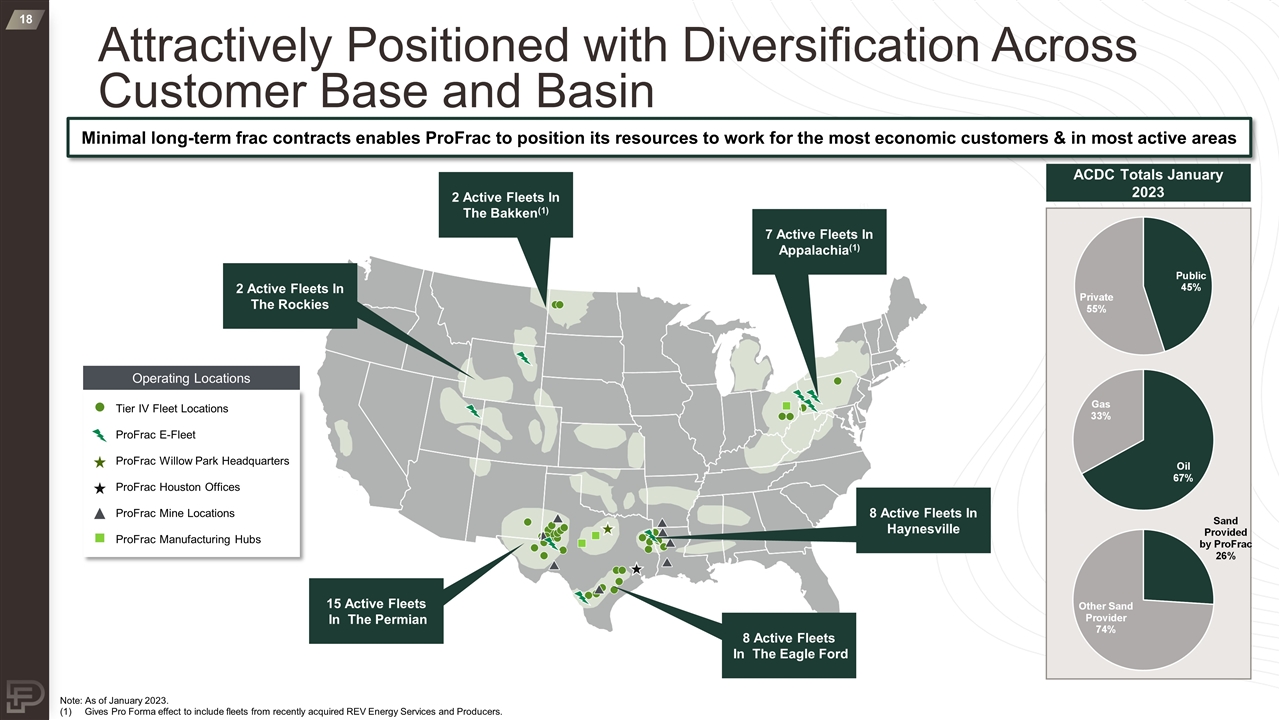
Attractively Positioned with Diversification Across Customer Base and Basin Minimal long-term frac contracts enables ProFrac to position its resources to work for the most economic customers & in most active areas Add pie charts from other page here. Revise text on left. ACDC Totals January 2023 (1) (1) Note: As of January 2023. (1) Gives Pro Forma effect to include fleets from recently acquired REV Energy Services and Producers. 2 Active Fleets In The Rockies 2 Active Fleets In The Bakken(1) 7 Active Fleets In Appalachia(1) 8 Active Fleets In Haynesville 8 Active Fleets In The Eagle Ford 15 Active Fleets In The Permian Operating Locations Tier IV Fleet Locations ProFrac E-Fleet ProFrac Willow Park Headquarters ProFrac Houston Offices ProFrac Mine Locations ProFrac Manufacturing Hubs
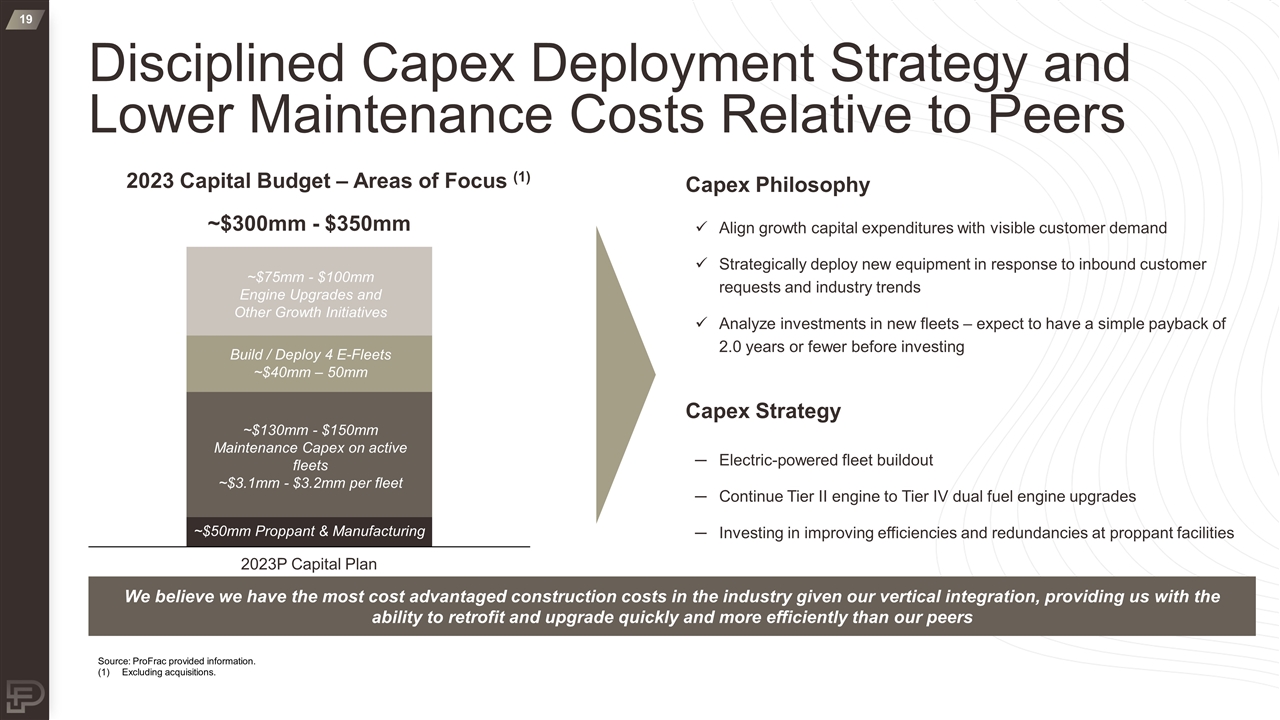
Disciplined Capex Deployment Strategy and Lower Maintenance Costs Relative to Peers Source: ProFrac provided information. (1)Excluding acquisitions. We believe we have the most cost advantaged construction costs in the industry given our vertical integration, providing us with the ability to retrofit and upgrade quickly and more efficiently than our peers 2023 Capital Budget – Areas of Focus (1) Capex Philosophy ~$300mm - $350mm Capex Strategy Align growth capital expenditures with visible customer demand Strategically deploy new equipment in response to inbound customer requests and industry trends Analyze investments in new fleets – expect to have a simple payback of 2.0 years or fewer before investing Electric-powered fleet buildout Continue Tier II engine to Tier IV dual fuel engine upgrades Investing in improving efficiencies and redundancies at proppant facilities ~$75mm - $100mm Engine Upgrades and Other Growth Initiatives Build / Deploy 4 E-Fleets ~$40mm – 50mm ~$130mm - $150mm Maintenance Capex on active fleets ~$3.1mm - $3.2mm per fleet ~$50mm Proppant & Manufacturing
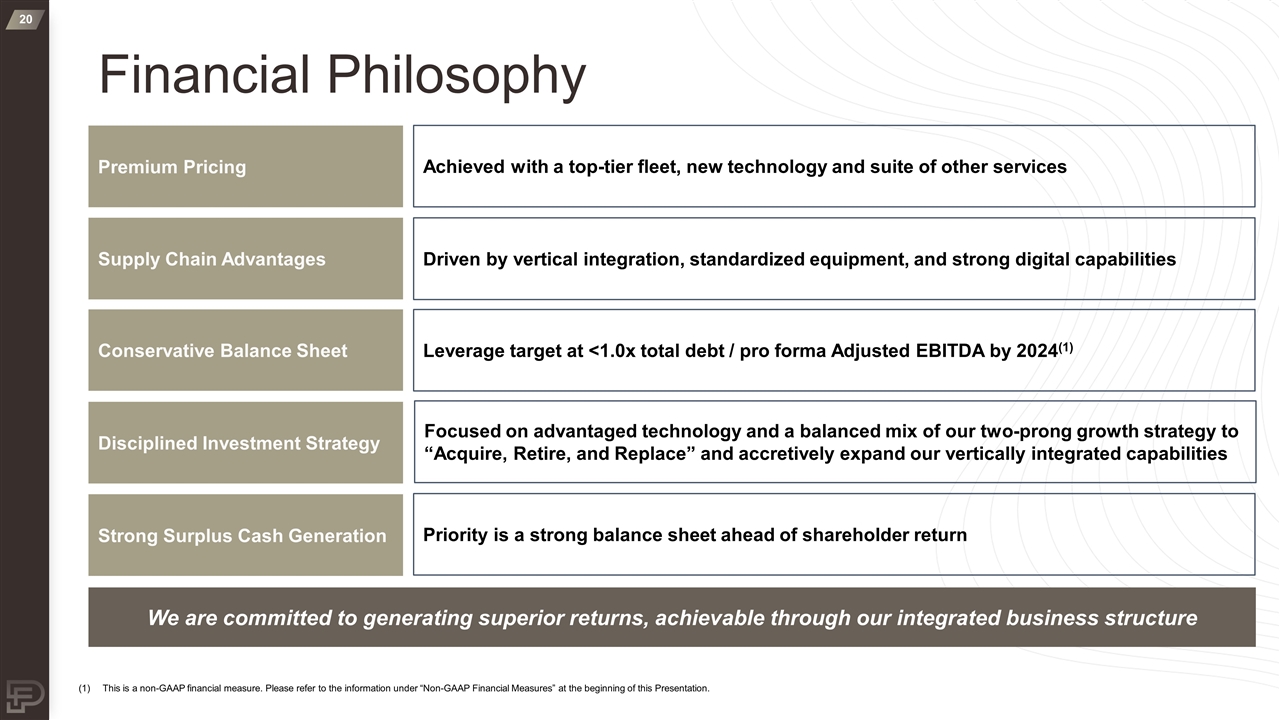
We are committed to generating superior returns, achievable through our integrated business structure Leverage target at <1.0x total debt / pro forma Adjusted EBITDA by 2024(1) Conservative Balance Sheet Driven by vertical integration, standardized equipment, and strong digital capabilities Supply Chain Advantages Premium Pricing Achieved with a top-tier fleet, new technology and suite of other services Focused on advantaged technology and a balanced mix of our two-prong growth strategy to “Acquire, Retire, and Replace” and accretively expand our vertically integrated capabilities Disciplined Investment Strategy Priority is a strong balance sheet ahead of shareholder return Strong Surplus Cash Generation Financial Philosophy This is a non-GAAP financial measure. Please refer to the information under “Non-GAAP Financial Measures” at the beginning of this Presentation.

ProFrac is Demonstrating ESG Leadership Selected Recent Market Commentary Say 50% of BoD is diverse on 3rd right bullet 100 g/kWh CO2e 1 g/kWh NO2 1 g/kWh PM10 Significant shareholder alignment – the Wilks family owns ~83% of ProFrac Independent Directors with significant industry and management experience 50% of Directors are diverse, including two women, and a person of Native American heritage Hires locally – invests in communities and provides a stable source of high-paying, rewarding jobs Social & Governance(1) Advanced portfolio of next-gen fleets offers substantial emissions reductions(2) Environmental initiatives unlock tangible economic benefit Source: ProFrac CleanFleet Spec Sheet as of January 2023. As of February 16, 2023. As of January 2023. Significant and quantifiable fuel cost savings Reduce maintenance downtime, increasing productivity and utilization Millions of dollars of annual cost savings Substitute natural gas for diesel and reduce truck traffic Data and digital platforms enable accurate tracking of fuel cost savings and carbon footprint reduction Engine Standby Controllers reduce idle time, limiting fuel consumption and the time when emissions are highest
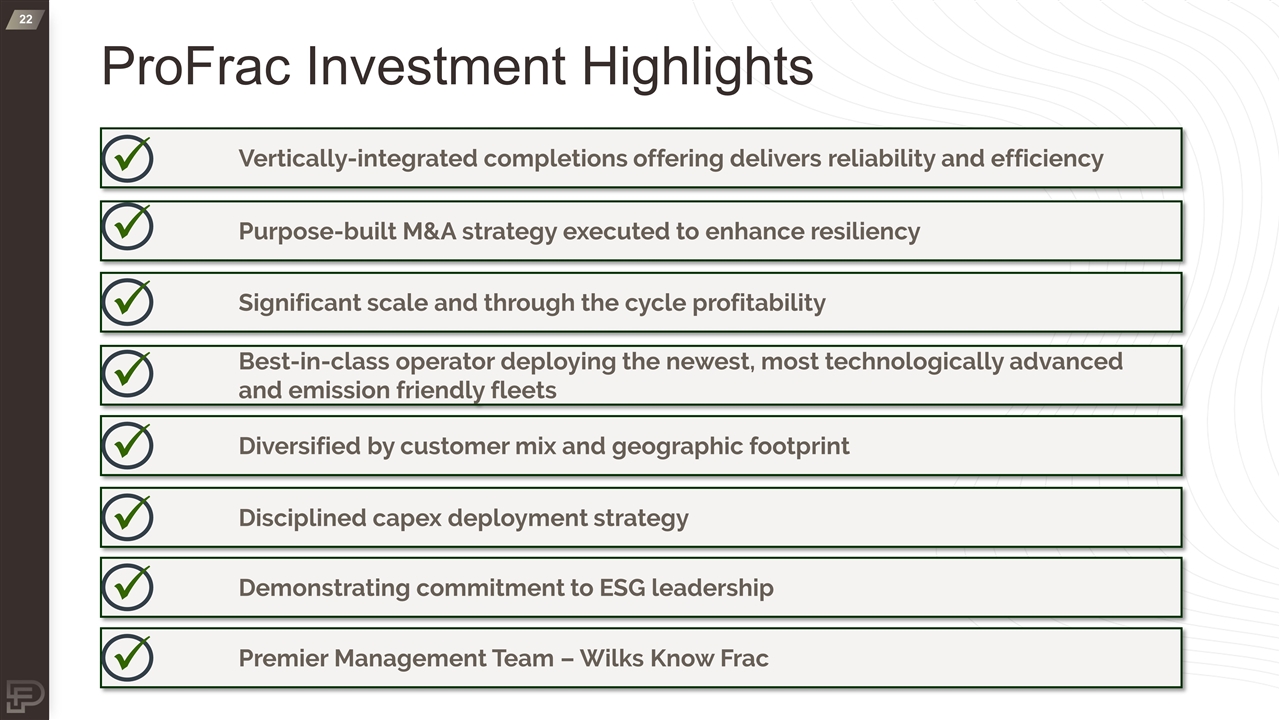
ProFrac Investment Highlights Add something about Lowest All in Cost for the Customer – put that into #5 Diversification across customers (blue chip and high growth) for #5 Lex: Need to make these 5 – 7 words on one line Lex says maybe no boxes if it looks beter Significant scale and through the cycle profitability Purpose-built M&A strategy executed to enhance resiliency Disciplined capex deployment strategy Premier Management Team – Wilks Know Frac Vertically-integrated completions offering delivers reliability and efficiency Best-in-class operator deploying the newest, most technologically advanced and emission friendly fleets Diversified by customer mix and geographic footprint Demonstrating commitment to ESG leadership ü ü ü ü ü ü ü ü

Appendix
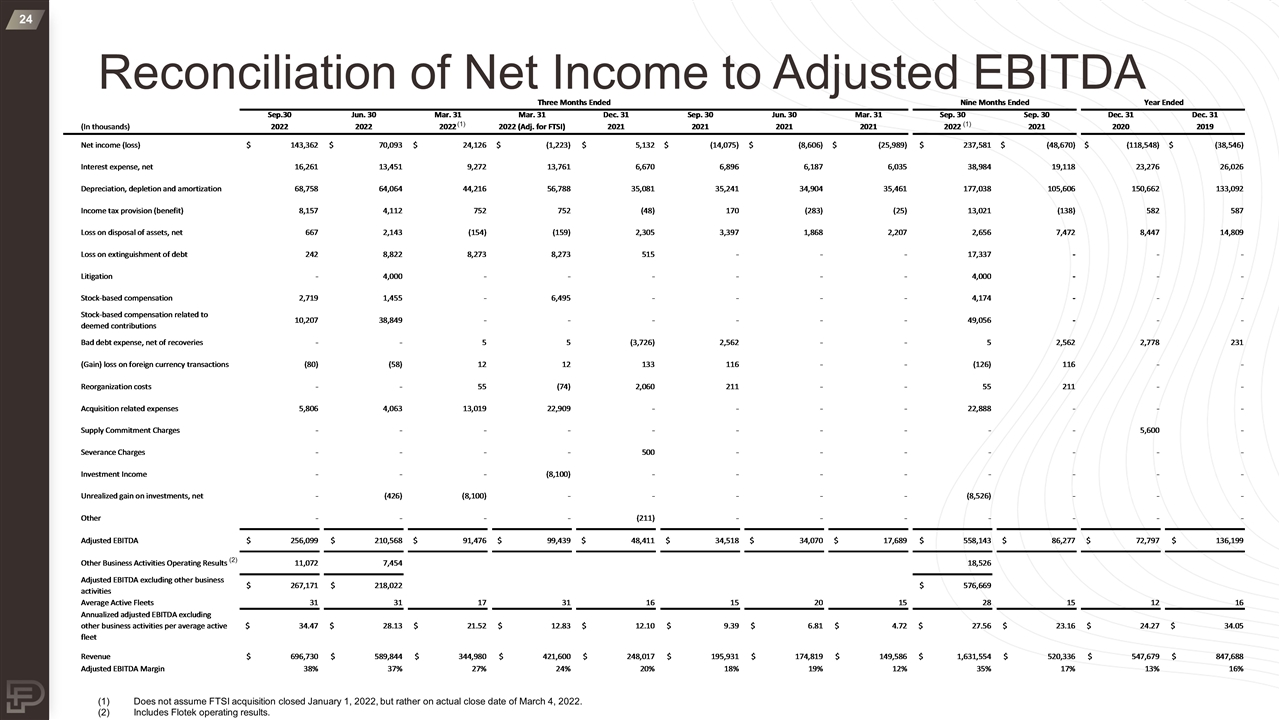
Reconciliation of Net Income to Adjusted EBITDA Does not assume FTSI acquisition closed January 1, 2022, but rather on actual close date of March 4, 2022. Includes Flotek operating results. (1) (2) (1)
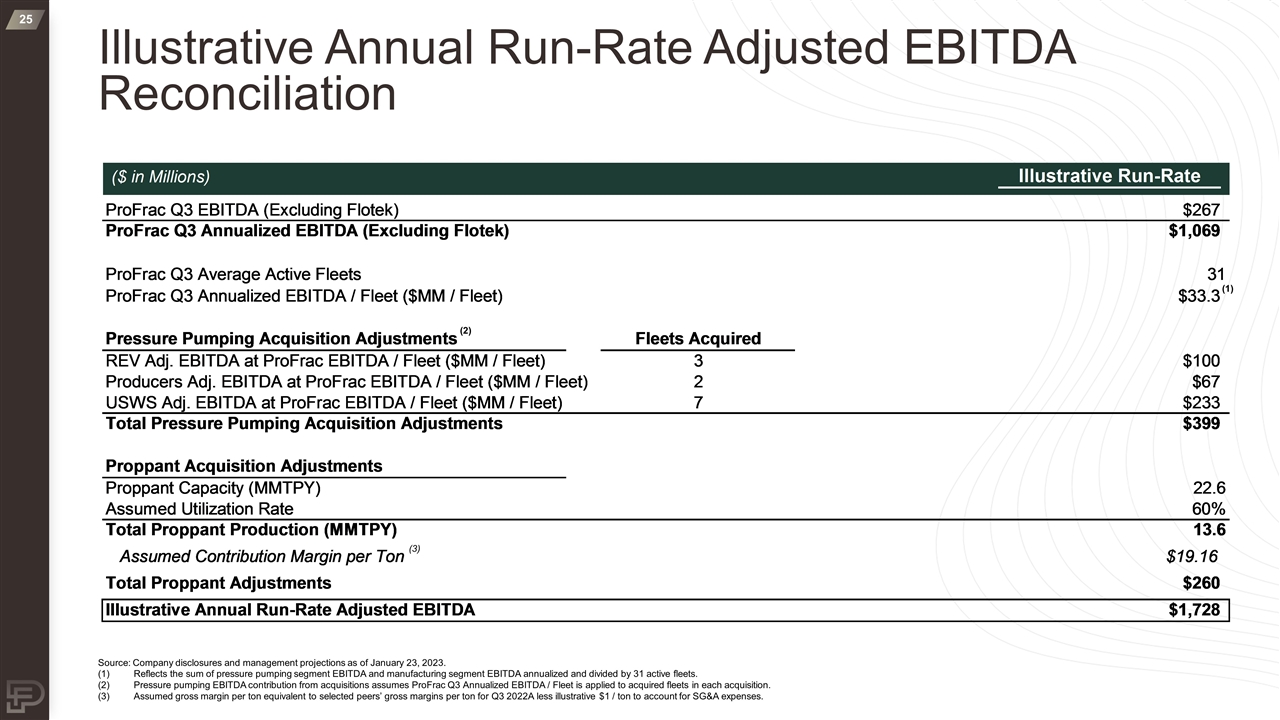
Illustrative Annual Run-Rate Adjusted EBITDA Reconciliation Source: Company disclosures and management projections as of January 23, 2023. Reflects the sum of pressure pumping segment EBITDA and manufacturing segment EBITDA annualized and divided by 31 active fleets. Pressure pumping EBITDA contribution from acquisitions assumes ProFrac Q3 Annualized EBITDA / Fleet is applied to acquired fleets in each acquisition. Assumed gross margin per ton equivalent to selected peers’ gross margins per ton for Q3 2022A less illustrative $1 / ton to account for SG&A expenses. (1) (2) (3)
