
Exhibit 99.3 Nasdaq GS: ACDC November 2022 Investor Presentation w w w . P F H o l d i n g s C o r p . c o m
2 Safe Harbor Forward-Looking Statements Certain statements in this presentation (and the oral statements made in connection therewith) may be considered “forward-looking statements” within the meaning of the “safe harbor” provisions of the Private Securities Litigation Reform Act of 1995. In some cases, the reader can identify forward-looking statements by words such as “may,” “should,” “expect,” “intend,” “will,” “estimate,” “anticipate,” “believe,” “predict,” or similar words. Forward-looking statements relate to future events or ProFrac’s future financial or operating performance. These forward-looking statements include, among other things, statements regarding: ProFrac’s strategies and plans for growth; ProFrac’s positioning, resources, capabilities, and expectations for future performance; market and industry expectations; the anticipated benefits of ProFrac’s July 2022 acquisition of SPS Monahans and November 2022 acquisition of U.S. Well Services, Inc.; ProFrac’s estimates with respect to the profitability and utilization of its electric, conventional and dual fleets; ProFrac’s currently expected guidance regarding its fourth quarter 2022 results of operations; ProFrac’s currently expected guidance regarding its full year 2022 capital expenditures and capital allocation; statements regarding the availability of funds under ProFrac’s credit facilities; ProFrac’s anticipated timing for operationalizing its new electric fleets and its West Munger sand plant; the amount of capital available to ProFrac in future periods; any financial or other information based upon or otherwise incorporating judgments or estimates relating to future performance, events or expectations; any estimates and forecasts of financial and other performance metrics; and ProFrac’s outlook and financial and other guidance. Such forward-looking statements are based upon assumptions made by ProFrac as of the date hereof and are subject to risks, uncertainties, and other factors that could cause actual results to differ materially from those expressed or implied by such forward- looking statements. Factors that may cause actual results to differ materially from current expectations include, but are not limited to: the ability to achieve the anticipated benefits of the acquisitions of U.S. Well Services, Inc. and SPS Monahans, including risks relating to integrating acquired companies and personnel; the failure to operationalize ProFrac’s new electric fleets and West Munger sand plant in a timely manner or at all; ProFrac’s ability to deploy capital in a manner that furthers its growth strategy, as well as ProFrac’s general ability to execute its business plans; industry conditions, including fluctuations in supply, demand and prices for ProFrac’s products and services; global and regional economic and financial conditions; the effectiveness of ProFrac’s risk management strategies; the transition to becoming a public company; and other risks and uncertainties set forth in the sections entitled “Risk Factors” and “Cautionary Note Regarding Forward-Looking Statements” in ProFrac’s filings with the Securities and Exchange Commission (“SEC”), which are available on the SEC’s website at www.sec.gov. Nothing in this presentation should be regarded as a representation by any person that the forward-looking statements set forth in this presentation (and the oral statements made in connection therewith) will be achieved or that any of the contemplated results of such forward looking statements will be achieved, including without limitation any expectations about ProFrac’s operational and financial performance or achievements through and including 2022. There may be additional risks about which ProFrac is presently unaware or that ProFrac currently believes are immaterial that could also cause actual results to differ from those contained in the forward-looking statements. The reader should not place undue reliance on forward-looking statements, which speak only as of the date they are made. ProFrac anticipates that subsequent events and developments will cause its assessments to change. However, while ProFrac may elect to update these forward-looking statements at some point in the future, it expressly disclaims any duty to update these forward-looking statements, except as otherwise required by law. Industry and Market Data This presentation has been prepared by ProFrac and includes market data and certain other statistical information from third-party sources, including independent industry publications, government publications and other published independent sources. Although we believe these third-party sources are reliable as of their respective dates, we have not independently verified the accuracy or completeness of this information. Some data is also based on our good faith estimates. The industry in which we operate is subject to a high degree of uncertainty and risk due to a variety of factors. These and other factors could cause results to differ materially from those expressed in these publications. Additionally, descriptions herein of market conditions and opportunities are presented for informational purposes only; there can be no assurance that such conditions will actually occur. Please also see “Forward-Looking Statements.”
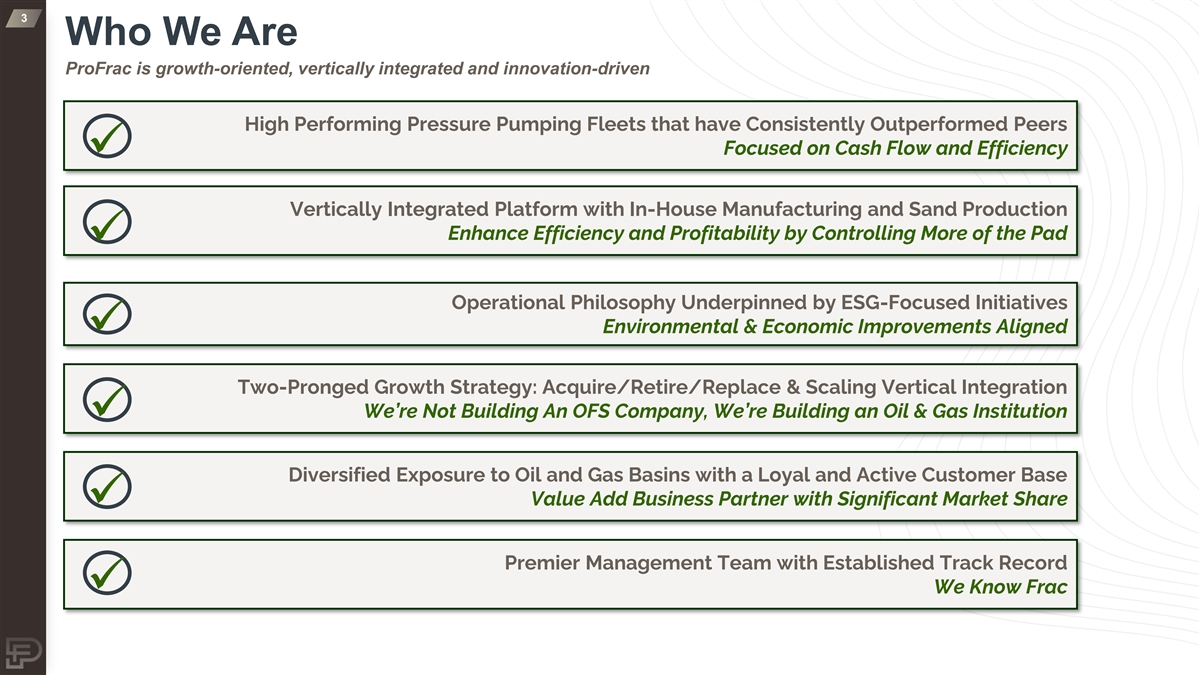
3 Who We Are ProFrac is growth-oriented, vertically integrated and innovation-driven High Performing Pressure Pumping Fleets that have Consistently Outperformed Peers Focused on Cash Flow and Efficiency ✓ Vertically Integrated Platform with In-House Manufacturing and Sand Production Enhance Efficiency and Profitability by Controlling More of the Pad ✓ Operational Philosophy Underpinned by ESG-Focused Initiatives Environmental & Economic Improvements Aligned ✓ Two-Pronged Growth Strategy: Acquire/Retire/Replace & Scaling Vertical Integration We’re Not Building An OFS Company, We’re Building an Oil & Gas Institution ✓ Diversified Exposure to Oil and Gas Basins with a Loyal and Active Customer Base Value Add Business Partner with Significant Market Share ✓ Premier Management Team with Established Track Record We Know Frac ✓
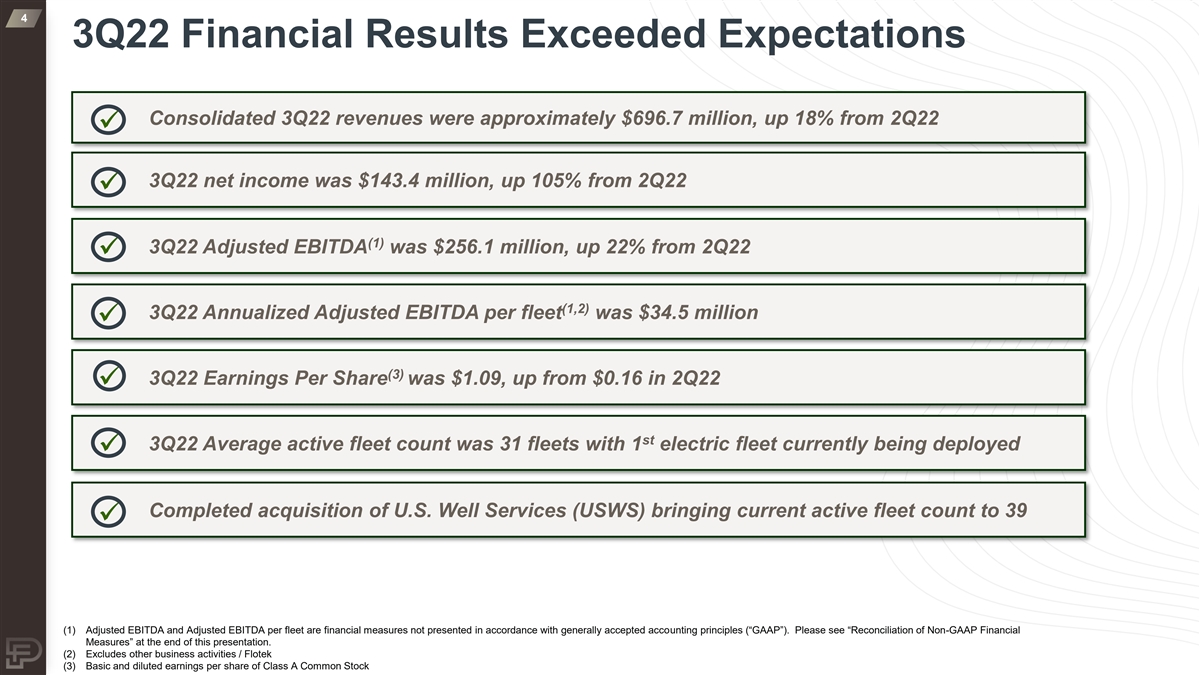
4 3Q22 Financial Results Exceeded Expectations Consolidated 3Q22 revenues were approximately $696.7 million, up 18% from 2Q22 ✓ 3Q22 net income was $143.4 million, up 105% from 2Q22 ✓ (1) 3Q22 Adjusted EBITDA was $256.1 million, up 22% from 2Q22 ✓ (1,2) 3Q22 Annualized Adjusted EBITDA per fleet was $34.5 million ✓ (3) 3Q22 Earnings Per Share was $1.09, up from $0.16 in 2Q22 ✓ st 3Q22 Average active fleet count was 31 fleets with 1 electric fleet currently being deployed ✓ Completed acquisition of U.S. Well Services (USWS) bringing current active fleet count to 39 ✓ (1) Adjusted EBITDA and Adjusted EBITDA per fleet are financial measures not presented in accordance with generally accepted accounting principles (“GAAP”). Please see “Reconciliation of Non-GAAP Financial Measures” at the end of this presentation. (2) Excludes other business activities / Flotek (3) Basic and diluted earnings per share of Class A Common Stock

5 ACDC: New Ticker Highlights Our Industry Leading Position in Electric Frac Technology ▪ Acquisition of U.S. Well Services solidifies our position as the industry leader in electric hydraulic fracturing ▪ Our new ticker symbol “ACDC” commemorates our market leadership – We own the industry's leading intellectual property portfolio that gave rise to electric frac technology with the market's first e-fleet deployment in 2014, which includes over 80+ patents ▪ Importantly, we expect that our ESG strategy will be greatly enhanced by reducing fuel costs and minimizing our emissions footprint ▪ Electric frac fleets have the potential to provide improved efficiency, lower R&M costs, greater value, and a lower overall cost of completion to our customer, which generate returns for us, our investors, our customers, the environment and the communities in which we operate
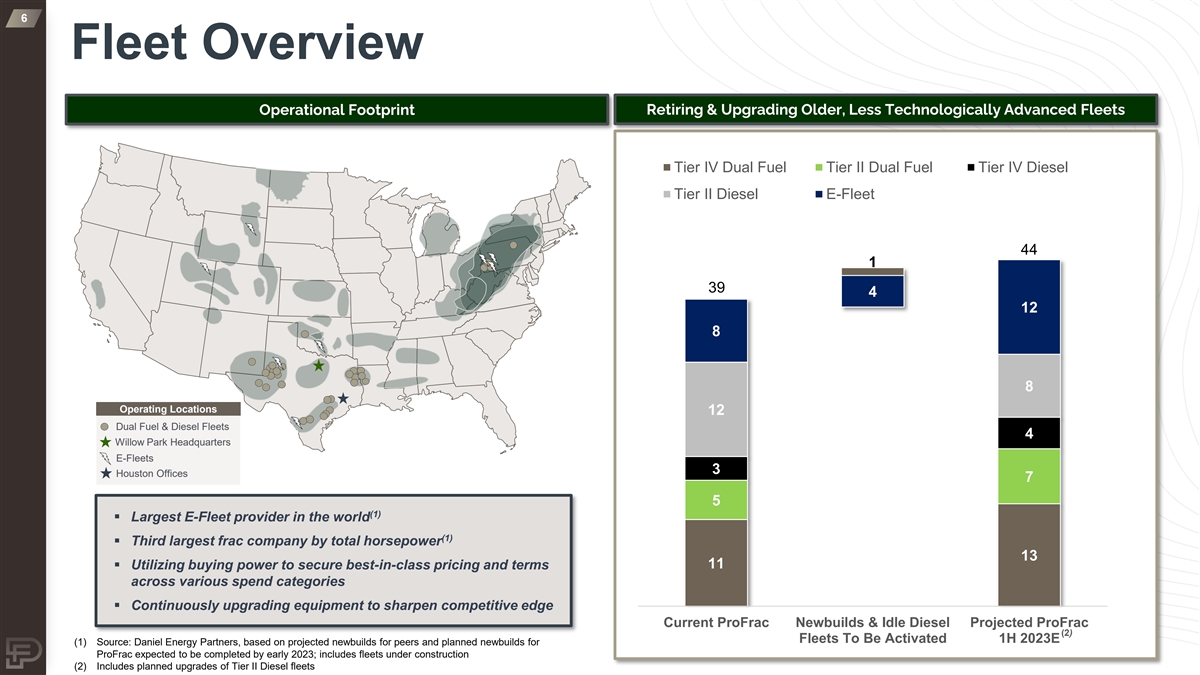
6 Fleet Overview Operational Footprint Retiring & Upgrading Older, Less Technologically Advanced Fleets Tier IV Dual Fuel Tier II Dual Fuel Tier IV Diesel Tier II Diesel E-Fleet 44 1 39 4 12 8 8 Operating Locations 12 Dual Fuel & Diesel Fleets 4 Willow Park Headquarters E-Fleets 3 Houston Offices 7 5 (1) ▪ Largest E-Fleet provider in the world (1) ▪ Third largest frac company by total horsepower 13 11 ▪ Utilizing buying power to secure best-in-class pricing and terms across various spend categories ▪ Continuously upgrading equipment to sharpen competitive edge Current ProFrac Newbuilds & Idle Diesel Projected ProFrac (2) Fleets To Be Activated 1H 2023E (1) Source: Daniel Energy Partners, based on projected newbuilds for peers and planned newbuilds for ProFrac expected to be completed by early 2023; includes fleets under construction (2) Includes planned upgrades of Tier II Diesel fleets
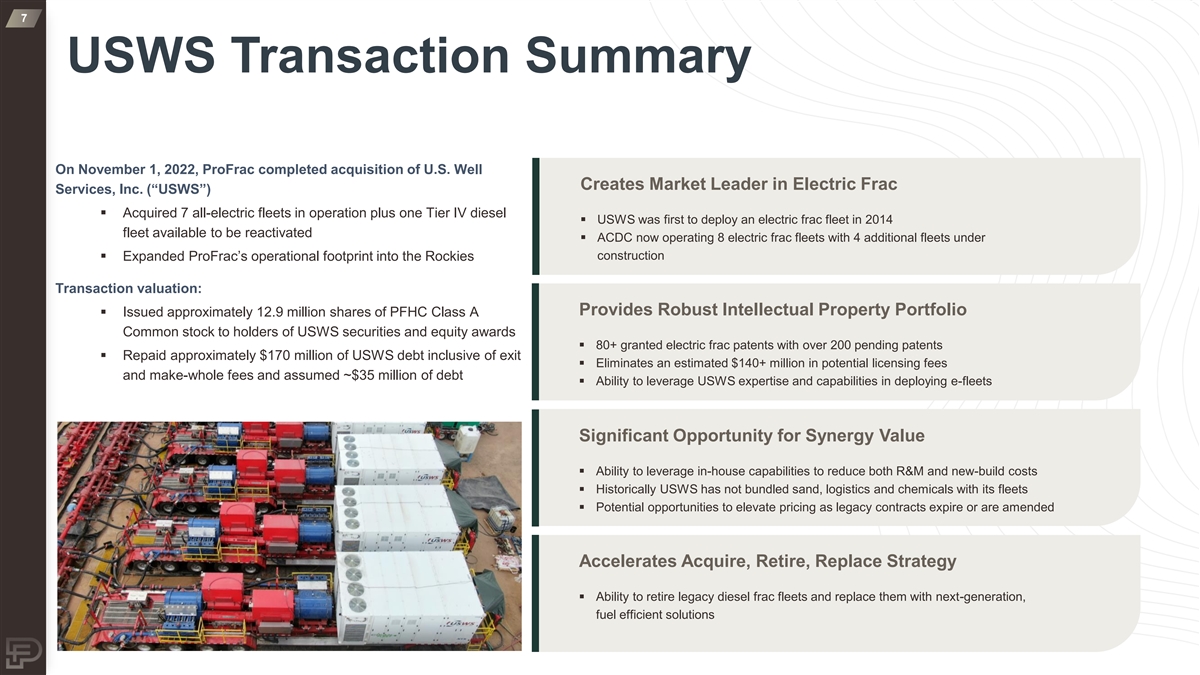
7 USWS Transaction Summary On November 1, 2022, ProFrac completed acquisition of U.S. Well Creates Market Leader in Electric Frac Services, Inc. (“USWS”) ▪ Acquired 7 all-electric fleets in operation plus one Tier IV diesel ▪ USWS was first to deploy an electric frac fleet in 2014 fleet available to be reactivated ▪ ACDC now operating 8 electric frac fleets with 4 additional fleets under construction ▪ Expanded ProFrac’s operational footprint into the Rockies Transaction valuation: Provides Robust Intellectual Property Portfolio ▪ Issued approximately 12.9 million shares of PFHC Class A Common stock to holders of USWS securities and equity awards ▪ 80+ granted electric frac patents with over 200 pending patents ▪ Repaid approximately $170 million of USWS debt inclusive of exit ▪ Eliminates an estimated $140+ million in potential licensing fees and make-whole fees and assumed ~$35 million of debt ▪ Ability to leverage USWS expertise and capabilities in deploying e-fleets Significant Opportunity for Synergy Value ▪ Ability to leverage in-house capabilities to reduce both R&M and new-build costs ▪ Historically USWS has not bundled sand, logistics and chemicals with its fleets ▪ Potential opportunities to elevate pricing as legacy contracts expire or are amended Accelerates Acquire, Retire, Replace Strategy ▪ Ability to retire legacy diesel frac fleets and replace them with next-generation, fuel efficient solutions
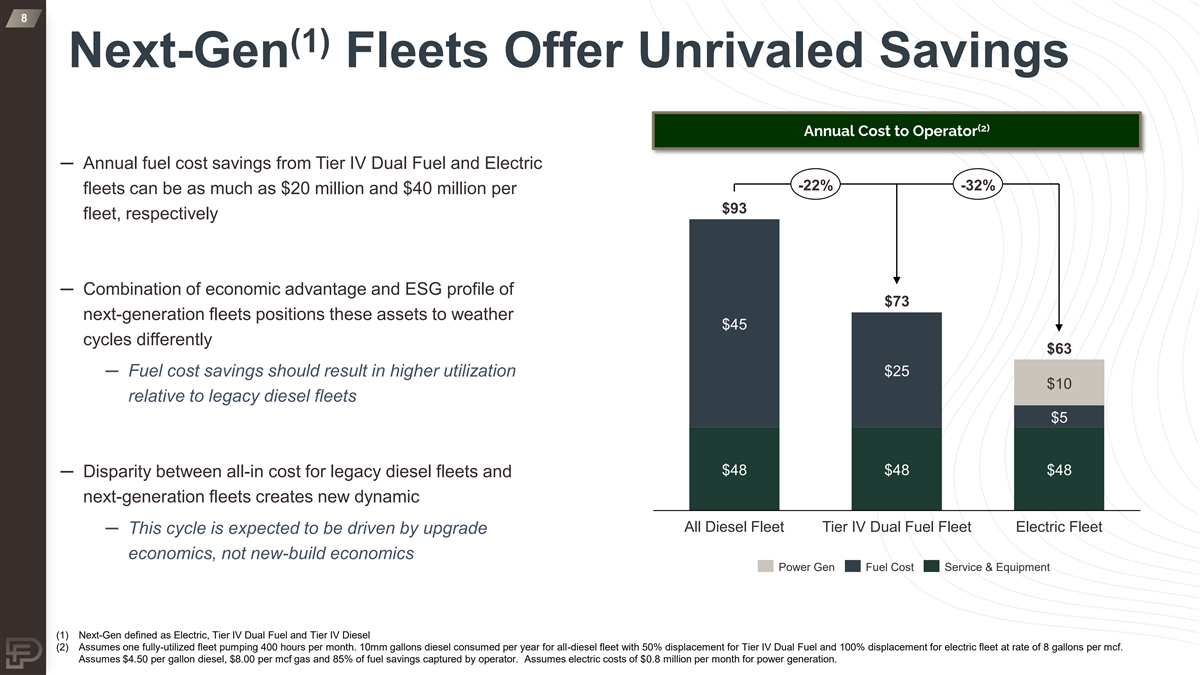
8 (1) Next-Gen Fleets Offer Unrivaled Savings (2) Annual Cost to Operator ─ Annual fuel cost savings from Tier IV Dual Fuel and Electric -22% -32% fleets can be as much as $20 million and $40 million per $93 fleet, respectively ─ Combination of economic advantage and ESG profile of $73 next-generation fleets positions these assets to weather $45 cycles differently $63 ─ Fuel cost savings should result in higher utilization $25 $10 relative to legacy diesel fleets $5 $48 $48 $48 ─ Disparity between all-in cost for legacy diesel fleets and next-generation fleets creates new dynamic All Diesel Fleet Tier IV Dual Fuel Fleet Electric Fleet ─ This cycle is expected to be driven by upgrade economics, not new-build economics Power Gen Fuel Cost Service & Equipment (1) Next-Gen defined as Electric, Tier IV Dual Fuel and Tier IV Diesel (2) Assumes one fully-utilized fleet pumping 400 hours per month. 10mm gallons diesel consumed per year for all-diesel fleet with 50% displacement for Tier IV Dual Fuel and 100% displacement for electric fleet at rate of 8 gallons per mcf. Assumes $4.50 per gallon diesel, $8.00 per mcf gas and 85% of fuel savings captured by operator. Assumes electric costs of $0.8 million per month for power generation.
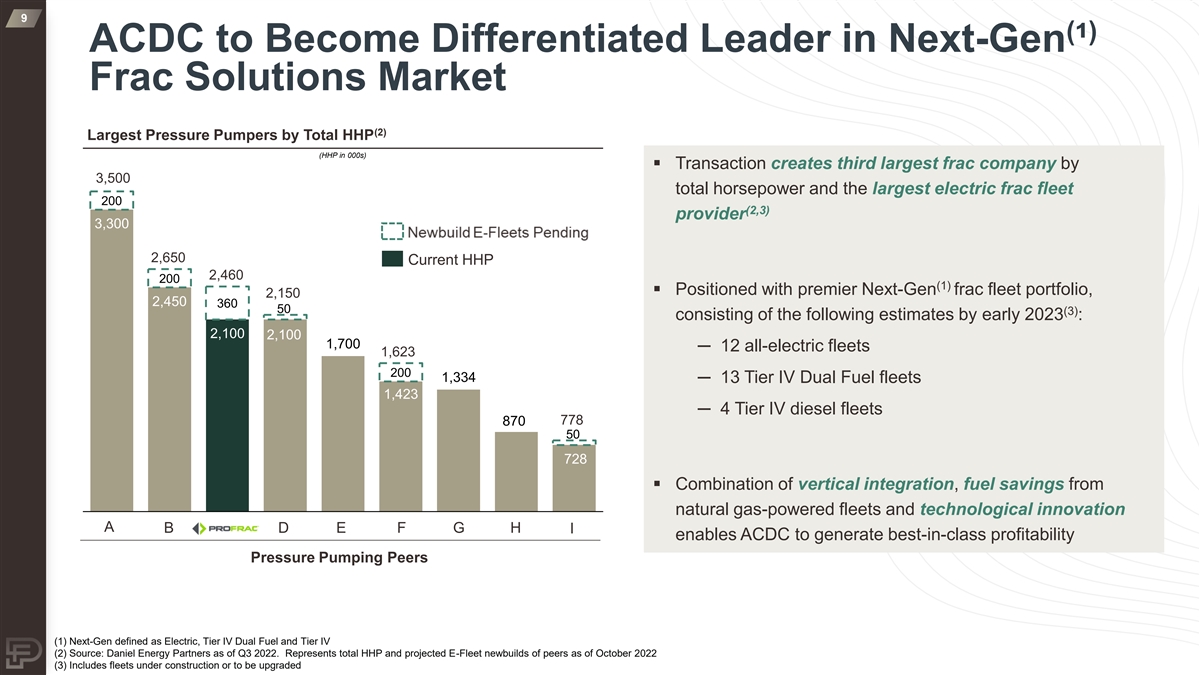
9 ( ) ACDC to Become Differentiated Leader in Next-Gen ¹ Frac Solutions Market (2) Largest Pressure Pumpers by Total HHP (HHP in 000s) ▪ Transaction creates third largest frac company by 3,500 total horsepower and the largest electric frac fleet 200 (2,3) provider 3,300 2,650 Current HHP 2,460 200 (1) ▪ Positioned with premier Next-Gen frac fleet portfolio, 2,150 2,450 360 50 (3) consisting of the following estimates by early 2023 : 2,100 2,100 1,700 ─ 12 all-electric fleets 1,623 200 1,334 ─ 13 Tier IV Dual Fuel fleets 1,423 ─ 4 Tier IV diesel fleets 778 870 50 728 ▪ Combination of vertical integration, fuel savings from natural gas-powered fleets and technological innovation A B D E F G H I enables ACDC to generate best-in-class profitability Pressure Pumping Peers (1) Next-Gen defined as Electric, Tier IV Dual Fuel and Tier IV (2) Source: Daniel Energy Partners as of Q3 2022. Represents total HHP and projected E-Fleet newbuilds of peers as of October 2022 (3) Includes fleets under construction or to be upgraded
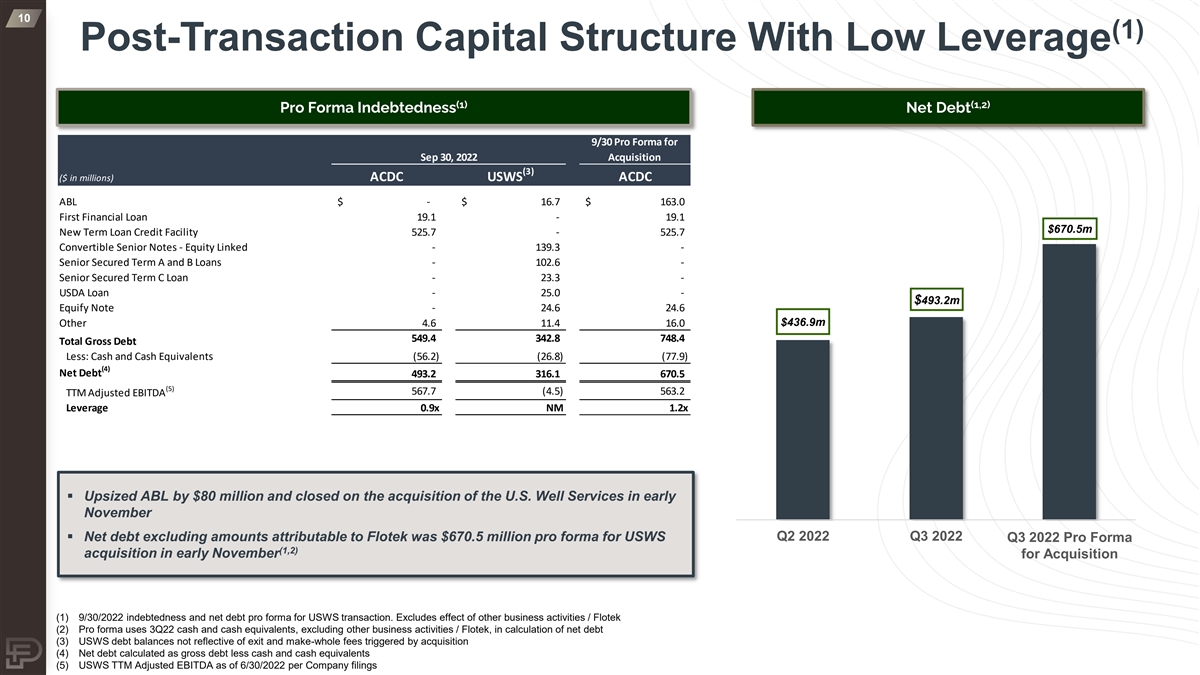
10 (1) Post-Transaction Capital Structure With Low Leverage (1) (1,2) Pro Forma Indebtedness Net Debt 9/30 Pro Forma for Sep 30, 2022 Acquisition (3) ($ in millions) ACDC USWS ACDC ABL $ - $ 16.7 $ 163.0 First Financial Loan 19.1 - 19.1 $670.5m New Term Loan Credit Facility 525.7 - 5 25.7 Convertible Senior Notes - Equity Linked - 139.3 - Senior Secured Term A and B Loans - 102.6 - Senior Secured Term C Loan - 23.3 - USDA Loan - 2 5.0 - $493.2m Equify Note - 24.6 24.6 Other 4.6 11.4 16.0 $436.9m 549.4 342.8 748.4 Total Gross Debt Less: Cash and Cash Equivalents (56.2) (26.8) (77.9) (4) Net Debt 493.2 316.1 670.5 (5) 567.7 (4.5) 563.2 TTM Adjusted EBITDA Leverage 0.9x NM 1.2x ▪ Upsized ABL by $80 million and closed on the acquisition of the U.S. Well Services in early November ▪ Net debt excluding amounts attributable to Flotek was $670.5 million pro forma for USWS Q2 2022 Q3 2022 Q3 2022 Pro Forma (1,2) acquisition in early November for Acquisition (1) 9/30/2022 indebtedness and net debt pro forma for USWS transaction. Excludes effect of other business activities / Flotek (2) Pro forma uses 3Q22 cash and cash equivalents, excluding other business activities / Flotek, in calculation of net debt (3) USWS debt balances not reflective of exit and make-whole fees triggered by acquisition (4) Net debt calculated as gross debt less cash and cash equivalents (5) USWS TTM Adjusted EBITDA as of 6/30/2022 per Company filings

Investor Contacts: Lance Turner Bryan Wheatly Chief Financial Officer Director, Investor Relations investors@profrac.com investors@profrac.com 254-776-3722 717-368-7720 Ken Dennard / Rick Black ACDC@dennardlascar.com 713-529-6600 w w w . P F H o l d i n g s C o r p . c o m

12 Appendix Financial Results and Non-GAAP Reconciliations
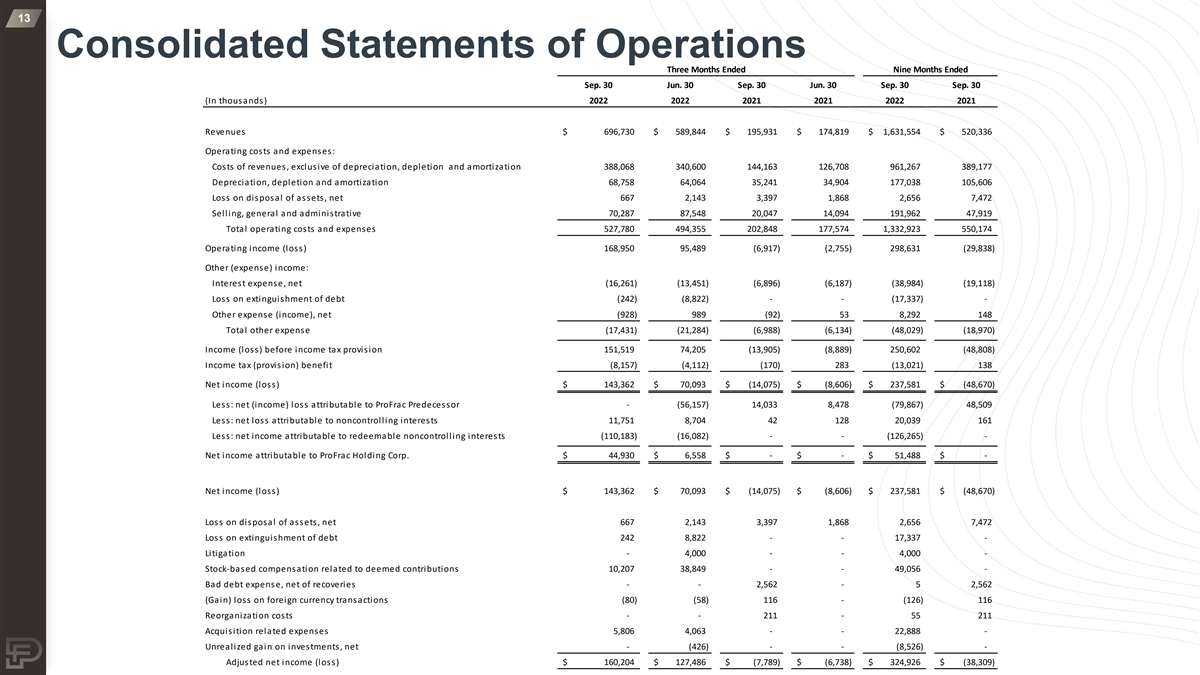
13 Consolidated Statements of Operations Three Months Ended Nine Months Ended Sep. 30 Jun. 30 Sep. 30 Jun. 30 Sep. 30 Sep. 30 (In thousands) 2022 2022 2021 2021 2022 2021 Revenues $ 696,730 $ 5 89,844 $ 1 95,931 $ 174,819 $ 1 ,631,554 $ 5 20,336 Operating costs and expenses: Costs of revenues, exclusive of depreciation, depletion and amortization 388,068 3 40,600 1 44,163 126,708 961,267 389,177 Depreciation, depletion and amortization 68,758 64,064 3 5,241 34,904 1 77,038 105,606 Loss on disposal of assets, net 667 2 ,143 3 ,397 1 ,868 2,656 7 ,472 Selling, general and administrative 70,287 8 7,548 20,047 14,094 1 91,962 4 7,919 Total operating costs and expenses 527,780 494,355 2 02,848 177,574 1,332,923 5 50,174 Operating income (loss) 168,950 9 5,489 (6,917) (2,755) 298,631 (29,838) Other (expense) income: Interest expense, net (16,261) (13,451) (6,896) (6,187) (38,984) (19,118) Loss on extinguishment of debt ( 242) (8,822) - - (17,337) - Other expense (income), net ( 928) 989 (92) 53 8 ,292 148 Total other expense (17,431) (21,284) (6,988) (6,134) (48,029) (18,970) Income (loss) before income tax provision 151,519 7 4,205 (13,905) (8,889) 2 50,602 (48,808) Income tax (provision) benefit ( 8,157) (4,112) (170) 283 (13,021) 138 Net income (loss) $ 143,362 $ 7 0,093 $ (14,075) $ (8,606) $ 237,581 $ (48,670) Less: net (income) loss attributable to ProFrac Predecessor - (56,157) 1 4,033 8,478 (79,867) 48,509 Less: net loss attributable to noncontrolling interests 11,751 8 ,704 42 128 20,039 161 Less: net income attributable to redeemable noncontrolling interests (110,183) (16,082) - - (126,265) - Net income attributable to ProFrac Holding Corp. $ 44,930 $ 6 ,558 $ - $ - $ 51,488 $ - Net income (loss) $ 143,362 $ 70,093 $ (14,075) $ (8,606) $ 2 37,581 $ (48,670) Loss on disposal of assets, net 667 2,143 3 ,397 1,868 2,656 7 ,472 Loss on extinguishment of debt 242 8,822 - - 1 7,337 - Litigation - 4 ,000 - - 4,000 - Stock-based compensation related to deemed contributions 10,207 38,849 - - 49,056 - Bad debt expense, net of recoveries - - 2 ,562 - 5 2,562 (Gain) loss on foreign currency transactions (80) (58) 116 - (126) 116 Reorganization costs - - 211 - 55 211 Acquisition related expenses 5,806 4 ,063 - - 2 2,888 - Unrealized gain on investments, net - (426) - - (8,526) - Adjusted net income (loss) $ 160,204 $ 127,486 $ (7,789) $ (6,738) $ 324,926 $ (38,309)
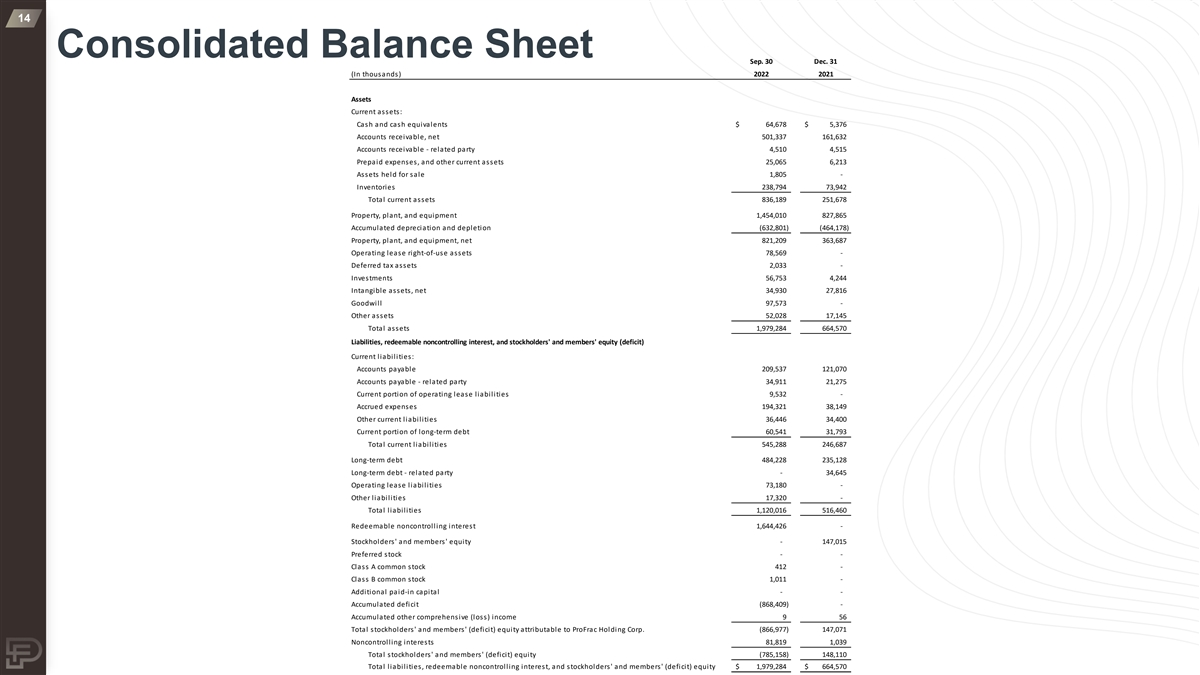
14 Consolidated Balance Sheet Sep. 30 Dec. 31 (In thousands) 2022 2021 Assets Current assets: Cash and cash equivalents $ 64,678 $ 5 ,376 Accounts receivable, net 501,337 161,632 Accounts receivable - related party 4,510 4,515 Prepaid expenses, and other current assets 25,065 6,213 Assets held for sale 1,805 - Inventories 238,794 7 3,942 Total current assets 836,189 251,678 Property, plant, and equipment 1,454,010 827,865 Accumulated depreciation and depletion (632,801) (464,178) Property, plant, and equipment, net 821,209 363,687 Operating lease right-of-use assets 78,569 - Deferred tax assets 2,033 - Investments 56,753 4,244 Intangible assets, net 34,930 27,816 Goodwill 97,573 - Other assets 52,028 17,145 Total assets 1,979,284 6 64,570 Liabilities, redeemable noncontrolling interest, and stockholders' and members' equity (deficit) Current liabilities: Accounts payable 209,537 121,070 Accounts payable - related party 34,911 2 1,275 Current portion of operating lease liabilities 9,532 - Accrued expenses 194,321 3 8,149 Other current liabilities 36,446 34,400 Current portion of long-term debt 60,541 31,793 Total current liabilities 545,288 246,687 Long-term debt 484,228 235,128 Long-term debt - related party - 34,645 Operating lease liabilities 73,180 - Other liabilities 17,320 - Total liabilities 1,120,016 516,460 Redeemable noncontrolling interest 1,644,426 - Stockholders' and members' equity - 1 47,015 Preferred stock - - Class A common stock 412 - Class B common stock 1,011 - Additional paid-in capital - - Accumulated deficit (868,409) - Accumulated other comprehensive (loss) income 9 56 Total stockholders' and members' (deficit) equity attributable to ProFrac Holding Corp. (866,977) 147,071 Noncontrolling interests 81,819 1 ,039 Total stockholders' and members' (deficit) equity (785,158) 1 48,110 Total liabilities, redeemable noncontrolling interest, and stockholders' and members' (deficit) equity $ 1,979,284 $ 6 64,570
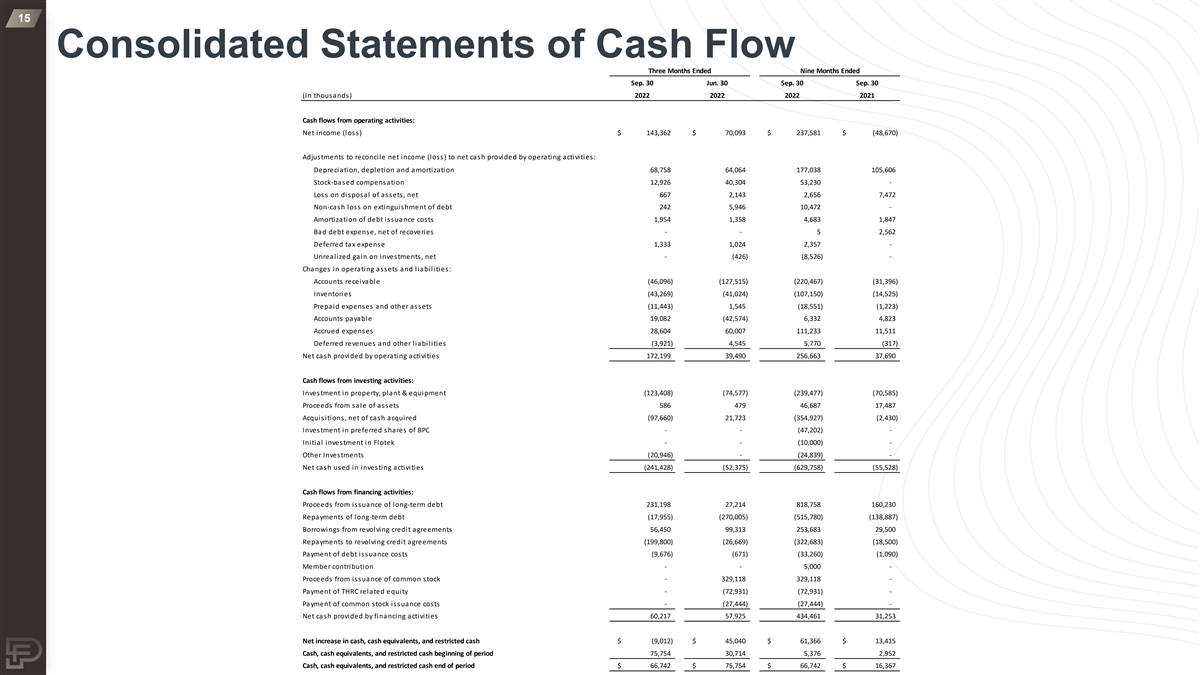
15 Consolidated Statements of Cash Flow Three Months Ended Nine Months Ended Sep. 30 Jun. 30 Sep. 30 Sep. 30 (In thousands) 2022 2022 2022 2021 Cash flows from operating activities: Net income (loss) $ 143,362 $ 70,093 $ 237,581 $ (48,670) Adjustments to reconcile net income (loss) to net cash provided by operating activities: Depreciation, depletion and amortization 68,758 64,064 177,038 105,606 Stock-based compensation 12,926 40,304 53,230 - Loss on disposal of assets, net 667 2,143 2,656 7,472 Non-cash loss on extinguishment of debt 242 5,946 10,472 - Amortization of debt issuance costs 1,954 1,358 4,683 1,847 Bad debt expense, net of recoveries - - 5 2,562 Deferred tax expense 1,333 1,024 2,357 - Unrealized gain on investments, net - (426) ( 8,526) - Changes in operating assets and liabilities: Accounts receivable (46,096) (127,515) (220,467) (31,396) Inventories (43,269) ( 41,024) (107,150) ( 14,525) Prepaid expenses and other assets ( 11,443) 1,545 ( 18,551) (1,223) Accounts payable 19,082 ( 42,574) 6,332 4,823 Accrued expenses 28,604 60,007 111,233 11,511 Deferred revenues and other liabilities (3,921) 4,545 5,770 (317) Net cash provided by operating activities 172,199 39,490 256,663 37,690 Cash flows from investing activities: Investment in property, plant & equipment (123,408) ( 74,577) (239,477) (70,585) Proceeds from sale of assets 586 479 46,687 17,487 Acquisitions, net of cash acquired ( 97,660) 21,723 ( 354,927) (2,430) Investment in preferred shares of BPC - - ( 47,202) - Initial investment in Flotek - - (10,000) - Other Investments ( 20,946) - (24,839) - Net cash used in investing activities (241,428) ( 52,375) ( 629,758) (55,528) Cash flows from financing activities: Proceeds from issuance of long-term debt 231,198 27,214 818,758 160,230 Repayments of long-term debt (17,955) ( 270,005) ( 515,780) ( 138,887) Borrowings from revolving credit agreements 56,450 99,313 253,683 29,500 Repayments to revolving credit agreements (199,800) ( 26,669) ( 322,683) (18,500) Payment of debt issuance costs (9,676) (671) (33,260) ( 1,090) Member contribution - - 5,000 - Proceeds from issuance of common stock - 329,118 329,118 - Payment of THRC related equity - ( 72,931) ( 72,931) - Payment of common stock issuance costs - (27,444) ( 27,444) - Net cash provided by financing activities 60,217 57,925 434,461 31,253 Net increase in cash, cash equivalents, and restricted cash $ ( 9,012) $ 45,040 $ 61,366 $ 13,415 Cash, cash equivalents, and restricted cash beginning of period 75,754 30,714 5,376 2,952 Cash, cash equivalents, and restricted cash end of period $ 66,742 $ 75,754 $ 66,742 $ 16,367
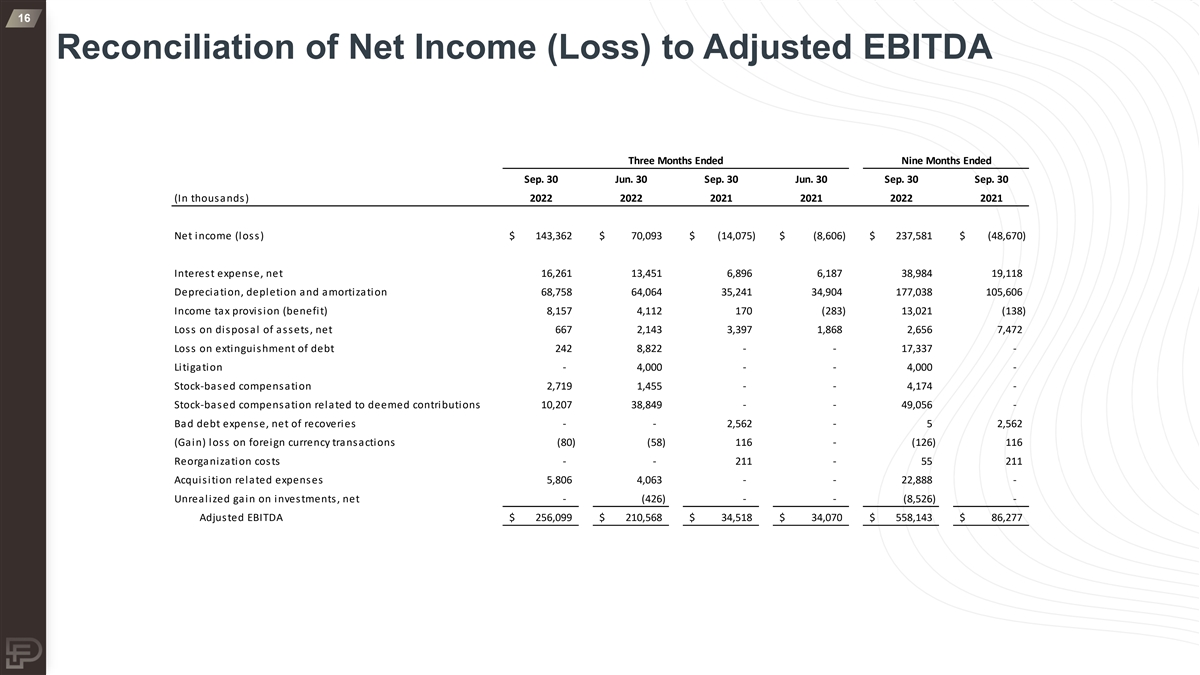
16 Reconciliation of Net Income (Loss) to Adjusted EBITDA Three Months Ended Nine Months Ended Sep. 30 Jun. 30 Sep. 30 Jun. 30 Sep. 30 Sep. 30 (In thousands) 2022 2022 2021 2021 2022 2021 Net income (loss) $ 143,362 $ 7 0,093 $ (14,075) $ (8,606) $ 237,581 $ (48,670) Interest expense, net 1 6,261 1 3,451 6 ,896 6 ,187 3 8,984 1 9,118 Depreciation, depletion and amortization 6 8,758 64,064 3 5,241 3 4,904 177,038 1 05,606 Income tax provision (benefit) 8,157 4,112 170 (283) 1 3,021 (138) Loss on disposal of assets, net 667 2,143 3,397 1 ,868 2 ,656 7,472 Loss on extinguishment of debt 242 8 ,822 - - 17,337 - Litigation - 4,000 - - 4 ,000 - Stock-based compensation 2 ,719 1,455 - - 4,174 - Stock-based compensation related to deemed contributions 10,207 38,849 - - 49,056 - Bad debt expense, net of recoveries - - 2,562 - 5 2,562 (Gain) loss on foreign currency transactions (80) (58) 116 - (126) 116 Reorganization costs - - 211 - 55 211 Acquisition related expenses 5,806 4 ,063 - - 22,888 - Unrealized gain on investments, net - (426) - - (8,526) - Adjusted EBITDA $ 2 56,099 $ 210,568 $ 34,518 $ 3 4,070 $ 558,143 $ 8 6,277
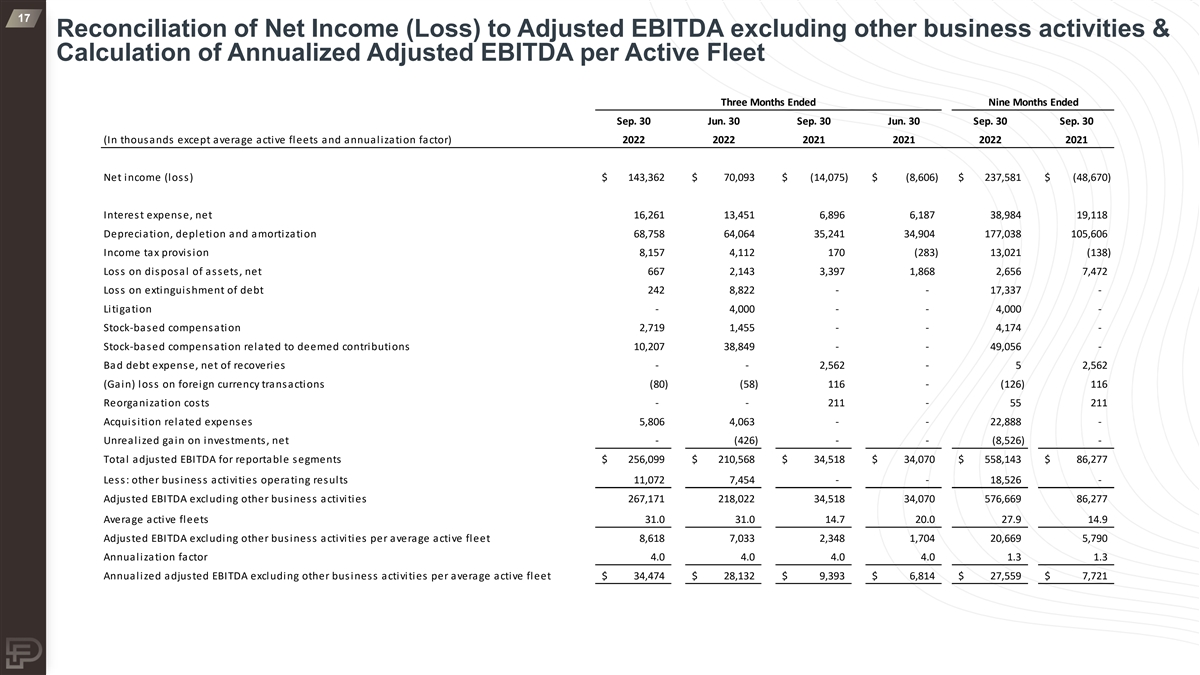
17 Reconciliation of Net Income (Loss) to Adjusted EBITDA excluding other business activities & Calculation of Annualized Adjusted EBITDA per Active Fleet Three Months Ended Nine Months Ended Sep. 30 Jun. 30 Sep. 30 Jun. 30 Sep. 30 Sep. 30 (In thousands except average active fleets and annualization factor) 2022 2022 2021 2021 2022 2021 Net income (loss) $ 1 43,362 $ 70,093 $ (14,075) $ (8,606) $ 2 37,581 $ (48,670) Interest expense, net 16,261 13,451 6 ,896 6,187 38,984 19,118 Depreciation, depletion and amortization 68,758 6 4,064 3 5,241 34,904 177,038 105,606 Income tax provision 8,157 4,112 170 (283) 1 3,021 (138) Loss on disposal of assets, net 667 2,143 3,397 1 ,868 2 ,656 7 ,472 Loss on extinguishment of debt 242 8,822 - - 1 7,337 - Litigation - 4,000 - - 4,000 - Stock-based compensation 2 ,719 1 ,455 - - 4,174 - Stock-based compensation related to deemed contributions 10,207 38,849 - - 49,056 - Bad debt expense, net of recoveries - - 2 ,562 - 5 2,562 (Gain) loss on foreign currency transactions (80) (58) 116 - (126) 116 Reorganization costs - - 211 - 55 211 Acquisition related expenses 5,806 4 ,063 - - 2 2,888 - Unrealized gain on investments, net - (426) - - (8,526) - Total adjusted EBITDA for reportable segments $ 2 56,099 $ 2 10,568 $ 34,518 $ 34,070 $ 5 58,143 $ 86,277 Less: other business activities operating results 1 1,072 7,454 - - 1 8,526 - Adjusted EBITDA excluding other business activities 267,171 218,022 3 4,518 34,070 5 76,669 86,277 Average active fleets 3 1.0 31.0 1 4.7 20.0 2 7.9 14.9 Adjusted EBITDA excluding other business activities per average active fleet 8 ,618 7 ,033 2,348 1,704 20,669 5,790 Annualization factor 4.0 4 .0 4.0 4.0 1.3 1.3 Annualized adjusted EBITDA excluding other business activities per average active fleet $ 34,474 $ 2 8,132 $ 9 ,393 $ 6,814 $ 27,559 $ 7 ,721
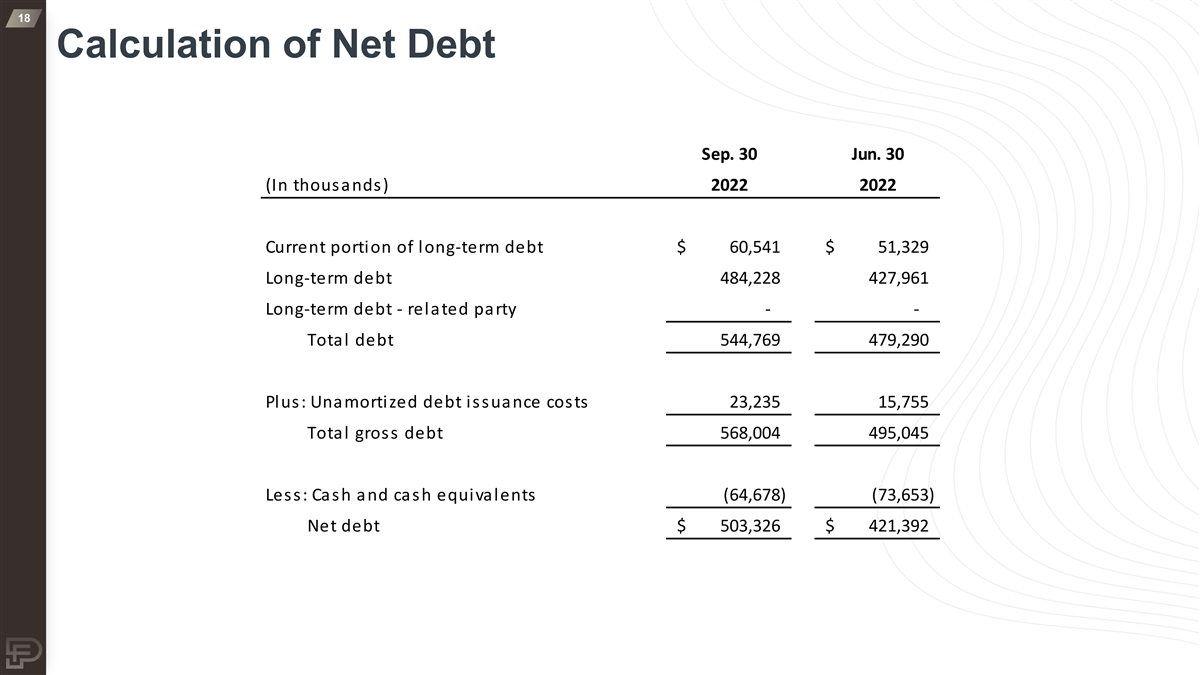
18 Calculation of Net Debt Sep. 30 Jun. 30 (In thousands) 2022 2022 Current portion of long-term debt $ 6 0,541 $ 51,329 Long-term debt 4 84,228 4 27,961 Long-term debt - related party - - Total debt 5 44,769 4 79,290 Plus: Unamortized debt issuance costs 2 3,235 1 5,755 Total gross debt 5 68,004 495,045 Less: Cash and cash equivalents (64,678) (73,653) Net debt $ 5 03,326 $ 421,392
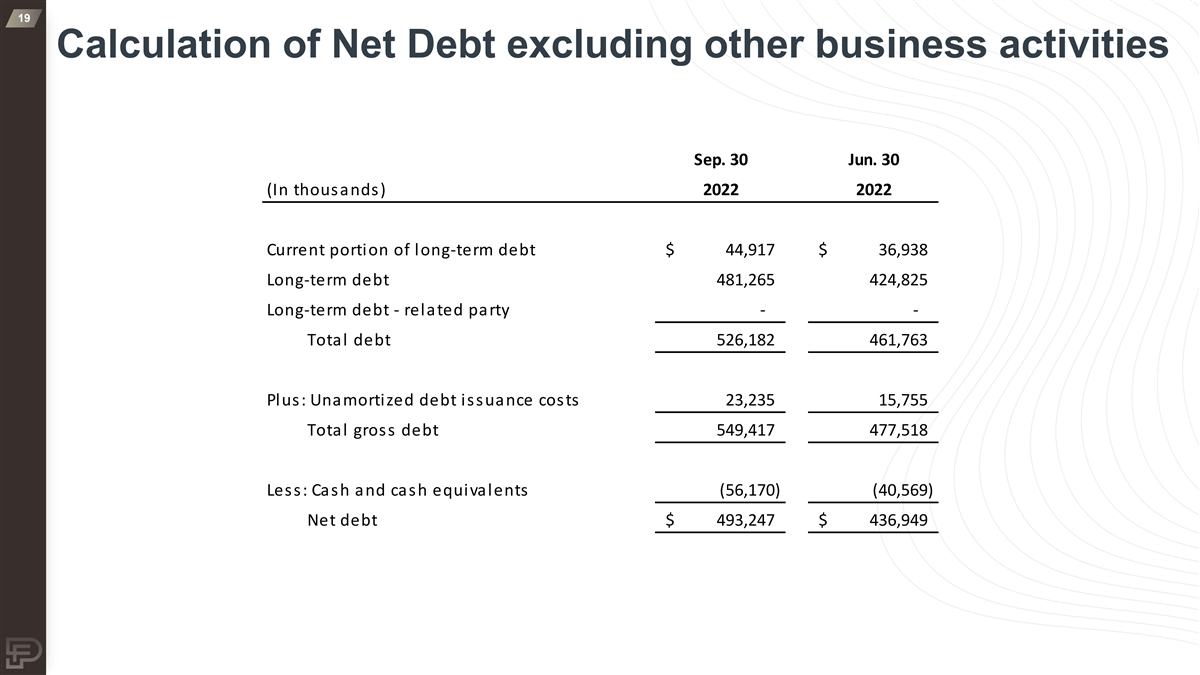
19 Calculation of Net Debt excluding other business activities Sep. 30 Jun. 30 (In thousands) 2022 2022 Current portion of long-term debt $ 4 4,917 $ 3 6,938 Long-term debt 481,265 424,825 Long-term debt - related party - - Total debt 526,182 4 61,763 Plus: Unamortized debt issuance costs 2 3,235 1 5,755 Total gross debt 549,417 477,518 Less: Cash and cash equivalents (56,170) (40,569) Net debt $ 4 93,247 $ 4 36,949