Exhibit 99.1

TECHNICAL REPORT SUMMARY

FRAC SAND RESOURCES AND RESERVES

ALPINE SILICA, LLC – KERMIT MINE

Winkler County, Texas

Prepared For

WILKS BROTHERS, LLC

By

John T. Boyd Company

Mining and Geological Consultants

Pittsburgh, Pennsylvania, USA


LOGO

Report No. 3976.001

SEPTEMBER 2021


  LOGO   


John T. Boyd Company

Mining and Geological Consultants


Chairman    September 24, 2021
James W. Boyd    File: 3976.001   
President and CEO      
John T. Boyd II      
Managing Director and COO    Wilks Brothers, LLC
Ronald L. Lewis   

301 East 18th Street

Cisco, TX 76437

Vice Presidents      
Robert J. Farmer      
Matthew E. Robb    Attention:    Mr. Ian Shaw

John I. Weiss

Michael F. Wick

      Vice President of Accounting and Finance

William P. Wolf


Managing Director - Australia

Ian L. Alexander


Managing Director - China

Jisheng (Jason) Han


   Subject:   

Technical Report Summary

Frac Sand Resources and Reserves

Alpine Silica, LLC – Kermit Mine

Winkler County, Texas

     
Managing Director – South America    Dear Sirs:   

Carlos F. Barrera


Managing Director – Metals

Gregory B. Sparks


Assistant to the President

Mark P. Davic


Pittsburgh

4000 Town Center Boulevard, Suite 300 Canonsburg, PA 15317

(724) 873-4400

(724) 873-4401 Fax

jtboydp@jtboyd. com


Denver

(303) 293-8988

jtboydd@jtboyd.com


Brisbane

61 7 3232-5000

jtboydau@jtboyd.com


Beijing

86 10 6500-5854

jtboydcn@jtboyd.com

Bogota

+57-3115382113

jtboydcol@jtboyd.com


www.jtboyd.com


This SK-1300-compliant technical report summary provides the results of John T. Boyd Company’s (BOYD) independent estimate of the frac (proppant) sand resources and reserves for Alpine Silica LLC’s (Alpine) Kermit Mine as of December 31, 2020.


We wish to acknowledge the cooperation of Alpine’s management and staff for providing the technical, financial, and legal information used in completing this project. Our findings are based on BOYD’s extensive experience in preparing frac sand resource and reserve estimates used in US Securities and Exchange Commission (SEC) filings, and our knowledge of frac sand mining in Texas and throughout North America.


Respectfully submitted,

JOHN T. BOYD COMPANY

By:

LOGO

John T. Boyd II

President and CEO


TABLE OF CONTENTS


Page

LETTER OF TRANSMITTAL


TABLE OF CONTENTS


GLOSSARY AND ABBREVIATIONS


1.0

  EXECUTIVE SUMMARY    1-1
  1.1   Introduction    1-1
  1.2   Property Description    1-1
  1.3   Geology    1-3
  1.4   Exploration    1-4
  1.5   Frac Sand Reserves    1-5
  1.6   Operations    1-6
    1.6.1    Mining    1-6
    1.6.2    Processing    1-7
    1.6.3    Infrastructure    1-8
  1.7   Financial Analysis    1-9
    1.7.1    Market Analysis    1-9
    1.7.2    Capital and Operating Costs    1-11
    1.7.3    Production and Sales    1-12
    1.7.4    Economic Analysis    1-12
  1.8   Regulation and Liabilities    1-13
  1.9   Conclusions    1-13

2.0

  INTRODUCTION    2-1
  2.1   Registrant and Purpose    2-1
  2.2   Terms of Reference    2-1
  2.3   Expert Qualifications    2-2
  2.4   Principal Sources of Information    2-3
    2.4.1    Site Visits    2-3
    2.4.2    Reliance on Information Provided by the Registrant    2-4
  2.5   Effective Date    2-4
  2.6   Units of Measure    2-4

3.0

  PROPERTY OVERVIEW    3-1
  3.1   Description and Location    3-1
  3.2   History       3-1
  3.3   Property Control    3-1
    3.3.1    Mineral Ownership    3-3
    3.3.2    Surface Ownership    3-3


JOHN T. BOYD COMPANY


TABLE OF CONTENTS - Continued


Page

  3.4   Adjacent Properties    3-3
  3.5   Regulation and Liabilities    3-3
  3.6   Accessibility, Local Resources, and Infrastructure    3-4
  3.7   Physiography    3-4
  3.8   Climate    3-5

4.0

  GEOLOGY    4-1
  4.1   Regional Geology    4-1
  4.2   Local Stratigraphy    4-1
    4.2.1    Quaternary Sheet and Dune Sands    4-2
    4.2.2    Ogallala Formation    4-2
  4.3   Frac Sand Geology    4-3

5.0

  EXPLORATION DATA    5-1
  5.1   Background    5-1
  5.2   Exploration Procedures    5-1
    5.2.1    Drilling and Sampling    5-1
    5.2.2    Frac Sand Quality Sampling    5-4
    5.2.3    Other Exploration Methods    5-5
  5.3   Laboratory Testing Results    5-5
    5.3.1    Grain Size Distribution    5-5
    5.3.2    Grain Shape (Sphericity and Roundness)    5-5
    5.3.3    Crush Resistance    5-8
    5.3.4    Acid Solubility    5-8
    5.3.5    Turbidity    5-8
    5.3.6    Quality Summary    5-8
  5.4   Data Verification    5-9

6.0

  FRAC SAND RESOURCES AND RESERVES    6-1
  6.1   Applicable Standards and Definitions    6-1
  6.2   Frac Sand Resources    6-2
    6.2.1    Methodology    6-2
    6.2.2    Classification    6-4
    6.2.3    Frac Sand Resource Estimate    6-4
    6.2.4    Validation    6-4
  6.3   Frac Sand Reserves    6-5
    6.3.1    Methodology    6-5
    6.3.2    Classification    6-5
    6.3.3    Frac Sand Reserve Estimate    6-5


JOHN T. BOYD COMPANY


TABLE OF CONTENTS - Continued


Page

7.0

  MINING OPERATIONS    7-1
  7.1   Mining Method    7-1
  7.2   Mine Schedule, Equipment, and Staffing    7-2
  7.3   Mine Production    7-2
    7.3.1    Historical Mine Production    7-2
    7.3.2    Forecasted Production    7-3
    7.3.3    Expected Mine Life    7-4
    7.3.4    Mining Risk    7-5

8.0

  PROCESSING OPERATIONS    8-1
  8.1   Overview    8-1
  8.2   Wet Process Plant    8-1
  8.3   Dry Process Plant    8-4
  8.4   Storage and Loadout    8-4
  8.5   Future Operations    8-5
  8.6   Conclusion    8-6

9.0

  MINE INFRASTRUCTURE    9-1

10.0

  MARKET ANALYSIS    10-1

11.0

  CAPITAL AND OPERATING COSTS    11-1
  11.1   Introduction    11-1
  11.2   Historical Capital Expenditures    11-1
  11.3   Historical Operating Costs and Revenues    11-3
  11.4   Projected Production, Sales, and Costs    11-4
    11.4.1 Production and Sales Projections    11-4
    11.4.2 Operating Cost Projections    11-5
    11.4.3 Projected Capital Expenditures    11-6

12.0

  ECONOMIC ANALYSIS    12-1
  12.1   Introduction    12-1
  12.2   Cash Flow Analysis    12-2
  12.3   Sensitivity Analysis    12-3
    12.3.1 Pre-Tax Sensitivity Analyses    12-3
    12.3.2 After-Tax Sensitivity Analyses    12-5

13.0

  PERMITTING AND COMPLIANCE    13-1
  13.1   Permitting    13-1
  13.2   Compliance    13-1

14.0

  INTERPRETATION AND CONCLUSIONS    14-1
  14.1   Audit Findings    14-1
  14.2   Significant Risks and Uncertainties    14-1


JOHN T. BOYD COMPANY


TABLE OF CONTENTS - Continued


Page

List of Tables

1.1

       Alpine Silica Kermit Mine Exploration Drilling Campaign Summary    1-4

1.2

       Alpine Silica Kermit Property Reserves    1-5

1.3

       Average ISO/API Test Results by Product Size    1-6

1.4

       Annual CapEx    1-11

1.5

       Annual Cash Cost Projections    1-11

1.6

       Production and Sales Projections    1-12

1.7

       Summary Cash Flow Statement    1-12

1.8

       DCF-NPV    1-12

3.1

       Summary of Mineral and Land Control    3-3

3.2

       2020 Monthly Average Climate Data, Kent, TX    3-5

5.1

       Alpine Silica Kermit Mine Exploration Drilling Campaign Summary    5-3

5.2

       Weighted Average Particle Size Distribution    5-5

5.3

       Kermit Property Average API/Iso Test Results    5-8

6.1

       Kermit Property Drill Hole Spacing Parameters    6-4

6.2

       Reserves as of January 1, 2021    6-7

7.1

       Historic Frac Sand Sales    7-3

7.2

       Forecasted ROM Production Tons    7-3

8.1

       Production and Sales Projections    8-6

11.1

       Annual CapEx    11-1

11.2

       Historical Financials    11-3

11.3

       Production and Sales Projections    11-4

11.4

       Annual Cash Cost Projections    11-5

11.5

       Annual $ per Ton Sold Cash Cost Projections    11-6

12.1

       Summary Cash Flow Statement    12-2

12.2

       DCF-NPV    12-2

12.3

       Sensitivity Analysis – Weighted Average Sales Prices    12-3

12.4

       Pre-Tax DCF-NPV at 10%    12-3

12.5

       Pre-Tax DCF-NPV at 12%    12-4

12.6

       Pre-Tax DCF-NPV at 15%    12-4

12.7

       After-Tax DCF-NPV at 10%    12-5

12.8

       After-Tax DCF-NPV at 12%    12-5

12.9

       After-Tax DCF-NPV at 15%    12-6


JOHN T. BOYD COMPANY


TABLE OF CONTENTS - Continued


Page

List of Figures

1.1

       General Location Map    1-2

1.2

       Permian Basin HZ Permit Submissions vs. Rigs    1-9

1.3

       Permian Oil Production and Natural Gas Production    1-9

1.4

       Permian Wide In-Basin Mine Hours (Quarterly)    1-10

3.1

       Map Showing Frac Sand Explored Mineable Thickness Isopachs    3-2

4.1

       Generalized Stratigraphic Chart, Surficial Deposits of Winkler County, TX    4-2

5.1

       2.5 ft Interval Chip Trays from Various Rotosonic Drill Holes    5-3

5.2

       Map Showing In-Place Frac Sand Isopleths (%) 40/70-mesh Material    5-6

5.3

       Map Showing In-Place Frac Sand Isopleths (%) 70/200-mesh Material    5-7

6.1

       Relationship Between Frac Sand Resources and Frac Sand Reserves    6-2

6.2

       Topographic Map Showing Reserve/Resource Classification    6-6

7.1

       Top Bench of Sand Being Removed by Cat 390 Excavator    7-1

7.2

       Map Showing Proposed Mine Plan    7-4

8.1

       Two 300-tph Wet Process Plants in Parallel    8-2

8.2

       Simplified Wet Process Plant Flow Sheet    8-3

8.3

       Dry Process Plant with Storage Silos    8-4

8.4

       Product Loadout Silos with Scales    8-5

10.1

       WTI Crude Oil CME Futures Price    10-1

10.2

       Permian Basin HZ Permit Submissions vs. Rigs    10-2

10.3

       Permian Oil Production and Natural Gas Production    10-3

10.4

       Permian Drilled but Uncompleted Wells    10-3

10.5

       Permian Wide In-Basin Mine Hours (Quarterly)    10-4

11.1

       Annual and Cumulative CapEx    11-2


JOHN T. BOYD COMPANY


GLOSSARY OF ABBREVIATIONS AND DEFINITIONS


$   

:  US dollar(s)

%   

:  Percent or percentage

Alpine   

:  Alpine Sand, LLC

API   

:  American Petroleum Institute

B&B   

:  Bruce and Bar Ltd

BOYD   

:  John T. Boyd Company

CapEx   

:  Capital expenditures

COGS   

:  Cost of goods sold

Constant Dollar   

:  A monetary measure that is not influenced by inflation and used to compare time periods. Sometimes referred to as “real dollars”.

CY   

:  Cubic yards

DCF   

:  Discounted Cash Flow

Discount Rate   

:  A rate of return used to discount future cash flows based on the return investors expect to receive from their investment.

DUC   

:  Drilled but uncompleted gas or oil well.

FOB   

:  Free-on-Board

Frac Sand   

:  Frac sand is a naturally occurring, high silica content quartz sand, with grains that are generally well rounded and exhibit high compressive strength characteristics relative to other silica sand. It is utilized as a prop or “proppant” in unconventional shale frac well completions.

Frac Sand Resource   

:  Frac sand resource is a concentration or occurrence of sand material of economic interest in or on the Earth’s crust in such form, grade or quality, and quantity that there are reasonable prospects for economic extraction. A mineral resource is a reasonable estimate of mineralization, taking into account relevant factors such as quality specifications, likely mining dimensions, location or continuity, that, with the assumed and justifiable technical and economic conditions, is likely to, in whole or in part, become economically extractable. It is not merely an inventory of all mineralization drilled or sampled.


JOHN T. BOYD COMPANY

1


GLOSSARY OF ABBREVIATIONS AND DEFINITIONS - Continued


Frac Sand Reserve   

:  Frac sand reserve is an estimate of tonnage and grade or quality of mineral resources that, in the opinion of the qualified person, can be the basis of an economically viable project. More specifically, it is the economically mineable part of a mineral resource, which includes diluting materials and allowances for losses that may occur when the material is mined or extracted.

Indicated Sand Resource   

:  An Indicated Sand Resource is that part of a Sand Resource for which quantity, grade or quality, densities, shape, and physical characteristics are estimated with sufficient confidence to allow the application of Modifying Factors in sufficient detail to support mine planning and evaluation of the economic viability of the deposit. Geological evidence is derived from adequately detailed and reliable exploration, sampling and testing, and is sufficient to assume geological and grade or quality continuity between points of observation. An Indicated Sand Resource has a lower level of confidence than that applying to a Measured Sand Resource and may only be converted to a Probable Sand Reserve.

IRR   

:  Internal rate-of-return

ISO   

:  International Organization for Standardization

lb   

:  Pound

LOM   

:  Life-of-Mine

Measured Sand Resource   

:  A Measured Sand Resource is that part of a Sand Resource for which quantity, grade or quality, densities, shape, and physical characteristics are estimated with confidence sufficient to allow the application of Modifying Factors to support detailed mine planning and final evaluation of the economic viability of the deposit. Geological evidence is derived from detailed and reliable exploration, sampling, and testing and is sufficient to confirm geological and grade or quality continuity between points of observation. A Measured Sand Resource has a higher level of confidence than that applying to either an Indicated Sand Resource or an Inferred Sand Resource. It may be converted to a Proven Sand Reserve or to a Probable Sand Reserve.

Mesh   

:  A measurement of particle size often used in determining the size distribution of granular material.

Mineral Reserve   

:  See “Frac Sand Reserve”

Mineral Resource   

:  See “Frac Sand Resource”

Modifying Factors   

:  The factors that a qualified person must apply to indicated and measured sand resources and then evaluate to establish the economic viability of sand reserves. A qualified person must apply and evaluate modifying factors to convert measured and indicated resources to proven and probable reserves. These factors include,


JOHN T. BOYD COMPANY


2


GLOSSARY OF ABBREVIATIONS AND DEFINITIONS - Continued


but are not restricted to: mining; processing; metallurgical; infrastructure; economic; marketing; legal; environmental compliance; plans, negotiations, or agreements with local individuals or groups; and governmental factors. The number, type and specific characteristics of the modifying factors applied will necessarily be a function of and depend upon the mineral, mine, property, or project.

MSHA   

:  Mine Safety and Health Administration. A division of the U.S. Department of Labor.

NOAA   

:  National Oceanic and Atmospheric Administration

NSR   

:  New Source Review

NTU   

:  Nephelometric turbidity units

NPV   

:  Net Present Value

Permian Basin   

:  A large sedimentary shale basin in the southwestern part of the United States in mainly Texas and New Mexico. The basin produces approximately 4 million barrels per day of oil and holds some of the largest oil and gas reserves in the world.

Probable Sand Reserve   

:  A Probable Sand Reserve is the economically mineable part of an Indicated and, in some circumstances, a Measured Sand Resource. The confidence in the Modifying Factors applying to a Probable Sand Reserve is lower than that applying to a Proven Sand Reserve.

Proppant Sand   

:  See “Frac Sand”

Proven Sand Reserve   

:  A Proven Mineral Reserve is the economically mineable part of a Measured Sand Resource. A Proven Sand Reserve implies a high degree of confidence in the Modifying Factors.

PSI   

:  Pounds per square inch

ROM   

:  Run-of-Mine. The as-mined including in-seam clay partings mired with the sand, and out-of-seam dilution.

Rotosonic Drilling   

:  A type of core drilling combining rotary drilling with ultrasonic frequency to drill through loosely consolidated soil and rock.

SEC   

:  U.S. Securities and Exchange Commission

S-K 1300   

:  Subpart 1300 and Item 601(b)(96) of the U.S. Securities and Exchange Commission’s Regulation S-K


JOHN T. BOYD COMPANY


3


GLOSSARY OF ABBREVIATIONS AND DEFINITIONS - Continued


Surficial   

:  Relating to the earths surface or the geology that is on the surface.

TDEQ   

:  Texas Commission on Environmental Quality

Ton   

:  Short Ton. A unit of weight equal to 2,000 pounds

tph   

:  Tons per Hour

WTI   

:  West Texas Intermediate


JOHN T. BOYD COMPANY


4


1.0 EXECUTIVE SUMMARY

1.1 Introduction

BOYD was retained by Alpine to complete an independent technical audit of mineral resource and mineral reserve estimates—hereafter referred to as frac sand resource and frac sand reserve estimates—for their active mining operation located in Kermit, Texas (the “Kermit Mine”). This report summarizes the results of our audit and satisfies the requirements for Alpine’s disclosure of frac sand resources and reserves set forth in Subpart 1300 and Item 601(b)(96) of the SEC’s Regulation S-K (S-K 1300). This is the first technical report summary filed by Alpine for the Kermit Mine.

BOYD’s findings are based on our detailed examination of the supporting geologic, technical, and economic information obtained from: (1) Alpine’s provided files, (2) discussions with Alpine personnel, (3) records on file with regulatory agencies, (4) public sources, and (5) nonconfidential BOYD files. Our investigation was performed to obtain reasonable assurance that Alpine’s frac sand resource and reserve statements are free from material misstatement. This report provides an independent estimate of the frac sand resources and reserves underlying the Kermit, Texas properties The basis for these estimates is BOYD’s previous technical report (BOYD Report No. 3976.000) issued in August 2021.

This chapter provides a summary of primary information contained within this technical report summary and is supported by remaining portions of this report including text, figures, and tables. Weights and measurements are expressed in US customary units. Unless noted, the effective date of the information, including estimates of frac sand reserves, is January 1, 2021.

1.2 Property Description

Alpine’s Kermit Mine is a surface mining operation located in Winkler County, Texas. Frac sand is extracted from surficial sheet and dune sand deposits that have accumulated in the area. Alpine controls approximately 1,271 contiguous acres of mining rights, by ownership or lease, immediately around their Kermit frac sand operation. The general location of this property (the “Kermit Property”) is provided in Figure 1.1, following this page.


JOHN T. BOYD COMPANY

1-1


LOGO


1-2


Extensive mining of the surficial sheet and dune sand deposits has been conducted in recent years in the western Texas area. The first “in-basin” frac sand mine within the Permian Basin began mining operations in August 2017. Alpine commenced mining operations and production at their Kermit Mine shortly thereafter in September 2017.

1.3 Geology

The Kermit Mine is located in an area of west Texas where the High Plains and Trans-Pecos desert regions converge. Surficial features of the High Plains region typically consist of thin clay and soil intervals covering caliche, with mesquite, juniper, and scrub grass cover. The Trans-Pecos region has numerous landform types ranging from the rising slopes of the Guadalupe Mountain Range to the desert dune deposits of the Sand Hills areas. Surficial geologic units overlying the area are predominantly Quaternary age unconsolidated deposits, ranging from windblown sheet sands and dunes to unconsolidated alluvial deposition of sands, silts, clays, and caliche. The Caprock Escarpment marks the eastern-most extent of the surficial sand deposits. Winds transporting particles into the area are thought to have collided with the escarpment, slowing and dropping particles out which accumulated over time. Winnowing processes further caused some degree of particle sorting to occur. Due to the mechanisms and long distances of particle transport, sand grains were abraded and well rounded off as they reached their current locations.

Alpine’s Kermit Property contains no discernable overburden (i.e., overlying waste) materials, with the exception of sparse areas of vegetation and roots, which are easily removed during processing. Quaternary unconsolidated deposition covers nearly all of the subject property, with the surficial deposits noted as generally ranging from 60-ft to over 300-ft in thickness. The surface sheet and dune sands here are generally mineable from the surface to the total defined depths of the deposit. As the target formation is located on or at the surface, there are no geologic features which would materially impact mineability of the sands.

Frac sand is a naturally occurring, high silica content quartz sand, with grains that are generally well rounded. The main difference between frac sand and other types of sands is that the individual grains comprising frac sands are relatively pure in composition, consisting almost entirely of quartz; other sands have numerous impurities that may be cemented to the quartz grains. The pure quartz composition of frac sand grains, along with being well rounded and spherical in shape, gives these sands the characteristics (crush strength, high acid solubility, low turbidity) that are sought after by oil and gas producers for use in developing wells. The relatively uniform nature of the sand deposit underlying Alpine’s Kermit Property, combined with laboratory testing results, indicate that this operation will produce a high-quality split of 40/70-mesh and 100-mesh proppant sand products that meet the customer specifications for regional proppant sand within the Permian Basin.


JOHN T. BOYD COMPANY

1-3


1.4 Exploration

In developing the subject property, Alpine completed two geologic exploration campaigns in 2017 and 2019. Records for 35 holes completed during these campaigns comprise the primary data used in the evaluation of the frac sand resources. Of the 35 holes, 27 were utilized for frac resource estimation. Eight of the drill holes were twinned as to verify the results of the earlier drilling campaign. A summary of the drill holes follows:

Table 1.1: Alpine Silica Kermit Mine Exploration Drilling Campaign Summary


     Drill Hole Type         

Year

   Rotosonic      Rotary      Geo-Probe      Total  

2017

     —          4        20        24  

2019

     11        —          —          11  


Total

     11        4        20        35  

The sampling methodology for both exploration programs generally consisted of collecting composite samples of the recovered core along the entire length of the drill run. Sometimes a run was broken into smaller intervals to be analyzed (i.e., rotosonic drilling was completed on 10 ft runs, with 2.5 ft composite samples). Gathered sample material was placed into plastic sampling bags, clearly labeled with drill hole name, top depth, and bottom depth of each sample, and secured closed with zip ties. Core photos of the sampled intervals were not provided to BOYD, however archival sample splits for each drill hole are kept in secure storage on the Kermit Property and were made available for inspection to BOYD during our site visit.

BOYD’s review of the reported sampling methodology and procedures indicate the exploration data obtained by Alpine for the Kermit Property were carefully and professionally collected, prepared, and documented, in conformance with generally accepted industry standards, and are appropriate for use of evaluating and estimating frac sand resources and reserves.


JOHN T. BOYD COMPANY

1-4


1.5 Frac Sand Reserves

This technical report summary provides an estimate of frac sand reserves for Alpine’s Kermit Mine in accordance with the requirements set forth in S-K 1300. These estimates were independently prepared by BOYD and previously issued to Alpine in August 2021 (BOYD Report No. 3976.000). The August 2021 report includes a thorough geologic investigation of the property, appropriate modeling of the deposit, development of life-of-mine (LOM) plans, and consideration of the relevant processing, economic (including independent estimates of capital, revenue, and cost), marketing, legal, environmental, socio-economic, and regulatory factors.

BOYD’s estimate of frac sand reserves for the Kermit Mine as of January 1, 2021, are 49.5 million saleable product (i.e., greater than 200-mesh and less than 40-mesh in size) tons.

The following table presents the estimated frac sand reserves by product mesh size, reserve classification, and mineral ownership status for the Kermit Mine:

Table 1.2: Alpine Silica Kermit Property Reserves (as of January 1, 2021)


     Tons (000) By Classification and Mesh Size      Total         
     Proven      Probable      By Mesh Size      Grand  

Control

   40/70      70/200      Total      40/70      70/200      Total      40/70      70/200      Total  

Owned

     13,163        15,862        29,025        384        512        896        13,547        16,374        29,921  

Leased

     6,456        6,831        13,287        3,073        3,215        6,288        9,529        10,046        19,575  


Total

     19,619        22,693        42,312        3,457        3,727        7,184        23,076        26,420        49,496  

It is BOYD’s opinion that extraction of the reported frac sand reserves is technically achievable and economically viable after the consideration of potentially material modifying factors.

Projecting the historic sales volume of between 1.0 million tons per year and 1.2 million tons per year, the operation has an expected LOM of between 41 and 50 years.

API/ISO testing was performed by two separate third-party laboratories—PropTester and Stim-Lab—on select composite samples representing the total mineable interval. Alpine also conducted in-house crush testing on samples obtained from their plant feed stream. Analytical results from the independent laboratories were generally similar, while Alpine’s internal laboratory’s crush strength results were approximately 1,000 psi lower than those reported by each third-party laboratory. Testing was performed on various product (mesh) sizes; however, for purposes of this report only the 40/70-mesh and 100-mesh results are included. Average sample results are summarized in the following table for each product size analyzed from the Kermit Mine:


JOHN T. BOYD COMPANY

1-5


Table 1.3: Average ISO/API Test Results by Product Size


     40/70-mesh      70/140-mesh*  

Test

   Result      Recommended
Specification
     Result  

Sphericity

     0.7        > 0.6        0.7  

Roundness

     0.6        > 0.6        0.6  

Acid Solubility (%)

     2.7        < 3.0        3.4  

Turbidity (NTU)

     n/a        < 250        n/a  

K-Value (000 psi)

     7        —          10  


*

100-mesh proppant sand material currently does not have an ISO/API specification.

The composited samples from Kermit Mine meet minimum API/ISO recommended testing characteristics (where applicable) for the specified product sizes.

1.6 Operations

1.6.1 Mining

Once any overburden material has been stripped (if required), a Caterpillar 390 excavator is used to remove the top or upper 15 ft bench of reddish colored sand. Typically, three 45-ton articulated trucks are utilized to haul the excavated sand to the wet plant feed hopper, where it is fed through a grizzly hopper/feeder to remove any remaining vegetation or lumpy material. Once the upper bench of sand is removed, the lower bench of white-colored sand can be excavated. Thickness of the lower bench averages 16 ft, but can reach 20 ft. The overall mining thickness is generally 31 ft, up to 35 ft. The upper bench is removed well in advance of the second (lower) bench. The second bench is more cohesive, with a higher clay and moisture content, and is allowed to drain/dry before excavating to improve handling and minimize “balling” of the material. A conceptual mine plan with sequencing is illustrated in Chapter 7 of this report.

The quarry operates 7 days per week and 12 hours per day. There are five hourly personnel involved in excavating the sand. The quarry generally excavates 7,500 tons per 12-hour day or 625 tons per hour (tph).


JOHN T. BOYD COMPANY

1-6


1.6.2 Processing

The Alpine process plant has three major process components which are typical in the frac sand industry. These components include:


Wet Process Plant- The greater than 40-mesh and less than 200-mesh sand and silt material is removed from the run-of-mine (ROM) material excavated from the quarry.


Dry Process Plant- The wet 40 x 200-mesh material produced by the wet process plant is dried and screened (sized) into finished products.


Storage and Loadout- Finished products are stored in silos and gravity loaded from under the silos into highway trucks for transport to the customer.

The wet process plant has a nameplate capacity of 600 tph and currently averages 500 tph of ROM sand feed. The plant is essentially two 300-tph parallel wash circuits which are similar. The plant does not crush the material, but predominantly scrubs (i.e., washes) and classifies (i.e., sizes) the sand. Basically, a screen removes the large plus 40-mesh size and cyclones deslime and remove the minus 200-mesh material. Attrition scrubbers clean the sand and dewatering screens remove excess moisture. The resultant 40 x 200-mesh material is stockpiled as feed for the dry plant. The wet process plant has a closed loop process water circuit that allows for efficient use of water, the majority of which is collected and recycled in the process. Water conservation is a high priority at the operation. The wet process plant operates 7 days per week, 24 hours per day.

The dry process plant consists of two Louisville rotary dryers, each rated at approximately 200 tph at 4% to 6% moisture sand feed. The dry classification will take place in the screening building where Rotex dry screens will classify the material into predominantly two product size fractions consisting of:


40/70-mesh.


70/200-mesh (commonly referred to as “100-mesh”).

Following the classification of the sand into either 40/70-mesh or 70/200-mesh product, the resulting product is stored in one of eight product storage silos. Each silo has a capacity of 3,000 tons for a total combined product storage of 24,000 tons at the plant site. There are six truck drive under-silo loadout lanes, equipped with scales, at the plant which operate 24/7 throughout the year.


JOHN T. BOYD COMPANY

1-7


1.6.3 Infrastructure

The Kermit Mine is serviced by three phase power that is routed along Farm-to-Market Road (FM) 1218, which runs parallel to the western property line. The pipeline providing natural gas supply for the dryers is also routed along this corridor. Plant process water is supplied by 12 wells installed around the periphery of the property. Additionally, water is recycled from the wash process water after fines are removed via settling with a flocculent in a series of constructed ponds. As the mine progresses, silt ponds are constructed in mined-out pits. Wastewater disposal from offices and other buildings are collected via holding tanks and serviced on a regular basis. Potable water is provided by off-site sources (bottled water), although a public water system permit application has been filed.

On-site facilities include a scale house, office, shop, camp, and a quality laboratory located in the dry process plant. The operation employs approximately 52 people and staffing varies based on production demand. Seven of the 52 positions are salaried employees. Approximately 50% of the workforce resides on-site in either trailers or company-supplied modular housing. The camp can accommodate approximately 40 people.


JOHN T. BOYD COMPANY

1-8


1.7 Financial Analysis

1.7.1 Market Analysis

Permit submissions for horizontal oil and gas wells in the Permian Basin indicate a continuation of strong drilling ahead. According to InfillThinking, the number of permits filed per working rig this summer is tracking at multi-year highs as evidenced in the chart below.


LOGO

Over the previous 52 weeks, rig counts in the Permian Basin are up approximately 111%. This has led to increased production for both crude oil and natural gas. Over the same time-period, crude oil production (barrels per day) and natural gas production (thousand cubic feet per day) in the Permian Basin are up 10% and 9%, respectively. Permian Basin daily crude oil production is nearing its pre-pandemic impacted peak, while daily natural gas production in the basin continues to make new records and now stands at 18.6 billion cubic feet per day.


LOGO


JOHN T. BOYD COMPANY

1-9


Consequently, with increases in production and well completions, activity at frac sand mines in the region have increased. Per the Mine Safety and Health Administration (MSHA), operating hours for the second quarter of 2021 for Permian Basin frac sand mines were up 20% sequentially. In fact, only two mines saw a material decrease in operating hours from Q1 2021 to Q2 2021 while several had increases of more than 80% sequentially.


LOGO

According to Lium LLC, all but one frac sand mine in the Permian Basin is currently fully operational. However, total in-basin mine operating hours are still about 45% below their historical peak. Generally, mine operating hours correlated well with crude oil and natural gas production and drilling and uncompleted (DUC) well data. Current frac sand production in the Permian Basin is estimated to be nearing prior peak production of about 70 million leading to stable pricing in the basin. BOYD anticipates stable frac sand pricing with a slight upside bias due to potential supply chain disruptions and high commodity input costs.


JOHN T. BOYD COMPANY

1-10


1.7.2 Capital and Operating Costs

BOYD estimated capital expenditures (CapEx) for the period pre-2018 to 2020, based on changes to fixed asset accounts presented on the balance sheets and cash flow statements provided for our review. Table 1.4 presents the annual capital expenditures, based on the financial statements, from startup of operations pre-2018 through 2020.

Table 1.4: Annual CapEx


CapEx ($000)


Pre-2018

     60,420  

Year 2018

     27,778  

Year 2019

     9,250  

Year 2020

     34  


Total

     97,482  

Approximately 90% of the cumulative CapEx was incurred by the end of 2018, as would be expected for a start-up frac sand operation. BOYD has estimated $1.50 per sales ton sustaining capital on an ongoing basis.

Based on three years of historical financial information, BOYD has projected future operating costs as follows:

Table 1.5: Annual Cash Cost Projections


     Year 2021      Year 2022      Year 2023      Year 2024      Year 2025  

Summary Cash Cost of Goods Sold ($ per ton sold):


Cash Operating Costs:


Employee Wages and Benefits

     4.15        4.15        4.15        4.15        4.15  

Repairs and Maintenance

     0.72        0.72        0.72        0.72        0.72  

Utilities and Propane/Gas

     1.69        1.69        1.69        1.69        1.69  

Fuel (Diesel and Gasoline)

     0.46        0.46        0.46        0.46        0.46  

Lease and Equipment Rental

     0.10        0.10        0.10        0.10        0.10  

Other Operating

     2.59        2.59        2.59        2.59        2.59  


Subtotal Cash Operating Expense

     9.71        9.71        9.71        9.71        9.71  

SG&A

     1.82        1.82        1.82        1.82        1.82  

Bruce and Bar Ltd. Lease Expense

     —          —          —          —          —    

Final Reclamation Escrow

     0.10        0.10        0.10        0.10        0.10  


Total Cash Cost of Goods Sold

     11.63        11.63        11.63        11.63        11.63  


JOHN T. BOYD COMPANY

1-11


1.7.3 Production and Sales

Table 1.6 presents BOYD’s production and sales projections for the period 2021 through 2025. The sales price forecast is constant dollar, by product, and is based on current second quarter average prices, and reflects a rebound from 2020 prices. We opine that these are reasonable price projections.

Table 1.6: Production and Sales Projections


     Year 2021      Year 2022      Year 2023      Year 2024      Year 2025  

ROM Production (000)

     1,461        1,461        1,461        1,461        1,461  

Processing Recovery (%)

     82.1        82.1        82.1        82.1        82.1  

Dry Plant Product (000)

     1,200        1,200        1,200        1,200        1,200  

Tons Sold (000)

     1,200        1,200        1,200        1,200        1,200  

40/70-Mesh

     559        559        559        559        559  

100-Mesh

     641        641        641        641        641  

Revenues ($000)

     22,936        22,936        22,936        22,936        22,936  

Product Pricing ($ per ton sold)


Weighted Average Price

     19.11        19.11        19.11        19.11        19.11  

40/70-Mesh

     21.25        21.25        21.25        21.25        21.25  

100-Mesh

     17.25        17.25        17.25        17.25        17.25  

1.7.4 Economic Analysis

BOYD independently evaluated the economics of the Kermit Mine over the forecasted life of the project. The results of our indicative economic analysis for the 49-year period (2021 to 2070) shows a pre-tax net present value (NPV) of $62.5 million and a post-tax NPV of $56 million for the expected case at a 12% discount rate. Table 1.7 summarizes the LOM cash flows and Table 1.8 illustrates discount rate sensitivity.

Table 1.7: Summary Cash Flow Statement


     Summary Cash Flow Statement ($ 000; unless otherwise noted)  
Rounding Errors    2021
to 2030
     2031
to 2040
     2041
to 2050
     2051
to 2060
     2061
to 2070
     Total  

Total Tons Sold (000)

     12,000        12,000        12,000        12,000        1,496        49,496  

Revenues

     229,360        229,360        229,360        229,360        28,594        946,034  

COGS

     139,612        139,612        141,940        144,198        21,646        587,008  

CapEx

     18,000        18,000        18,000        18,000        900        72,900  


Net Pre-Tax Cash Flow

     71,748        71,748        69,420        67,162        6,048        286,126  

Federal Income and State Franchise Taxes

     4,468        16,434        16,079        15,824        1,644        54,450  


After-Tax Net Cash Flow

     67,280        55,314        53,342        51,337        4,404        231,676  

Table 1.8: DCF-NPV


     DCF-NPV ($ 000)  
     10%      12%      15%  

Pre-Tax

     73,377        62,462        51,036  

After-Tax

     64,851        55,941        46,472  


JOHN T. BOYD COMPANY

1-12


The NPV estimate was made for purposes of confirming the economic viability of the reported frac sand reserves and not for purposes of valuing Alpine or its assets. Internal rate-of-return (IRR) and project payback were not calculated, as there was no initial investment considered in the financial model.

1.8 Regulation and Liabilities

The Kermit Mine is predominantly regulated by the Texas Commission on Environmental Quality (TDEQ) for environmental compliance. The predominant permitting requirement is an active New Source Review (NSR) permit for air pollution control. The Kermit Mine’s current NSR permit is renewable in 2028. Other permits held for the Kermit Mine include: Stormwater, Above Ground Storage Tank, Aggregate Production Operation, and a Public Water System application (pending). There are no formal state or federal reclamation plans or permits required for the operation.

Although the property is not considered a high-quality habitat, Alpine has voluntarily enrolled those portions of the property for which it owns the surface rights in the Candidate Conservation Agreement with Assurances for the Dune Sagebrush Lizard.

1.9 Conclusions

It is BOYD’s overall conclusion, that Alpine’s frac sand reserves, as reported herein: (1) were prepared in conformance with accepted industry standards and practices, and (2) are reasonably and appropriately supported by technical evaluations, which consider all relevant modifying factors. We do not believe there is other relevant data or information material to the Kermit Property that would render this technical report summary misleading. Our conclusions represent only informed professional judgment.

Given the operating history and actual performance of Alpine through the COVID-19 pandemic and volatile energy market conditions, we consider the going concern to be viable under the current and foreseeable operating environment. A general assessment of risk is presented in the relevant sections of this report.

The ability of Alpine, or any mine operator, to recover all of the reported frac sand reserves is dependent on numerous factors that are beyond the control of, and cannot be anticipated by, BOYD. These factors include mining and geologic conditions, the capabilities of management and employees, the securing of required approvals and permits in a timely manner, future sand prices, etc. Unforeseen changes in regulations could also impact performance. Opinions presented in this report apply to the site conditions and features as they existed at the time of BOYD’s investigations and those reasonably foreseeable.


JOHN T. BOYD COMPANY

1-13


2.0 INTRODUCTION

2.1 Registrant and Purpose

This technical report summary was prepared for Alpine in support of their disclosure of frac sand reserves for the Kermit Mine in accordance with S-K 1300 Regulations.

Alpine is a private, US-based mining company headquartered in Kermit, Texas. Alpine commenced operations at the Kermit Mine in 2017 and provides in-basin frac sand to the surrounding energy drilling market. All of Alpine’s products are trucked to the surrounding New Mexico and Texas energy markets. Alpine’s website is found at www.alpinesilica.com.

2.2 Terms of Reference

Alpine retained BOYD to complete an independent technical report which was issued in August 2021 (BOYD Report No. 3976.000). Subsequently, Alpine retained BOYD to prepare a SEC-compliant technical report summary to support their disclosure of frac sand reserves following S-K 1300 requirements. Our objective was to incorporate the results of the existing technical report along with additional information that we reviewed into a compliant technical report summary.

The results of our review, presented in report form herein, were prepared in accordance with the disclosure requirements set forth in Subpart 1300 and Item 601(b)(96) of the SEC’s Regulation S-K. The purpose of this report is threefold: (1) to summarize available information for the subject mining property, (2) to provide the conclusions of our technical audit, and (3) to provide a statement of frac sand resources and reserves for the Kermit Mine. This is the first technical report summary filed by Alpine for the Kermit Mine.

BOYD’s findings are based on our detailed examination of the supporting geologic, technical, and economic information provided by Alpine in formulating the estimates of frac sand resources and reserves disclosed in this report. We independently estimated the frac sand resources and reserves from first principles based on third-party exploration information provided to BOYD.


JOHN T. BOYD COMPANY

2-1


We used standard engineering and geoscience methods, or a combination of methods, that we considered to be appropriate and necessary to establish the conclusions set forth herein. As in all aspects of mining property evaluation, there are uncertainties inherent in the interpretation of engineering and geoscience data; therefore, our conclusions necessarily represent only informed professional judgment.

The ability of Alpine, or any mine operator, to recover all of the estimated frac sand reserves presented in this report is dependent on numerous factors that are beyond the control of, and cannot be anticipated by, BOYD. These factors include mining and geologic conditions, the capabilities of management and employees, the securing of required approvals and permits in a timely manner, future sand prices, etc. Unforeseen changes in regulations could also impact performance. Opinions presented in this report apply to the site conditions and features as they existed at the time of BOYD’s investigations and those reasonably foreseeable.

This report is intended for use by Alpine subject to the terms and conditions of its engagement agreement with BOYD. The agreement permits Alpine to file this report as a technical report summary with the SEC pursuant to Subpart 1300 and Item 601(b)(96) of Regulation S-K. Except for the purposes legislated under US securities law, any other uses of or reliance on this report by any third party is at that party’s sole risk. The responsibility for this disclosure remains with Alpine. The user of this document should ensure that this is the most recent disclosure of frac sand resources and reserves for the Kermit Mine as it is no longer valid if more recent estimates have been issued.

2.3 Expert Qualifications

BOYD is an independent consulting firm specializing in mining-related engineering and financial consulting services. Since 1943, BOYD has completed over 4,000 projects in the United States and more than 90 other countries. Our full-time staff comprises mining experts in: civil, environmental, geotechnical, and mining engineering; geology; mineral economics; and market analysis. Our extensive experience in frac sand resources/reserve estimation and our knowledge of the subject property, provides BOYD an informed basis on which to opine on the frac sand reserves available at the Kermit Mine. An overview of BOYD can be found on our website at www.jtboyd.com.

The individuals primarily responsible for this audit and the preparation of this report are by virtue of their education, experience, and professional association considered qualified persons as defined in Subpart 1300 of Regulation S-K.


JOHN T. BOYD COMPANY

2-2


Neither BOYD nor its staff employed in the preparation of this report have any beneficial interest in Alpine, and are not insiders, associates, or affiliates of Alpine. The results of our resource/reserve estimate and subsequent audit were not dependent upon any prior agreements concerning the conclusions to be reached, nor were there any undisclosed understandings concerning any future business dealings between Alpine and BOYD. This report was prepared in return for fees based upon agreed commercial rates, and the payment for our services was not contingent upon our opinions regarding the project or approval of our work by Alpine and its representatives.

2.4 Principal Sources of Information

Information used in this assignment was obtained from: (1) Alpine files, (2) discussions with Alpine personnel, (3) records on file with regulatory agencies, (4) public sources, and (5) nonconfidential BOYD files. The basis for this report is the previously compiled BOYD technical report (BOYD Report No. 3976.000 issued in August 2021) which provided an independent estimate of frac sand reserves for the Kermit Mine as of December 31,2020.

Additional information was provided by Alpine including:


Financial forecasting models.


Historical information, including:


Production reports and reconciliation statements.


Financial statements.


Product sales and pricing.

The data and work papers used in the preparation of this report are on file in our offices.

2.4.1 Site Visits

A personal inspection of the Alpine operation was made by two of BOYD’s senior geology and mining staff—both qualified persons and co-authors of this report—on July 22, 2021. The site visit included: (1) observation of the active mining operations, (2) a tour of the mine site’s surface infrastructure, and (3) a tour of the process plant and truck loadouts. BOYD’s representatives were accompanied by Alpine’s General Manager who openly and cooperatively answered questions regarding, but not limited to: site geology, mining conditions and operations, equipment usage, labor relations, operating and capital costs, current and proposed processing operations, and frac sand marketing.


JOHN T. BOYD COMPANY

2-3


2.4.2 Reliance on Information Provided by the Registrant

In the preparation of this report we have relied, without independent verification, upon information furnished by Alpine with respect to: property interests; exploration results; current and historical production from such properties; current and historical costs of operation and production; and agreements relating to current and future operations and sale of production.

BOYD exercised due care in reviewing the information provided by Alpine within the scope of our expertise and experience (which is in technical and financial mining issues) and concluded the data are valid and appropriate considering the status of the subject property and the purpose for which this report was prepared. BOYD is not qualified to provide findings of a legal or accounting nature. We have no reason to believe that any material facts have been withheld, or that further analysis may reveal additional material information. However, the accuracy of the results and conclusions of this report are reliant on the accuracy of the information provided by Alpine.

While we are not responsible for any material omissions in the information provided for use in this report, we do not disclaim responsibility for the disclosure of information contained herein which is within the realm of our expertise.

2.5 Effective Date

The frac sand reserves presented in this technical report summary are effective as of January 1, 2021. The report effective date is January 1, 2021.

2.6 Units of Measure

The US customary measurement system has been used throughout this report. Tons are dry short tons of 2,000 pounds-mass. Unless otherwise stated, all currency is expressed in constant 2020 US Dollars ($).


JOHN T. BOYD COMPANY

2-4


3.0 PROPERTY OVERVIEW

3.1 Description and Location

Alpine’s Kermit Mine is a surface frac sand mining operation, located on a contiguous block of mineral rights (the “Kermit Property”) controlled by Alpine, in Winkler County, Texas. The subject property is located approximately 14 miles north of the town of Kermit, on FM 1218, and approximately 58 miles west of the Midland-Odessa area. The Texas-New Mexico border forms the western boundary of the property.

Geographically, the Kermit Mine frac sand processing plant is located at approximately 32° 3’ 20.55” N latitude and 103° 2’ 56.96” W longitude. Figures 1.1 and 3.1 illustrate the location and general layout of the Kermit Property and Mine.

3.2 History

Extensive surface mining of frac sand has been conducted in the West Texas region since the first “in-basin” mine began selling frac sand into the Permian Basin oil and gas industry, in August 2017. Since then, numerous frac sand mines have been opened in the area, generally to the southeast of Alpine’s Kermit Mine.

In September 2017, Alpine received a MSHA identification number for the Kermit Mine, at which time construction of the wet and dry frac sand processing plants, storage silos, and truck loadouts began. Alpine’s first frac sand production occurred in November 2017.

3.3 Property Control

The Kermit Property comprises approximately 1,271 acres of mineral and/or surface rights controlled by Alpine. Mineral rights for the subject property are held through a combination of 641 acres owned in fee, and 630 acres of leased property. The leased property agreement, held between Alpine and Bruce and Barr Ltd. (BBL), is valid until the year 2052 with a stipulated production start deadline of January 1, 2032, and a royalty rate of 2% of gross sales revenue. Ownership data including maps, deeds, lease agreements, and royalty rates furnished to us have been accepted as being true and accurate for the purpose of this report.


JOHN T. BOYD COMPANY

3-1


LOGO


3-2


3.3.1 Mineral Ownership

Alpine maintains mineral rights to the entire subject property. The estimated mineable area is approximately 1,096 acres, or 86% of the total property, after observing setbacks, right of ways, processing areas, end wall pit slope angles of 3:1, and other non-mining acreage. Reportedly, Alpine holds an option with BBL to expand the mineral rights areas by leasing 650 or more acres located directly north of the current leases. A summary of currently controlled acres and mineable mineral acres is shown in Table 3.1 below.

Table 3.1: Summary of Mineral and Land Control


     All Tracts      Mineable Area  
     Acres      %      Acres      %  

Owned

     641        50.4        503        45.9  

Leased

     630        49.6        593        54.1  


Total

     1,271        100.0        1,096        100.0  

3.3.2 Surface Ownership

Alpine purchased the currently controlled 641 acres from BBL in 2017. This property contains the Kermit Mine’s processing facilities, offices, and the currently active mining area.

3.4 Adjacent Properties

As illustrated in Figure 3.1, the region has seen extensive mining of the surficial sand deposits for purposes of producing frac sand. All currently existing frac sand mining operations are generally located to the southeast of the Kermit Mine. By virtue of the Kermit Mine’s location, Alpine maintains a position as being the nearest operating frac sand producer to the neighboring New Mexico oil and gas fields.

3.5 Regulation and Liabilities

Mining and related activities for the Alpine operation are predominantly regulated by the Texas Commission on Environmental Quality. The Kermit Mine’s current New Source Review air pollution control permit is renewable in 2028. Other permits include: Stormwater, Above Ground Storage Tank, Aggregate Production Operation, and a Public Water System application (pending).


JOHN T. BOYD COMPANY

3-3


Although the property is not considered high-quality habitat, Alpine has also voluntarily enrolled its owned surface rights in the Candidate Conservation Agreement with Assurances for the Dune Sagebrush Lizard.

3.6 Accessibility, Local Resources, and Infrastructure

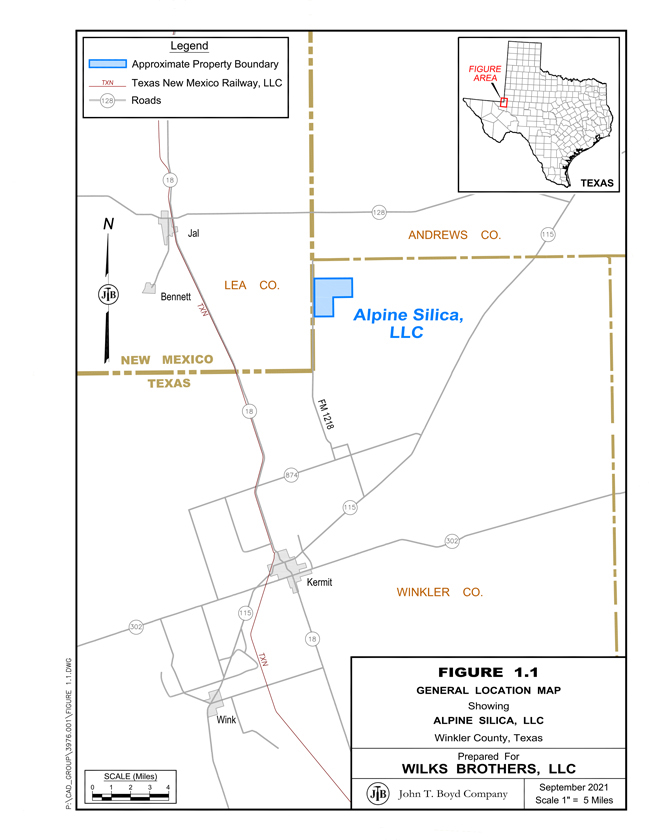
Alpine’s Kermit Mine is located near a handful of small rural towns in western Texas and southeastern New Mexico. The surrounding region has a well-established history of oil and gas production, being located within the center of the Permian Basin. The surrounding counties have a combined population of over 200,000 people, according to 2020 population estimates by the Texas Demographic Center.

General access to the Kermit Mine is via a well-developed network of primary and secondary roads serviced by state and local governments. These roads offer direct access to the mine and processing facilities and are generally open year-round. Primary vehicular access to the property is via FM 1218, running north-south, following the Texas-New Mexico border. Various state highways (302, 115, 18, 128) surround the subject property, and provide primary access to various portions of the oil and gas fields.

Several regional airports are located between 10 to 35 miles of the Kermit Property.

Sources of three phase electrical power, natural gas, and other miscellaneous materials are readily available. Water is currently supplied by a series of 12 wells installed around the periphery of the property, and by recycling wash process water from on-site ponds; a public water system permit application has been filed for the subject property.

3.7 Physiography

The Kermit Mine lies within the Texas Great Plains physiographic province, a region encompassing much of north-western and western Texas. The surrounding areas generally consist of desert valleys covered with windblown sheet and dune sands, high plains covered with thick alluvium (the Llano Estacado or Staked Plains), or plateaus consisting of thin carbonate-based soils (the Caprock Escarpment). The plateau areas, typically covered by a weathering-resistant caliche (a hardened natural cement of calcium carbonate that binds other materials—such as gravel, sand, clay, and silt), may abruptly stand up to 1,000 ft above the plains. Much of the region may be covered by various types of desert scrub grasses, sages, yuccas, junipers, shin oaks, and mesquites.


JOHN T. BOYD COMPANY

3-4


3.8 Climate

Climate in west Texas is typical for the region: generally arid with mild winters and hot summers. Average daily high temperatures are well above freezing 12 months of the year, while daily low temperatures may drop below freezing roughly 6 months out of the year. Annual precipitation in the region is roughly 12 in. to 14 in. but may vary widely from year to year.

Table 3.2 provides National Oceanic and Atmospheric Administration (NOAA) monthly average climate data from 2020, collected in Kent, Texas, which is located approximately 95 miles southwest of the Kermit Mine. A closer NOAA weather station is located in Midland, Texas, however this station had no records for precipitation.

Table 3.2: 2020 Monthly Average Climate Data, Kent, TX


Average


Unit

   Jan      Feb      Mar      Apr      May      Jun      Jul      Aug      Sep      Oct      Nov      Dec  

High Temp

   °F      73        74        89        94        99        103        105        104        96        92        88        74  

Low Temp

   °F      23        18        34        32        46        56        64        65        41        35        31        23  

Precipitation

   inches      2.6        5.9        1.0        —          0.3        0.2        0.3        0.1        3.6        0.2        0.1        9.9  
   days      3        5        6        —          3        3        4        3        6        1        1        2  

Snowfall

   inches      2.1        4.9        —          —          —          —          —          —          —          —          —          9.0  
   days      1        2        —          —          —          —          —          —          —          —          —          1  

Source: National Oceanic and Atmospheric Administration


JOHN T. BOYD COMPANY

3-5


4.0 GEOLOGY

4.1 Regional Geology

Alpine’s Kermit Mine is in an area of west Texas where the High Plains and Trans-Pecos desert regions converge. Surficial features of the High Plains region typically consist of thin clay and soil intervals covering caliche, with mesquite, juniper, and scrub grass cover. The Trans-Pecos region has numerous landform types ranging from the rising slopes of the Guadalupe Mountain Range, to the desert dune deposits of the Sand Hills areas. Just to the east of the study area, the Caprock Escarpment, a towering landform consisting of caliche capstone, abruptly stands hundreds of feet above the desert floor.

The location of the subject property is also near the center of the Permian Basin, which is well known for its long-producing petroleum and natural gas fields. While the subject of this report concentrates on the surficial geology (sand deposits) of west Texas, the operation currently sells its proppant sand product exclusively to the oil and gas producers working in the Permian Basin.

4.2 Local Stratigraphy

Surficial geologic units overlying the area are predominantly Quaternary age unconsolidated deposits, ranging from windblown sheet sands and dunes to alluvial sands, silts, clays, and caliche. Origins of these deposits are believed to be a combination of eroded bedrock material from the southern Rocky Mountains, and locally eroded Ogallala Formation sandstone. As portions of the southern Rockies were eroded via weathering, particles were carried to the Pecos River. Ancient flooding events of the Pecos River resulted in the suspended particles being deposited into flood plains. Once flood waters receded, winds took over, drying and further transporting these particles into the western Texas region.

The Caprock Escarpment marks the eastern-most extent of the surficial sand deposits. Winds transporting particles into the area are thought to have collided with the escarpment, slowing and dropping particles out to where they accumulated over time. Winnowing processes caused some degree of particle sorting to occur. Due to the mechanisms and long distances of particle transport, sand grains were abraded and rounded as they reached their current locations.


JOHN T. BOYD COMPANY

4-1


Alpine’s Kermit Property contains no discernable overburden materials with the exception of sparse areas of vegetation and roots, which are easily removed during processing. The surface sheet and dune sands here are generally mineable from the surface down to the total defined depths of the deposit. As the target formation is located at the surface, there are no geologic features which would materially impact mineability of the surface sands.

Quaternary unconsolidated deposition covers nearly all of the subject property, with the surficial deposits noted as generally ranging from 60-ft to over 300-ft in thickness. A generalized stratigraphic chart of the geologic units in Winkler County, Texas is presented in Figure 4.1.


System


Series


Geologic Unit

Quaternary


Pleistocene / Holocene

   Sheet and Dune Sand
   Loess
   Pleistocene    Unconsolidated Alluvium
Neogene    Pliocene    Ogallala Formation

Figure 4.1: Generalized Stratigraphic Chart, Surficial Deposits of Winkler County, TX

4.2.1 Quaternary Sheet and Dune Sands

Most of the subject property is uniformly covered by Quaternary sheet and dune sands generally consisting of fine- to medium-grained quartz sand grains mixed with varying degrees of silts, calcareous sands, and caliche nodules. Surficial sand deposition in the study area may range in thickness from less than 10-ft of windblown sheet sands, to hundreds of feet of dune sands. Unconsolidated alluvial deposits consisting of pebble- to cobble-sized limestone and chert nodules overlain by silts are found to the east of the property.

4.2.2 Ogallala Formation

The Ogallala Formation is predominantly comprised of weakly cemented to unconsolidated fine- to medium-grained sands, which may be silty and calcareous in places. A caliche caprock is frequently exhibited, which resists weathering and forms ledges. Thickness of this formation has been recorded up to 550-ft.


JOHN T. BOYD COMPANY

4-2


4.3 Frac Sand Geology

Frac sand is a naturally occurring, high silica content quartz sand, with grains that are generally well-rounded. The main difference between frac sand and other sands is that frac sand grains are relatively pure in composition, consisting almost entirely of quartz; other sands have numerous impurities that may be cemented to the quartz grains. The pure quartz composition of frac sand grains, along with being well-rounded and spherical in shape, gives these sands the characteristics (crush strength, high acid solubility, low turbidity) that are sought after by oil and gas producers for use in developing wells.


JOHN T. BOYD COMPANY

4-3


5.0 EXPLORATION DATA

5.1 Background

In-basin frac sand mines, such as Alpine’s Kermit Mine in west Texas, are a relatively new extension of the frac sand mining industry. The first in-basin frac sand mines in the United States opened in the Permian Basin of Texas in late-2017. As these operations began fulfilling contracts to in-basin oil and gas exploration and production companies, producers noted favorable results using the locally sourced proppants. Since in-basin mining and sales began in the Permian Basin, nearly every other energy basin has since gone through a period of frenzied exploration to locate suitable local sources of frac sands. Many E&Ps have also shifted their approach from requiring only premium branded frac sands, such as Northern White Sand, to using higher quantities of locally sourced and lower-priced frac sands, with positive results.

In developing the subject property, Alpine has completed two separate geologic exploration campaigns. Provided records from these campaigns comprise the primary data used in the evaluation of the frac sand resources. The results of 24 drill holes—totaling roughly 1,600 ft of drilling—distributed across the Kermit Property have been complied into a database. Maps illustrating the extents of the sand deposit along with electronic copies of drilling and sampling logs, as well as laboratory testing summaries, were provided for our review.

Alpine provided a brief account outlining the drilling and sampling methodologies utilized in the exploration campaigns at the Kermit Property. The equipment utilized, and the sampling, logging, and field work performed are noted as being appropriate for use in delineating a frac sand deposit. BOYD opines that the work done by Alpine is thorough and complete for purposes of evaluating and estimating frac sand resources and reserves on the subject property.

5.2 Exploration Procedures

5.2.1 Drilling and Sampling

Alpine has completed two separate exploration campaigns on the subject property to date. Detailed exploration reports were provided to BOYD for the initial campaign; however, an exploration report for the second campaign was never completed for budgetary reasons.


JOHN T. BOYD COMPANY

5-1


In March of 2017, Talon LP was contracted by Alpine to perform a preliminary exploratory drilling and sampling campaign, consisting of 24 completed drill holes over the entirety of the Kermit Property. Four drill holes were completed along the main access road of the property utilizing a truck-mounted air-rotary drilling rig, with samples being gathered by catching drill cuttings throughout every 5 ft of drilling advancement. As it was not possible to drive the truck mounted rig into the sand dunes covering the remainder of the property, a track-mounted Geo-Probe was brought in, which utilizes direct push sampling techniques, and 20 additional drill holes were completed over the remaining areas of the property. The Geo-Probe provided a 1-in. diameter core sample tube for every 4 ft that the rig was able to advance the core barrel into the ground. It is important to note that while this method of exploration is acceptable, the Geo-Probe has a limited drilling depth, and was not able to penetrate the total thickness of the mineable sand interval.

In March 2019, Alpine contracted Boart Longyear to perform a second exploratory drilling and sampling program on the subject property. A total of 11 rotosonic drill holes were completed on the southern (owned) parcel during this campaign. The objectives of this program were to verify the original exploration data, to define the total depth of the mineable deposit (as the depth explored in the initial program was limited by the abilities of the Geo-Probe rig), and to aid in the development of mining plans for the site. Samples from the rotosonic drill rig were retrieved in 10-ft intervals and extruded into sample casings that were laid out on core trays and logged. Each recovered 10-ft core was sampled in 2.5-ft intervals, which were bagged and labeled for laboratory analyses.


JOHN T. BOYD COMPANY

5-2


A group of chip trays were also created from the 2.5-ft sample intervals and used for reference during mine planning.


LOGO

A summary of drilling completed to date is shown in the Table 5.1 below.

Table 5.1: Alpine Silica Kermit Mine Exploration Drilling Campaign Summary


     Drill Hole Type         

Year

   Rotosonic      Rotary      Geo-Probe      Total  

2017

     —          4        20        24  

2019

     11        —          —          11  


Total

     11        4        20        35  

The sampling methodology for both exploration campaigns generally consisted of collecting composite samples of the recovered core along the entire length of the drill run. Sometimes a run was broken into smaller intervals to be tested (i.e., rotosonic drilling was done on 10-ft runs, with 2.5-ft composite samples). Gathered sample material was placed into plastic sampling bags, clearly labeled with drill hole name, top depth, and bottom depth of each sample, and secured closed with zip ties. Core photos of the sampled intervals were not provided to BOYD, however archival sample splits for each drill hole are kept in secure storage on the Kermit Property and were made available for inspection to BOYD during our site visit.


JOHN T. BOYD COMPANY

5-3


All samples from the two drilling campaigns were geologically logged and sampled by Alpine personnel. Samples were secured through the duration of drilling until being delivered to Alpine’s in-house laboratory. As such, Alpine maintained control of the samples throughout the entirety of each drilling campaign.

BOYD’s review of the reported sampling methodology and procedures indicate the data obtained by Alpine for the Kermit Property were carefully and professionally collected, prepared, and documented in conformance with generally accepted industry standards, and are appropriate for use of evaluating and estimating frac sand resources and reserves.

5.2.2 Frac Sand Quality Testing

Samples obtained from the exploration campaigns were taken to Alpine’s in-house laboratory, where they were prepared and analyzed for fines content and particle size distribution.

Initial preparation of each sample generally consisted of drying the raw sample material to remove moisture. Once dried, a 600-1,200-gram sample is gathered. The weighed sample is placed in a blender for three minutes to break up the material as much as possible. The blended sample is then placed on a 200-mesh wash screen, and thoroughly washed to remove any fine materials. The remaining greater than 200-mesh (+200-mesh) material is then dried and weighed again to determine the mass of fines that were washed out. After weighing the cleaned sample, the material is placed into a sieve stack of different mesh sizes and agitated for a period of 20 minutes to determine the particle size distribution of the clean sand. These results are repeated for every sampled interval from every drill hole.

After preparing the individual samples, composite samples of anticipated frac sand product sizes were then created and tested for crush strength at Alpine’s labs. To maintain quality testing transparency, composite samples were also sent to PropTester Inc. and Stim-Lab, Inc. for third-party API RP 19C/ISO 13503-2 proppant sand characteristics testing.

Results from the various testing performed on the Kermit Property samples is presented in Section 5.3.


JOHN T. BOYD COMPANY

5-4


5.2.3 Other Exploration Methods

No other methods of exploration (such as airborne or ground geophysical surveys) are reported for the Kermit Property.

5.3 Laboratory Testing Results

The relatively uniform nature of the sand deposit underlying the Kermit Property, combined with the results of independent laboratory testing, indicate the subject property deposit is capable of producing 40/70-mesh and 70/200-mesh frac sand products that meet Permian Basin customer specifications for in-basin frac sand.

5.3.1 Grain Size Distribution

Grain size distribution was analyzed according to API RP 19C/ISO 13503-2, Section 6. A table of weighted average grain size distribution of the in situ sand deposit, based on laboratory testing results, is shown in Table 5.2 below.

Table 5.2: Weighted Average Particle Size Distribution


Approximate In-Place Product Distribution

% Retained By Mesh Size    % Product
>40    40/70    70/200    <200    40/70    70/200

1

   41    44    14    48    52

The preceding table highlights the relative fineness of the sand found within the Kermit Property, indicating most of the sand particles are concentrated between the “passing 40 mesh” and “retained 200 mesh” size fraction. Accordingly, the predominant marketable product consists of the 40/200-mesh sands.

Grain size distribution is reviewed in the following section of this report and is also illustrated on the product (40/70-mesh and 70/200-mesh) isopleth maps in Figures 5.2 and 5.3.

5.3.2 Grain Shape (Sphericity and Roundness)

Grain shape was analyzed according to ISO 13503-2/API RP19C, Section 7. Under this standard, recommended sphericity and roundness values for proppants are 0.6 or greater. As part of the grain shape analysis, the presence of grain clusters (weakly cemented grain aggregates) and their approximate proportion in the sample were reported.


JOHN T. BOYD COMPANY

5-5


LOGO


5-6


LOGO


5-7


5.3.3 Crush Resistance

Crush resistance is a key test that determines the amount of pressure a sand grain can withstand under laboratory conditions for a two-minute duration. It is analyzed according to ISO 13503-2/API RP19C, Section 11. Under this standard, the highest stress level (pounds per square inch, or psi) in which the proppant produces no more than 10% crushed fine material is rounded down to the nearest 1,000 psi and reported as the “K-value” of the material.

5.3.4 Acid Solubility

Acid solubility was analyzed according to ISO 13503-2/API RP19C, Section 8. Under this standard, 5 grams of sand is treated with 100 milliliters of 12:3 hydrochloric acid to hydrofluoric acid at 150oF for 30 minutes. The recommended maximum acid solubility for proppants in the 40/70 size range and finer is 3.0%.

5.3.5 Turbidity

Turbidity was analyzed according to ISO 13503-2/API RP19C, Section 9. Under this standard, the suggested maximum frac sand turbidity should be equal to or less than 250 nephelometric turbidity units (NTU).

5.3.6 Quality Summary

Samples gathered during exploration were used to create 3 composite product samples that were tested by two separate third-party laboratories (PropTester and Stim-Lab) for API RP 19C/ISO 13503-2 proppant sand characteristics. Alpine also conducted in-house crush testing on samples obtained from their plant feed stream. Both of the independent laboratories showed similar results overall, with Alpine’s internal laboratory testing on crush strength showing roughly 1,000 psi lower than each third-party laboratory. Testing was performed on various product sizes; however, for purposes of this report and estimate, we are only discussing the 40/70 mesh and 70/200 mesh samples.

Averaged third-party test results are shown in Table 5.3.

Table 5.3: Kermit Property Average API/ISO Test Results


     Average API/ISO Test Results By Product Size  
     40/70 mesh      70/200 mesh  
            Recommended         

Test

   Result      Specification      Result  

Sphericity

     0.7        ³ 0.6        0.7  

Roundness

     0.6        ³ 0.6        0.6  

Acid Solubility (%)

     2.7        £ 3.0        3.4  

Turbidity (NTU)

     n/a        £ 250        n/a  

K-Value (000 psi)

     7        —          10  


*

100-mesh proppant sand material currently does not have an API/ISO specification.


JOHN T. BOYD COMPANY

5-8


The composited sample testing suggests the Kermit Mine is capable of producing frac sands which meet minimum API/ISO recommended testing characteristics.

The relatively dense drill hole coverage, combined with the frequency of sample intervals taken during exploration, provides a sufficiently detailed understanding of the extent and quality of the frac sand deposit underlying the Kermit Property to support the estimates of reserves reported herein.

5.4 Data Verification

For purposes of this report, BOYD did not verify historic drill hole data by conducting independent drilling in areas already explored. It is customary in preparing proppant sand resource and reserve estimates to accept basic drilling and quality testing data as provided by the client, subject to the reported results being judged representative and reasonable.

BOYD’s efforts to judge the appropriateness and reasonability of the source exploration data included reviewing provided drilling logs, sampling procedures, frac sand quality testing results, examining archival sample intervals, and discussing aspects of developing the Kermit Property with Alpine personnel during our site visit.


JOHN T. BOYD COMPANY

5-9


6.0 FRAC SAND RESOURCES AND RESERVES

6.1 Applicable Standards and Definitions

Unless otherwise stated, frac sand resource and frac sand reserve estimates disclosed herein are completed in accordance with the standards and definitions provided by S-K 1300. It should be noted that BOYD considers the terms “mineral” and “frac sand” to be generally interchangeable within the relevant sections of S-K 1300.

Estimates of any mineral resources and reserves are always subject to a degree of uncertainty. The level of confidence that can be applied to a particular estimate is a function of, among other things: the amount, quality, and completeness of exploration data; the geological complexity of the deposit; and economic, legal, social, and environmental factors associated with mining the resource/reserve. By assignment, BOYD used the definitions provided in S-K 1300 to describe the degree of uncertainty associated with the estimates reported herein.

The definition of mineral (frac sand) resource provided by S-K 1300 is:

Mineral resource is a concentration or occurrence of material of economic interest in or on the Earth’s crust in such form, grade or quality, and quantity that there are reasonable prospects for economic extraction. A mineral resource is a reasonable estimate of mineralization, taking into account relevant factors such as cut-off grade, likely mining dimensions, location or continuity, that, with the assumed and justifiable technical and economic conditions, is likely to, in whole or in part, become economically extractable. It is not merely an inventory of all mineralization drilled or sampled.

Estimates of frac sand resources are subdivided to reflect different levels of geological confidence into measured (highest geologic assurance), indicated, and inferred (lowest geologic assurance)

The definition of mineral (frac sand) reserve provided by S-K 1300 is:

Mineral reserve is an estimate of tonnage and grade or quality of indicated and measured mineral resources that, in the opinion of the qualified person, can be the basis of an economically viable project. More specifically, it is the economically mineable part of a measured or indicated mineral resource, which includes diluting materials and allowances for losses that may occur when the material is mined or extracted.


JOHN T. BOYD COMPANY

6-1


Estimates of frac sand reserves are subdivided to reflect geologic confidence, and potential uncertainties in the modifying factors, into proven (highest assurance) and probable.

Figure 6.1 shows the relationship between frac sand resources and frac sand reserves.


LOGO

In this report, the term “frac sand reserves” represent the tonnage of frac sand products that meets customer specifications and will be available for sale after processing of the ROM sand.

6.2 Frac Sand Resources

6.2.1 Methodology

BOYD independently prepared estimates of in-place frac sand for the Kermit Property by performing the following tasks:


1.

Available drilling logs and laboratory testing results were compiled and reviewed to check for accuracy and to support development of the geologic model. The geologic database utilized for modeling and estimation consists of results from 27 of the 35 holes as 8 holes from the first campaign were twinned by the second campaign for verification purposes. The geologic data were imported into Carlson Software, a geologic modeling and mine planning software suite that is widely used and accepted by the mining industry.


JOHN T. BOYD COMPANY

6-2


2.

A geologic model of the deposit was created in Carlson Software using industry-standard grid modeling methods well-suited for simple stratigraphic deposits. The geologic model delineates the top and bottom of the mineable sand horizon and the distribution of the product size fractions across the deposit. The top and bottom of the mineable frac sand interval were established thusly:


  a.

As there is minimal overburden material across the property, the top of the mineable sand interval was defined as the current ground surface as provided by an aerial topographic survey conducted on July 1, 2021.


  b.

The bottom of the mineable sand interval was established by either the bottom of the drill hole, or where present by the top of excessively silty intervals commonly found near the bottom of the deposit.


3.

After reviewing the continuity and variability of the deposit, suitable resources classification criteria were developed and applied as per the discussion in Section 6.2.2.


4.

BOYD then reviewed the proposed mining regions identified by Alpine management. Estimation of the of the in-place frac sand resources for the Kermit Property assumes mining operations using standard surface excavation equipment, which is widely utilized for mining of similar deposit types. As such, the estimates were subject to the following setbacks and slope requirements:


  a.

50 ft inside of property lines.


  b.

300 ft from pipeline easements.


  c.

50 ft around the wet and dry process plant areas, housing camp area, and main access road/right of way.


  d.

An overall pit wall slope of 3:1 (approximately 19 degrees).


5.

In-place volumes for each of the proposed mining blocks were calculated from the geologic model within Carlson Software. A dry, in-place, bulk density of 100 pounds per cubic foot was used to calculate the in-place tonnage of frac sand

At the request of Alpine, BOYD utilized provided January – June 2021 production volumes to estimate the in-place frac sand resources for the Kermit Mine as of January 1, 2021.


JOHN T. BOYD COMPANY

6-3


6.2.2 Classification

Geologic assuredness is established by the availability of both structural (thickness and elevation) and quality (size fraction) information for the deposit. Resource classification is generally based on the concentration or spacing of exploration data which can be used to demonstrate the geologic continuity of the deposit. When material variations in thickness, depth, and/or sand quality occur between drill holes, the allowable spacing distance between drill holes is reduced. The following drill hole spacing criteria were established by the Qualified Person after review of the available exploration data and geologic models and used to classify the frac sand resources of the Kermit Mine:

Table 6.1: Kermit Property Drill Hole Spacing Parameters


Resource    Spacing Requirement (ft)  

Classification

   (Nominal Maximum)  

Measured

     1,500  

Indicated

     2,500  

Inferred

     5,000  

The Qualified Person has determined that nearly all of the estimated frac sand resources within the Kermit Property are classified as either a Measured or Indicated.

BOYD is of the opinion that there is a low degree of uncertainty associated with each of the resource classifications.

6.2.3 Frac Sand Resource Estimate

There are no reportable frac sand resources excluding those converted to frac sand reserves for the Kermit Mine. Quantities of frac sand controlled by Alpine within the defined boundaries of the Kermit Property which are not reported as frac sand reserves are not considered to have potential economic viability; as such, they are not reportable as frac sand resources.

6.2.4 Validation

BOYD independently estimated in-place frac sand resources for the Kermit Mine based on the provided drilling, sampling, and testing data obtained by Alpine. Utilizing industry-standard grid modeling techniques we have estimated volumes of frac sand indicated by such data. Based on our review of Alpine’s well-documented geologic exploration and sampling methods, we are of the opinion that the data provided are reasonable and appropriate. Furthermore, it is our opinion that the estimation methods employed are both appropriate and reasonable for the deposit type and proposed extraction methods.


JOHN T. BOYD COMPANY

6-4


6.3 Frac Sand Reserves

6.3.1 Methodology

Estimates of frac sand reserves for the Kermit Mine were derived contemporaneously with estimates of frac sand resources. To derive an estimate of saleable product tons (proven and probable frac sand reserves), the following modifying factors were applied to the in-place measured and indicated frac sand resources underlying the respective mine plan areas:


A 95% mining recovery factor which assumes that 5% of the mineable (in-place) frac sand resource will not be recovered for various reasons. Applying this recovery factor to the in-place resource results in the estimated ROM sand tonnage that will be delivered to the wet process plant.


An overall 82.1% processing recovery derived from reported annual plant production statistics supplied by Alpine. This recovery factor accounts for removal of out-sized (i.e., larger than 40-mesh and smaller than 200-mesh) sand and losses in the wet and dry processing plants due to minor inefficiencies.

The overall product yield (after mining and processing losses) for the Kermit Mine is estimated at 78%. That is, for every 100 tons of in-place frac sand resources mined, approximately 78 tons will be recovered and sold as product.

At the request of Alpine, BOYD utilized provided January – June 2021 production volumes to estimate the frac sand reserves for the Kermit Mine as of January 1, 2021.

6.3.2 Classification

Proven and probable frac sand reserves are derived from measured and indicated frac sand resources, respectively, in accordance with S-K 1300. BOYD is satisfied that the frac sand reserve classification reflects the outcome of technical and economic studies. Figure 6.2 illustrates the reserve classification of the Kermit Property frac sand deposit.

6.3.3 Frac Sand Reserve Estimate

Alpine’s estimated surface mineable frac sand reserves for the Kermit Property total 49.5 million saleable product tons, as of January 1, 2021.


JOHN T. BOYD COMPANY

6-5


LOGO


6-6


The following table presents the estimated Reserve tons by product (size), that are anticipated to be produced at Alpine’s Kermit Property.

Table 6.2: Reserves as of January 1, 2021


     Alpine Silica Kermit Property Reserves (As of January 1, 2021)  
     Tons (000) By Classification and Mesh Size      Total         
     Proven      Probable      By Mesh Size      Grand  

Control

   40/70      70/200      Total      40/70      70/200      Total      40/70      70/200      Total  

Owned

     13,163        15,862        29,025        384        512        896        13,547        16,374        29,921  

Leased

     6,456        6,831        13,287        3,073        3,215        6,288        9,529        10,046        19,575  


Total

     19,619        22,693        42,312        3,457        3,727        7,184        23,076        26,420        49,496  

The reported reserves include only frac sand which is reportedly leased or owned as of December 31, 2020. Alpine owns approximately 29.9 million product tons, or 60% of the frac sand reserves, with the remainder held under lease agreements.

The frac sand reserves of the Kermit Mine are well-explored and defined. It is our conclusion that over 85% of the stated reserves can be classified on the proven reliability category (the highest level of assurance) with the reminder classified as probable.

The estimated product distribution of the frac sand reserves is based on a combination of available laboratory gradation test data and actual production yields provided by Alpine. Grain size distribution and overall yields may vary based on the depth and location at which mining occurs.

The Kermit Property, and other frac sand operations in the area, have a well-established history of mining and selling frac sand products into the local Permian Basin energy fields. BOYD has assessed that sufficient studies have been undertaken to enable the frac sand resources to be converted to frac sand reserves based on current and proposed operating methods and practices. Changes in the factors and assumptions employed in these studies may materially affect the frac sand reserve estimate.

The extent to which the frac sand reserves may be affected by any known geological, operational, environmental, permitting, legal, title, variation, socio-economic, marketing, political, or other relevant issues has been reviewed as warranted. It is the opinion of BOYD that Alpine has appropriately mitigated, or has the operational acumen to mitigate, the risks associated with these factors. BOYD is not aware of any additional risks that could materially affect the development of the frac sand reserves.


JOHN T. BOYD COMPANY

6-7


Based on our independent estimate and operations review, we have a high degree of confidence that the estimates shown in this report accurately represent the available frac sand reserves controlled by Alpine, as of January 1, 2021.


JOHN T. BOYD COMPANY

6-8


7.0 MINING OPERATIONS

7.1 Mining Method

The Kermit Mine is an existing mining operation utilizing medium-sized earthmoving equipment and conventional surface mining techniques.

Overburden, including topsoil, clay, caliche, and vegetation, is stripped from the surface of the sand deposit utilizing bulldozers, scrapers, loaders, excavators, and haul trucks, as well as any other mobile equipment deemed necessary. The overburden is stockpiled away from the sand dunes in berms or stockpiles which will be planted (vegetated) to minimize erosion of the material after completion. Most of the mineable area has minimal overburden and vegetation; as such, sand excavation normally begins at the surface throughout most of the mine plan area.

Once the overburden has been stripped (if required), a Caterpillar 390 excavator is used to remove the top or upper bench which consists of approximately 15 ft of reddish colored sand. Generally, three 45-ton articulated trucks are utilized to haul the excavated sand to the wet process plant feed hopper, where it is fed through a grizzly hopper/feeder to remove any remaining vegetation or lumps.


LOGO


JOHN T. BOYD COMPANY

7-1


Once the upper bench of sand is excavated, the lower bench, which is white in color, is mined. Thickness of the lower bench averages 16 ft, but can reach 20 ft. The overall mining thickness is generally 31 ft, up to 35 ft. The first (upper) bench is removed well in advance of the second (lower) bench. The second bench is more cohesive, with a higher clay and moisture content, and is allowed to drain/dry before excavating to improve handling and minimize “balling” of the material. The leased northern property was explored to only a depth of 21 ft and this is the average depth utilized for the reserve estimate. However, the actual depth will most likely be similar to the 35 ft encountered on the owned property and the associated two bench mining extraction method will be similar. A conceptual mine plan with sequencing is illustrated in Figure 7.2.

7.2 Mine Schedule, Equipment, and Staffing

The quarry pit operates 7 days per week and 12 hours per day. Generally, there are five hourly personnel involved with excavating the sand. The pit generally excavates 7,500 tons per 12-hour day or 625 tph. This production can be increased, or another shift added, depending on market demand. The downturn in energy prices and the COVID-19 pandemic have resulted in reduced operating hours and production during 2020 and into 2021.

The primary mobile equipment involved in sand excavation includes:


Caterpillar 390 Excavator.


Four 45-ton class articulated trucks.


Cat 988 Wheel Loader.


Dozer.


Water Truck and other ancillary equipment.

7.3 Mine Production

7.3.1 Historical Mine Production

Alpine produces 40/70-mesh and 70/200-mesh (100-mesh) frac sand products for sale into the Permian Basin. A significant portion of the products are transported into New Mexico since the state border adjoins the western limit of the Kermit Property. All of the products are trucked to their final destination.


JOHN T. BOYD COMPANY

7-2


The sand is mined, processed, stored, and shipped from the Kermit Mine. Production from the operation commenced in late 2017. Historic sales are as follows:

Table 7.1: Historic Frac Sand Sales


Year

   Finished Tons (000)  

2018

     1,062  

2019

     1,016  

2020*

     737  

7.3.2 Forecasted Production

Forecasted ROM sand production is estimated as follows:

Table 7.2: Forecasted ROM Production Tons


     Year      Year      Year      Year      Year  
     2021      2022      2023      2024      2025  

ROM Production tons (000)

     1,461        1,461        1,461        1,461        1,461  

The average process yield is reported to be 82.1%; as such, 1.46 million ROM tons are expected to produce approximately 1.2 million tons of finished product.


JOHN T. BOYD COMPANY

7-3


7.3.3 Expected Mine Life

As of January 1, 2021, the reserve estimate for Alpine is estimated at 49.5 million saleable tons. Projecting the historic sales volume of between 1.0 and 1.2 million tons per year, the operation has a LOM of between 41 and 50 years.


LOGO

The illustration above depicts the proposed LOM plan for the Kermit Mine. The LOM plan assumes a steady-state sales volume of 1.0 million product tons per year for approximately 50 years. Future mine plan production, and hence the longevity of the mine, is directly related to energy market demand for proppant sand. Actual yearly production volumes may, and are likely to, fluctuate significantly based on this demand.


JOHN T. BOYD COMPANY

7-4


7.3.4 Mining Risk

Surface mines face two primary types of operational risks. The first category of risk includes those daily variations in physical mining conditions, mechanical failures, and operational activities that can temporarily disrupt production activities. Several examples are as follows:


Water accumulations/soft floor conditions.


Process water shortages.


Power curtailments.


Variations in grain size consistency.


Encountering excessive clay and other waste material.


Failures or breakdowns of operating equipment and supporting infrastructure.


Weather disruptions (power outages, dust storms, excessive heat etc.).

The above conditions/circumstances can adversely affect production on any given day, but are not regarded as “risk issues” relative to the long-term operation of a mining entity. Instead, these are considered “nuisance items” that, while undesirable, are encountered on a periodic basis at many mining operations. BOYD does not regard the issues listed above as being material to the Kermit Mine operations or otherwise compromising its forecasted performance.

The second type of risk is categorized as “event risk.” Items in this category are rare, but significant occurrences that are confined to an individual mine, and ultimately have a pronounced impact on production activities and corresponding financial outcomes. Examples of event risks are major fires or explosions, floods, or unforeseen geological anomalies that disrupt extensive areas of proposed or operating mine workings and require alterations of mining plans. Such an event can result in the cessation of production activities for an undefined but extended period (measured in months, and perhaps years) and/or result in the sterilization of frac sand reserves. This type of risk is minimal in a relatively simple surface sand mining operation.


JOHN T. BOYD COMPANY

7-5


8.0 PROCESSING OPERATIONS

8.1 Overview

The Alpine process plant has three major process components which are typical in the frac sand industry. These components include:


Wet Process Plant- ROM material from the pit is dumped into the wet plant and the greater than 40-mesh and less than 200-mesh sand and silt material is removed.


Dry Process Plant- The wet 40 x 200-mesh material produced by the wet process plant is dried and screened into finished products.


Storage and Loadout- Finished products are stored in silos and gravity loaded from under the silos into highway trucks for transport to the customer.

8.2 Wet Process Plant

The ROM material is delivered to the wet plant via articulated trucks where it is dumped into a stockpile located near the raw sand feed scalping screen and sump. A front-end loader loads the ROM sand into the scalping screen feed hopper. The oversize (greater than 40-mesh) is screened out and the remaining sand is mixed with water to be pumped through the plant. As the quarry pit progresses, and haul distances become longer, an overland conveyor or in-pit scalping/slurry hopper may be installed to reduce or eliminate truck haulage. Currently, there are no definitive plans for this project.


JOHN T. BOYD COMPANY

8-1


LOGO

The wet process plant has a nameplate capacity of 600 tph and has historically averaged 500 tph of raw sand feed. The plant is essentially two similar 300-tph wash circuits in parallel. This arrangement offers a degree of flexibility as one plant circuit can be idled for maintenance, while the other is operating. Figure 8.1 shows the wet process plant at the Kermit Mine.

The wet process plant does not crush the material, but predominantly scrubs (i.e., washes) and classifies (i.e., sizes) the sand. Basically, a screen removes the 40-mesh top size and cyclones deslime and remove the minus 200-mesh material. Attrition scrubbers clean the sand and dewatering screens remove excess moisture. The resultant 40 x 200-mesh material is stockpiled as a feed for the dry plant. The Work-In-Progress stockpile has a water decant system below the stockpile that generally reduced the sand to a 4% to 5% moisture content. The waste wash/process water is directed to a thickener and then to a series of settling ponds. The existing plant has a series of plate presses installed that have been idled and will eventually be removed. The plate presses were high maintenance and never performed well for dune sand dewatering. Chemical flocculant is added as the water is discharged into the retention ponds to aid with particle settling. Water for the wet process is recycled as it is sourced from a lined retention pond. Figure 8.2 provides a simplified flow sheet for the wet process plant in operation at the Kermit Mine.


JOHN T. BOYD COMPANY

8-2


LOGO

The closed loop process water circuit should allow for efficient use of water as the majority is collected and recycled in the process. Water conservation is a high priority at the operation. The wet process plant operates 7 days per week, 24 hours per day.


JOHN T. BOYD COMPANY

8-3


8.3 Dry Process Plant

The dry process plant consists of two Louisville rotary dryers, each rated at approximately 200 tph at 4% to 6% moisture sand feed.


LOGO

As shown in Figure 8.3, the dry classification takes place in the screening building where Rotex dry screens will classify the material into predominantly two product size fractions consisting of:


40/70-mesh.


70/200-mesh (100-mesh).

8.4 Storage and Loadout

Following the classification of the sand into 40/70-mesh and 70/200-mesh products, the resulting products are stored in one of eight product storage silos. Each silo has a capacity of 3,000 tons for a total combined product storage of 24,000 tons at the plant site. There is 12,000 tons of storage for 70/200-mesh product and 12,000 tons of storage for 40/70-mesh product.


JOHN T. BOYD COMPANY

8-4


LOGO

There are six truck drive under-silo loadout lanes, equipped with scales, at the plant which operate 24/7 throughout the year.

8.5 Future Operations

The Kermit Mine plans to produce on average 1.2 million tons per year of finished product. Table 8.1 summarizes the near-term (2021 to 2025) planned ROM production to the process plant and the resultant finished product breakdown. The actual ROM production and finished product volumes will be predominantly dependent on market demand and may fluctuate substantially.


JOHN T. BOYD COMPANY

8-5


Table 8.1: Production and Sales Projections


     Year 2021      Year 2022      Year 2023      Year 2024      Year 2025  

ROM Production (000 Tons)

     1,461        1,461        1,461        1,461        1,461  

Processing Recovery (%)

     82.1        82.1        82.1        82.1        82.1  

Dry Plant Product (000 Tons)

     1,200        1,200        1,200        1,200        1,200  

Product Sales (000 Tons)

     1,200        1,200        1,200        1,200        1,200  

40/70-Mesh

     559        559        559        559        559  

70/200-Mesh

     641        641        641        641        641  

8.6 Conclusion

Based on our review of the Kermit Mine processing plant, it is BOYD’s opinion that the processing methods and existing equipment at the plant will be sufficient for the planned production of frac sand.


JOHN T. BOYD COMPANY

8-6


9.0 MINE INFRASTRUCTURE

The Kermit Mine is serviced by three phase power that is routed along FM 1218, which runs parallel to the western property line. The pipeline providing natural gas supply for the drying equipment is also routed along this corridor. Plant process water is supplied by 12 wells installed around the periphery of the property. Additionally, the wash process water is recycled after fines are removed via settling with a flocculent in a series of constructed ponds. As the mine progresses, silt ponds are constructed in mined-out areas. Wastewater from offices and other buildings are collected via holding tanks and disposed of on a regular basis. Potable water is provided by off-site sources (e.g., bottled water), although a public water system permit application has been filed but not yet approved.

On-site facilities include a scale house, office, shop, camp, and a quality laboratory located in the dry process plant. The operation employs approximately 52 people and staffing varies based on production demand. Seven of the 52 positions are salary employees. Approximately 50% of the workforce resides on-site in either trailers or company-supplied modular housing. The camp can accommodate approximately 40 people.

The surface facilities currently located at the mine are well constructed and have the necessary capacity/capabilities to support the Kermit Mine’s near-term operating plans. Operational preference may constitute the upgrading of some existing facilities if the operation expands in the future.


JOHN T. BOYD COMPANY

9-1


10.0 MARKET ANALYSIS

The Permian Basin’s (Permian) frac sand market is driven by unconventional horizontal drilling in the oil and gas industry. In the late 1990s, rapid advances in horizontal drilling and hydraulic fracturing (fracking) in North America ushered in large-scale commercial oil and gas production. This fracking technique has been increasingly successful and modified over time to extract oil and gas held in dense layers of shale rocks, whose low permeability had previously prevented the flow of hydrocarbons.

Hydraulic fracturing uses a mixture of water, chemicals, and proppant (natural sand or man-made sand-like substances) to fracture shale rock and release hydrocarbons such as oil, natural gas and natural gas liquids. The proppant acts to keep the fractures open (prop) while the pressurized fluids flow back up the well piping. Wells have become more productive with the addition of horizontal drilling capabilities, longer lateral lengths, and multi-stage fracks.

North America’s shale oil industry’s growing competitiveness gained through continuous technology improvement and falling production costs have had major implications on the global energy market. Oilfield service companies, including frac sand producers, made significant cuts in 2020 to survive lower commodity prices because of the COVID-19 pandemic. Figure 10.1 illustrates the CME Group’s West Texas Intermediate (WTI) Crude Oil Annual Average Futures Price. We estimate breakeven pricing for unconventional oil wells in the Permian to be in the $30 to $40 per barrel range, with some areas in the mid $20s per barrel. 2021 WTI futures pricing showed a strong recovery following the 2020 COVID-19 impact.


LOGO


JOHN T. BOYD COMPANY

10-1


Permit submissions for horizontal oil and gas wells in the Permian indicate a continuation of strong drilling ahead. According to InfillThinking, the number of permits filed per working rig this summer is tracking at multi-year highs as evidenced in Figure 10.2 below.


LOGO

Over the previous 52 weeks, rig counts in the Permian are up approximately 111%. This has led to increased production for both crude oil and natural gas. For the same time period, crude oil (barrels per day) and natural gas production (thousand cubic feet per day) in the Permian are up 10% and 9%, respectively. As Figure 10.3 illustrates, Permian daily crude oil production is nearing its pre-pandemic impacted peak, while daily natural gas production in the Permian continues to make new records and now stands at 18.6 billion cubic feet per day.


JOHN T. BOYD COMPANY

10-2


LOGO

According to U.S. Energy Information Administration Drilling Productivity Report, drilled but uncompleted wells (DUCs) in the Permian Basin have declined 43% since peaking in July 2020 (refer to Figure 10.4). These data dovetail with increased crude oil and natural gas production in the basin.


LOGO

Consequently, with increases in production and well completions, activity at frac sand mines in the Permian Basin have increased. Per MSHA, operating hours for the second quarter of 2021 for Permian Basin frac sand mines were up 20% sequentially. In fact, only two mines saw a material decrease in hours from Q1 2021 to Q2 2021 while several had increases of more than 80% sequentially.


JOHN T. BOYD COMPANY

10-3


LOGO

According to Lium LLC, all but one frac sand mine in the Permian Basin is fully operational. However, total in-basin mine hours are still about 45% below peak. Mine hours serve as a directional indicator which dovetails with previous crude oil and natural gas production and DUC data. Current frac sand production in the Permian Basin is estimated to be nearing its prior peak production of about 70 million tons per year leading to stable pricing in the basin. BOYD anticipates stable frac sand pricing with a slight upside bias due to potential supply chain disruptions and high commodity input costs.


JOHN T. BOYD COMPANY

10-4


11.0 CAPITAL AND OPERATING COSTS

11.1 Introduction

Alpine commenced mining and processing operations at the Kermit Mine in September 2017. As such, BOYD presents data based on the first three full years of operations, 2018, 2019, and 2020. Alpine provided BOYD with financial data for the years 2018, 2019, 2020, and through June 2021.

We remind the reader of the significant effect the COVID-19 pandemic had on drilling and fracking activities in the Permian Basin and the oil & gas industry in 2020. As such, this should be considered when reviewing Year 2020 data.

11.2 Historical Capital Expenditures

BOYD estimated CapEx for the period pre-2018 to 2020, based on changes to fixed asset accounts presented on the balance sheets and on a cash flow statement provided by Alpine. Table 11.1 presents the annual capital expenditures, based on the financial statements, from startup of operations pre-2018 through 2020.

Table 11.1: Historical Capital Expenditures


CapEx ($000)


Pre-2018

     60,420  

Year 2018

     27,778  

Year 2019

     9,250  

Year 2020

     34  


Total

     97,482  


JOHN T. BOYD COMPANY

11-1


Figure 11.1 presents annual and cumulative CapEx over the same period.

Approximately 90% of the cumulative CapEx was incurred by the end of 2018, as would be expected for a start-up frac sand mining operation.


LOGO


JOHN T. BOYD COMPANY

11-2


11.3 Historical Operating Costs and Revenues

Table 11.2 presents Alpine’s historical financials for the period 20181 through 2020.

Table 11.2: Historical Financials2


     Year 2018     Year
2019
    Year 2020     Year 2018     Year 2019     Year 2020  

Tons Sold (000)

     1,062       1,016       737       1,062       1,016       737  

40/70-Mesh

     258       239       160       258       239       160  

70/200-Mesh

     804       777       577       804       777       577  
     $(000)       $ per ton sold  


Total Revenues

     64,817       17,587       10,215       61.04       17.32       13.87  

40/70-Mesh

     14,166       5,274       3,227       54.97       22.09       20.19  

70/200-Mesh

     42,583       12,314       6,988       52.95       15.85       12.11  

Other

     8,068       —         —         7.60       —         —    

Expenses:


Cash Operating Costs:


Employee Wages and Benefits

     8,787       7,513       3,344       8.27       7.40       4.54  

Repairs and Maintenance

     3,262       1,743       541       3.07       1.72       0.73  

Utilities and Propane/Gas

     2,294       1,527       1,140       2.16       1.50       1.55  

Fuel (Diesel and Gasoline)

     716       570       263       0.67       0.56       0.36  

Lease and Equipment Rental

     730       231       31       0.69       0.23       0.04  

Other Operating

     10,463       3,545       1,910       9.85       3.49       2.59  


Subtotal Cash Operating Costs

     26,252       15,130       7,230       24.72       14.90       9.81  

SG&A

     454       4,292       1,937       0.43       4.23       2.63  


Total Cash Cost of Goods Sold

     26,706       19,422       9,167       25.15       19.12       12.44  

DDA

     7,558       9,428       9,478       7.12       9.28       12.86  


Total Cost of Goods Sold

     34,264       28,849       18,644       32.27       28.40       25.30  

Other Income (Expense)

     (5,575     (3,332     (1,992     (5.25     (3.28     (2.70


Net Income

     24,978       (14,594     (10,421     23.52       (14.36     (14.14

Operating costs represent the costs incurred associated with the mining, ongoing reclamation, wet processing, dry processing, product loadout, and other related costs.

Based on the statistics presented above for the three-year period:


Average realization declined from $53.44 per ton sold in 2018 to $13.87 per ton sold in 2020.


Total cash cost of goods sold declined from $25.15 per ton sold in 2018 to $12.44 per ton sold in 2020.


1 

In Years 2018 and 2019, there were three expense accounts that were reported in Direct and Indirect Cost of Revenues, however, in 2020 and 2021, these same three accounts are now reported in Other Income & Expense. As such, BOYD reclassed the 2018 & 2019 respective costs to Other Income & Expense to properly compare all years based on current cost classifications.

2 

Cash operating costs include Direct and Indirect Cost of Revenues. Both Cash operating costs and SGA exclude DDA; their respective DDA expense is reported on the DDA line.


JOHN T. BOYD COMPANY

11-3


As previously noted, the COVID-19 pandemic had a significant negative effect on the operation.

11.4 Projected Production, Sales, and Costs

BOYD prepared production, sales, and cost projections for the Alpine operation based on current year data and historical financial data (presented above), as well as our knowledge of the frac sand market. Forecasted financial data, product pricing, and costs are in 2021 constant dollars. BOYD opines that the production and financial projections are reasonable and are likely to be within ± 20% accuracy level.

11.4.1 Production and Sales Projections

Table 11.3 below, presents BOYD’s frac sand production and sales projections for the period 2021 through 2025.

Table 11.3: Production and Sales Projections


     Year 2021      Year 2022      Year 2023      Year 2024      Year 2025  

ROM Production (000 Tons)

     1,461        1,461        1,461        1,461        1,461  

Processing Recovery (%)

     82.1        82.1        82.1        82.1        82.1  

Dry Plant Product (000 Tons)

     1,200        1,200        1,200        1,200        1,200  

Product Sales (000 Tons)

     1,200        1,200        1,200        1,200        1,200  

40/70-Mesh

     559        559        559        559        559  

70/200-Mesh

     641        641        641        641        641  

Revenues ($000)

     22,936        22,936        22,936        22,936        22,936  

Product Pricing ($ per ton sold)


Weighted Average Price

     19.11        19.11        19.11        19.11        19.11  

40/70-Mesh

     21.25        21.25        21.25        21.25        21.25  

70/200-Mesh

     17.25        17.25        17.25        17.25        17.25  

BOYD’s annual forecasted ROM production is based on the dry plant producing 1.2 million tons per year of saleable product after a processing (wet and dry processing plant) loss of approximately 18%, as discussed in Chapter 6. Forecasted dry processing plant production is within historical and current year volumes and remains within the operation’s current infrastructure capacities and capabilities.

The projected dry processing plant product split of approximately 47% for 40/70-mesh product and approximately 53% for 70/200-mesh product is based on the product tons by mesh size for the combined owned and leased frac sand reserves discussed in Chapter 6.


JOHN T. BOYD COMPANY

11-4


The sales price forecasts, by product, are based on current second quarter average prices, and reflect a rebound from 2020 prices. We opine that these are reasonable price projections.

11.4.2 Operating Cost Projections

Table 11.4 below, presents BOYD’s cash cost projections for the period 2021 through 2025. These projections were based on a review of prior year and current year detailed cost direct, indirect cost of revenue, and SG&A data provided to BOYD by Alpine, as well as other information and our experience with such operations.

Table 11.4: Annual Cash Cost Projections


     Year 2021      Year 2022      Year 2023      Year 2024      Year 2025  

Summary Cash Cost of Goods Sold ($000):


Cash Operating Costs:


Employee Wages and Benefits

     4,978        4,978        4,978        4,978        4,978  

Repairs and Maintenance

     864        864        864        864        864  

Utilities and Propane/Gas

     2,028        2,028        2,028        2,028        2,028  

Fuel (Diesel and Gasoline)

     552        552        552        552        552  

Lease and Equipment Rental

     122        122        122        122        122  

Other Operating

     3,108        3,108        3,108        3,108        3,108  


Subtotal Cash Operating Expense

     11,652        11,652        11,652        11,652        11,652  

SG&A

     2,188        2,188        2,188        2,188        2,188  

Bruce and Bar Ltd. Lease Expense

     —          —          —          —          —    

Final Reclamation Escrow

     121        121        121        121        121  


Total Cash Cost of Goods Sold

     13,961        13,961        13,961        13,961        13,961  

BOYD notes that there is no Bruce and Bar Ltd (B&B) lease expense in the first five years. The B&B lease expense will be incurred when mining operations commence on the leased property, which we project to be in Year 2045 in our financial projections.

BOYD added a reclamation escrow for the final reclamation of the property at the end of the operation’s life. We used a rate of $0.10 per ton sold to accrue the estimated expense. Over the life of the operation, approximately $5 million, before interest, will be escrowed.


JOHN T. BOYD COMPANY

11-5


Table 11.5 below, presents the above table’s cost projections on a cost per ton sold basis for the period 2021 through 2025.

Table 11.5 – Annual $ per Ton Sold Cash Cost Projections


     Year 2021      Year 2022      Year 2023      Year 2024      Year 2025  

Summary Cash Cost of Goods Sold ($ per ton sold):


Cash Operating Costs:


Employee Wages and Benefits

     4.15        4.15        4.15        4.15        4.15  

Repairs and Maintenance

     0.72        0.72        0.72        0.72        0.72  

Utilities and Propane/Gas

     1.69        1.69        1.69        1.69        1.69  

Fuel (Diesel and Gasoline)

     0.46        0.46        0.46        0.46        0.46  

Lease and Equipment Rental

     0.10        0.10        0.10        0.10        0.10  

Other Operating

     2.59        2.59        2.59        2.59        2.59  


Subtotal Cash Operating Expense

     9.71        9.71        9.71        9.71        9.71  

SG&A

     1.82        1.82        1.82        1.82        1.82  

Bruce and Bar Ltd. Lease Expense

     —          —          —          —          —    

Final Reclamation Escrow

     0.10        0.10        0.10        0.10        0.10  


Total Cash Cost of Goods Sold

     11.63        11.63        11.63        11.63        11.63  

11.4.3 Projected Capital Expenditures

BOYD projected sustaining CapEx, which includes maintenance of production equipment as well as other items, for the operation to be $1.50 per ton sold. This is based on our judgment and experience with similar operations.


JOHN T. BOYD COMPANY

11-6


12.0 ECONOMIC ANALYSIS

12.1 Introduction

BOYD prepared an economic analysis of the Kermit Mine using the production, sales, and financial projections presented in this report. Our analysis confirms that the operation generates positive cash flows (based on a 12% discount rate), on a pre-tax and after-tax basis, that supports the statement of frac sand reserves herein.

A cash flow projection has been generated from the proposed LOM production schedule and revenue, cost of goods sold (COGS), and CapEx estimates. A summary of the key assumptions is provided below.


LOM ROM frac sand tons and product tons sold were based on the total frac sand reserve estimates discussed in Chapter 6 of this report and are estimated to be depleted in Year 2062.


Revenues are forecasted at the Kermit Mine on-site loadout (mine gate).


Based upon sales of both 40/70 and 70/200-mesh size products delivered by truck to various sites in the Permian Basin.


Operating and Other Costs (as discussed in Chapter 11) include:


Employee wages and benefits.


Repair and maintenance.


Utilities and Propane/Gas.


Fuel (Diesel and Gasoline).


Lease and Equipment Rental.


Other Operating.


B&B Lease


Selling, General and Administrative.


Capital Expenditures (as discussed in Chapter 11) include:


Sustaining/Maintenance.


Reclamation costs include:


Final reclamation cost.


Taxes are based on:


Federal Business Income Tax Rate of 21%.


State Franchise Tax Rate of 0.75% of revenues.


Adjustments used to determine After-Tax cash flows:


Fixed assets are depreciated based on a 10-year life.


Operating losses are carried forward in the tax computation.


JOHN T. BOYD COMPANY

12-1


12.2 Cash Flow Analysis

Table 12.1 below presents the pre-tax and after-tax cash flow projections based on the proposed LOM production schedule and revenue, cost of goods sold, and CapEx and other estimates discussed above for the Kermit Mine.

Table 12.1: Summary Cash Flow Statement


     Summary Cash Flow Statement ($ 000; unless otherwise noted)  
     2021      2031      2041      2051      2061         
     to 2030      to 2040      to 2050      to 2060      to 2070      Total  

Total Tons Sold (000)

     12,000        12,000        12,000        12,000        1,496        49,496  

Revenues

     229,360        229,360        229,360        229,360        28,594        946,034  

COGS

     139,612        139,612        141,940        144,198        21,646        587,008  

CapEx

     18,000        18,000        18,000        18,000        900        72,900  


Net Pre-Tax Cash Flow

     71,748        71,748        69,420        67,162        6,048        286,126  

Federal Income and State Franchise Taxe

     4,468        16,434        16,079        15,824        1,644        54,450  


After-Tax Net Cash Flow

     67,280        55,314        53,342        51,337        4,404        231,676  

Discounted Cash Flow-Net Present Values (DCF-NPV) on a pre-tax and after-tax basis, using discount rates of 10%, 12%, and 15%, were calculated utilizing the cash flows above. The DCF-NPV values used mid-year discounting and all cash flows were on a constant dollar basis.

The pre-tax DCF-NPV ranges from approximately $51.0 million to $73.4 million. The after-tax DCF-NPV ranges from approximately $46.5 million to $64.9 million. Table 12.2 summarizes the results of the pre-tax and after-tax analyses:

Table 12.2: DCF-NPV


     DCF-NPV ($ 000)  
     10%      12%      15%  

Pre-Tax

     73,377        62,462        51,036  

After-Tax

     64,851        55,941        46,472  

Refer to Table 12.10 at the end of this chapter for the detailed LOM cash flow analysis and corresponding pre-tax and after-tax DCF-NPV analyses at a 12% discount rate.

The NPV estimate was made for purposes of confirming the economic viability of the reported frac sand reserves and not for purposes of valuing Alpine or its assets. Internal rate-of-return (IRR) and project payback were not calculated, as there was no initial investment considered in the financial model. Risk is subjective and each reader should evaluate the project based on their own investment criteria.


JOHN T. BOYD COMPANY

12-2


12.3 Sensitivity Analysis

Sensitivity analyses for the pre-tax and after-tax cash flows considering changes to revenues and COGS/CapEx were prepared using discount rates of 10%, 12%, and 15%. Revenues were adjusted in increments of 2.5% and range from minus 10% to plus 10% base revenues; the corresponding weighted average sales price would range from

$17.20 per ton sold to $21.02 per ton sold as noted in Table 12.3 below. Costs were adjusted in increments of 2.5% and range from minus 10% to plus 10% base costs. BOYD notes that although the B&B lease expense is in COGS, it changes with revenues as it is a function of revenue.

Table 12.3: Sensitivity Analysis – Weighted Average Sales Prices


     Weighted Average Sales Price $ per ton sold  

-10.0%

     -7.5     -5.0     -2.5     0.0     2.5     5.0     7.5     10.0


17.20

     17.68       18.15       18.63       19.11       19.59       20.07       20.54       21.02  

12.3.1 Pre-Tax Sensitivity Analyses

The following three tables (Tables 12.4–12.6) are summarized pre-tax sensitivity analyses based on 10%, 12% and 15% discount rates and incorporate the changes in revenue and COGS/CapEx discussed above:

Table 12.4: Pre-Tax DCF-NPV at 10%


LOGO


JOHN T. BOYD COMPANY

12-3


LOGO


LOGO


JOHN T. BOYD COMPANY

12-4


12.3.2 After-Tax Sensitivity Analyses

The following three tables (Tables 12.7–12.9) summarize the results of after-tax sensitivity analyses based on 10%, 12%, and 15% discount rates and incorporate the changes in revenues and COGS/CapEx discussed above:


LOGO


LOGO


JOHN T. BOYD COMPANY

12-5


LOGO


JOHN T. BOYD COMPANY

12-16


13.0 PERMITTING AND COMPLIANCE

13.1 Permitting

The Kermit Mine’s operations are predominantly regulated by the Texas Commission on Environmental Quality (TDEQ) with respect to environmental compliance. The predominant permitting requirement is an active NSR permit for air pollution control. The Kermit Mine’s current NSR permit is renewable in 2028. Other permits held for the Kermit Mine include: Stormwater, Above Ground Storage Tank, Aggregate Production Operation, and a Public Water System application (pending). There are no formal state or federal reclamation plans or permits required for the operation.

Although the property is not considered a high-quality habitat, Alpine has voluntarily enrolled those portions of the property for which it owns the surface rights in the Candidate Conservation Agreement with Assurances for the Dune Sagebrush Lizard.

13.2 Compliance

The Kermit Mine is regulated by TDEQ on matters involving air and water pollution and inspected periodically by the state if issues arise.

Mine safety is regulated by the federal government by MSHA as are all surface mining operations. MSHA inspects the facilities a minimum of twice yearly. Alpine’s safety record compares favorably with its regional peers. MSHA data indicates that during the mine’s operational life (2017 through 2020), Operator Non-Fatal Lost Days injury rates have been on the decline. Alpine’s incident rate has trended below average in comparison with other west Texas regional frac sand mining operations during the past two years (2019-2020).

Based on our review of information provided by Alpine and available public information, it is BOYD’s opinion that Alpine’s record of compliance with applicable mining, water quality, and environmental regulations is generally typical for the industry. BOYD is not aware of any regulatory violation or compliance issue which would materially impact the frac sand reserve estimate.


JOHN T. BOYD COMPANY

13-1


14.0 INTERPRETATION AND CONCLUSIONS

14.1 Findings

Based on our independent technical review and geoscientific study of the Kermit Mine, BOYD concludes:


Sufficient data have been obtained through the site exploration and sampling program and mining operations to support the geological interpretations of seam thickness, grain size distribution and API quality for the portions of the sand underlying the controlled property. The data are of sufficient quantity and reliability to reasonably support the sand resource and sand reserve estimates in this technical report summary.


Estimates of proppant sand reserves reported herein are reasonably and appropriately supported by technical studies, which consider mining plans, revenue, and operating and capital cost estimates.


The 49.5 million product tons of frac sand reserves (as of January 1, 2021) identified on the property are economically extractable under reasonable expectations of market volumes and pricing for proppant sand products, estimated operation costs, and capital expenditures.


There is no other relevant data or information material to the Kermit Mine that is necessary to make this technical report summary not misleading.

14.2 Significant Risks and Uncertainties

As with any mining project there are certain inherent risks associated with the overall operation of a facility. Alpine has sufficiently mitigated operational risk through obtaining sufficient geologic sampling information and analysis. Additionally, Alpine has engineered the processing plant to include parallel duplicate process circuits which significantly increases plant availability. However, it should be noted that frac sand is generally marketed exclusively to the energy industry which has historically been a volatile industry.


JOHN T. BOYD COMPANY

14-1