

ProFrac Holdings Investor Presentation April 2023 www.PFHoldingsCorp.com April 2023
Cautionary Statements Forward-Looking Statements Certain statements in this presentation may be considered “forward-looking statements” within the meaning of the “safe harbor” provisions of the Private Securities Litigation Reform Act of 1995. In some cases, the reader can identify forward-looking statements by words such as “may,” “should,” “expect,” “intend,” “will,” “estimate,” “anticipate,” “believe,” “predict,” or similar words. Forward-looking statements relate to future events or ProFrac’s future financial or operating performance. These forward-looking statements include, among other things, statements regarding: ProFrac’s strategies and plans for growth; ProFrac’s positioning, resources, capabilities, and expectations for future performance; market and industry expectations; ProFrac’s expected sources and uses of capital in future periods, including any capital that may become available to ProFrac under its credit facilities; perceived advantages of ProFrac’s Clean Fleet Technology and Engine Standby Controllers systems, including expectations of reduced costs, improved operational efficiencies and safety enhancements; expectations regarding ProFrac’s ability to execute on its M&A strategy and secure adequate funding to consummate any future acquisitions or other strategic transactions ProFrac may enter into in a sufficient and timely manner and without impairing ProFrac’s liquidity position; the anticipated benefits of ProFrac’s acquisitions of FTS International, U.S. Well Services, REV Energy Services and Monarch’s Eagle Ford sand mining operations, including benefits associated with scaling ProFrac’s vertically integrated business model, increasing ProFrac’s sand mining capabilities and sand supply, improving ProFrac’s operational efficiency, increasing ProFrac’s nameplate production capabilities, capturing proppant and logistics margins, reducing royalty payments and realizing other potential cost savings, increasing value to ProFrac’s customers, increasing ProFrac’s pressure pumping service capabilities and expanding ProFrac’s geographic footprint and active fleet count; expectations of demand for ProFrac’s products and services; the expected impact of inflationary pressures and supply chain constraints on ProFrac’s business operations and financial performance; any financial or other information based upon or otherwise incorporating judgments or estimates relating to future performance, events or expectations; and any estimates and forecasts of financial and other performance metrics. Such forward-looking statements are based upon assumptions made by ProFrac as of the date hereof and are subject to risks, uncertainties, and other factors that could cause actual results to differ materially from those expressed or implied by such forward-looking statements. Factors that may cause actual results to differ materially from current expectations include, but are not limited to: the risk that ProFrac will be unable to expand or otherwise modify its existing credit facilities in a timely manner, on favorable terms, or at all; risks relating to ProFrac’s liquidity needs; the risk that ProFrac will not realize the anticipated benefits of its completed and potential future acquisitions or other strategic transactions; the failure to operationalize and upgrade, as applicable, acquired operations, services and assets in a timely manner or at all; risks associated with ProFrac’s ability to effectively scale its operations and integrate acquired services, assets and personnel into its existing business model; ProFrac’s ability to execute its business strategy and plans for growth; industry conditions, including fluctuations in supply, demand and prices for ProFrac’s products and services; global and regional economic and financial conditions; the effectiveness of ProFrac’s risk management strategies; and other risks and uncertainties set forth in the sections entitled “Risk Factors” and “Cautionary Note Regarding Forward-Looking Statements” in ProFrac’s filings with the Securities and Exchange Commission (“SEC”), which are available on the SEC’s website at www.sec.gov. Nothing in this presentation should be regarded as a representation by any person that the forward-looking statements set forth in this presentation will be achieved or that any of the contemplated results of such forward looking statements will be achieved. There may be additional risks about which ProFrac is presently unaware or that ProFrac currently believes are immaterial that could also cause actual results to differ from those contained in the forward-looking statements. The reader should not place undue reliance on forward-looking statements, which speak only as of the date they are made. ProFrac anticipates that subsequent events and developments will cause its assessments to change. However, while ProFrac may elect to update these forward-looking statements at some point in the future, it expressly disclaims any duty to update these forward-looking statements, except as otherwise required by law. Industry and Market Data This presentation has been prepared by ProFrac and includes market data and certain other statistical information from third-party sources. Although we believe these third-party sources are reliable as of their respective dates, we have not independently verified the accuracy or completeness of this information. Some data is also based on our good faith estimates. The industry in which we operate is subject to a high degree of uncertainty and risk due to a variety of factors. These and other factors could cause results to differ materially from those expressed in these publications. Additionally, descriptions herein of market conditions and opportunities are presented for informational purposes only; there can be no assurance that such conditions will actually occur. Please also see “Forward-Looking Statements.” Non-GAAP Financial Measures We have included certain financial measures that are not calculated in accordance with generally accepted accounting principles (“GAAP”) in this presentation, including Adjusted EBITDA, Adjusted EBITDA margin and Annualized EBITDA per fleet. Adjusted EBITDA, Adjusted EBITDA margin and Annualized EBITDA per fleet are non-GAAP financial measures and should not be considered as substitutes for net income, net loss, operating loss or any other performance measure derived in accordance with GAAP or as an alternative to net cash provided by operating activities as a measure of our profitability or liquidity. Adjusted EBITDA, Adjusted EBITDA margin and Annualized EBITDA per fleet are supplemental measures utilized by our management and other users of our financial statements such as investors, commercial banks, research analysts and others, to assess our financial performance because they allow us to compare our operating performance on a consistent basis across periods by removing the effects of our capital structure (such as varying levels of interest expense), asset base (such as depreciation and amortization) and items outside the control of our management team (such as income tax rates). We view Adjusted EBITDA, Adjusted EBITDA margin and Annualized EBITDA per fleet as important indicators of performance. We define Adjusted EBITDA as our net income (loss), before (i) interest expense, net, (ii) income tax provision, (iii) depreciation, depletion and amortization, (iv) loss on disposal of assets, stock-based compensation and (v) other unusual or non-recurring charges, such as costs related to our initial public offering, non-recurring supply commitment charges, certain bad debt expense and gain on extinguishment of debt. We define Adjusted EBITDA margin as Adjusted EBITDA divided by total revenue. We define Annualized EBITDA per fleet as for a particular quarter as Adjusted EBITDA multiplied by four and divided by the average number of active fleets for the quarter. Annualized information contained in this presentation is calculated by multiplying the relevant metric for a given quarter by four. You should not unduly rely on annualized metrics as they are based on assumptions that may prove to be inaccurate. Our actual reported results for future periods may differ significantly from those implied by illustrative annualized information. We believe that our presentation of Adjusted EBITDA, Adjusted EBITDA margin and Annualized EBITDA per fleet will provide useful information to investors in assessing our financial condition and results of operations. In particular, we believe Annualized EBITDA per fleet allows investors to compare the performance of our fleets across comparable periods and against the fleets of our competitors who may have different capital structures, which may make a fleet-for-fleet comparison more difficult. Net income (loss) is the GAAP measure most directly comparable to Adjusted EBITDA and net income (loss) per fleet is the GAAP measure most directly comparable to Annualized EBITDA per fleet. Adjusted EBITDA should not be considered as an alternative to net income (loss), and Annualized EBITDA per fleet should not be considered as an alternative to net income (loss) per fleet. Adjusted EBITDA, Adjusted EBITDA margin and Annualized EBITDA per fleet have important limitations as analytical tools because they exclude some but not all items that affect the most directly comparable GAAP financial measure. You should not consider Adjusted EBITDA, Adjusted EBITDA margin or Annualized EBITDA per fleet in isolation or as a substitute for an analysis of our results as reported under GAAP. Because Adjusted EBITDA, Adjusted EBITDA margin and Annualized EBITDA per fleet may be defined differently by other companies in our industry, our definition of these non-GAAP financial measures may not be comparable to similarly titled measures of other companies, thereby diminishing their utility. Unless otherwise indicated, non-GAAP financial measures presented herein include the results of Flotek and only include the results from acquisitions from their respective dates of acquisition.
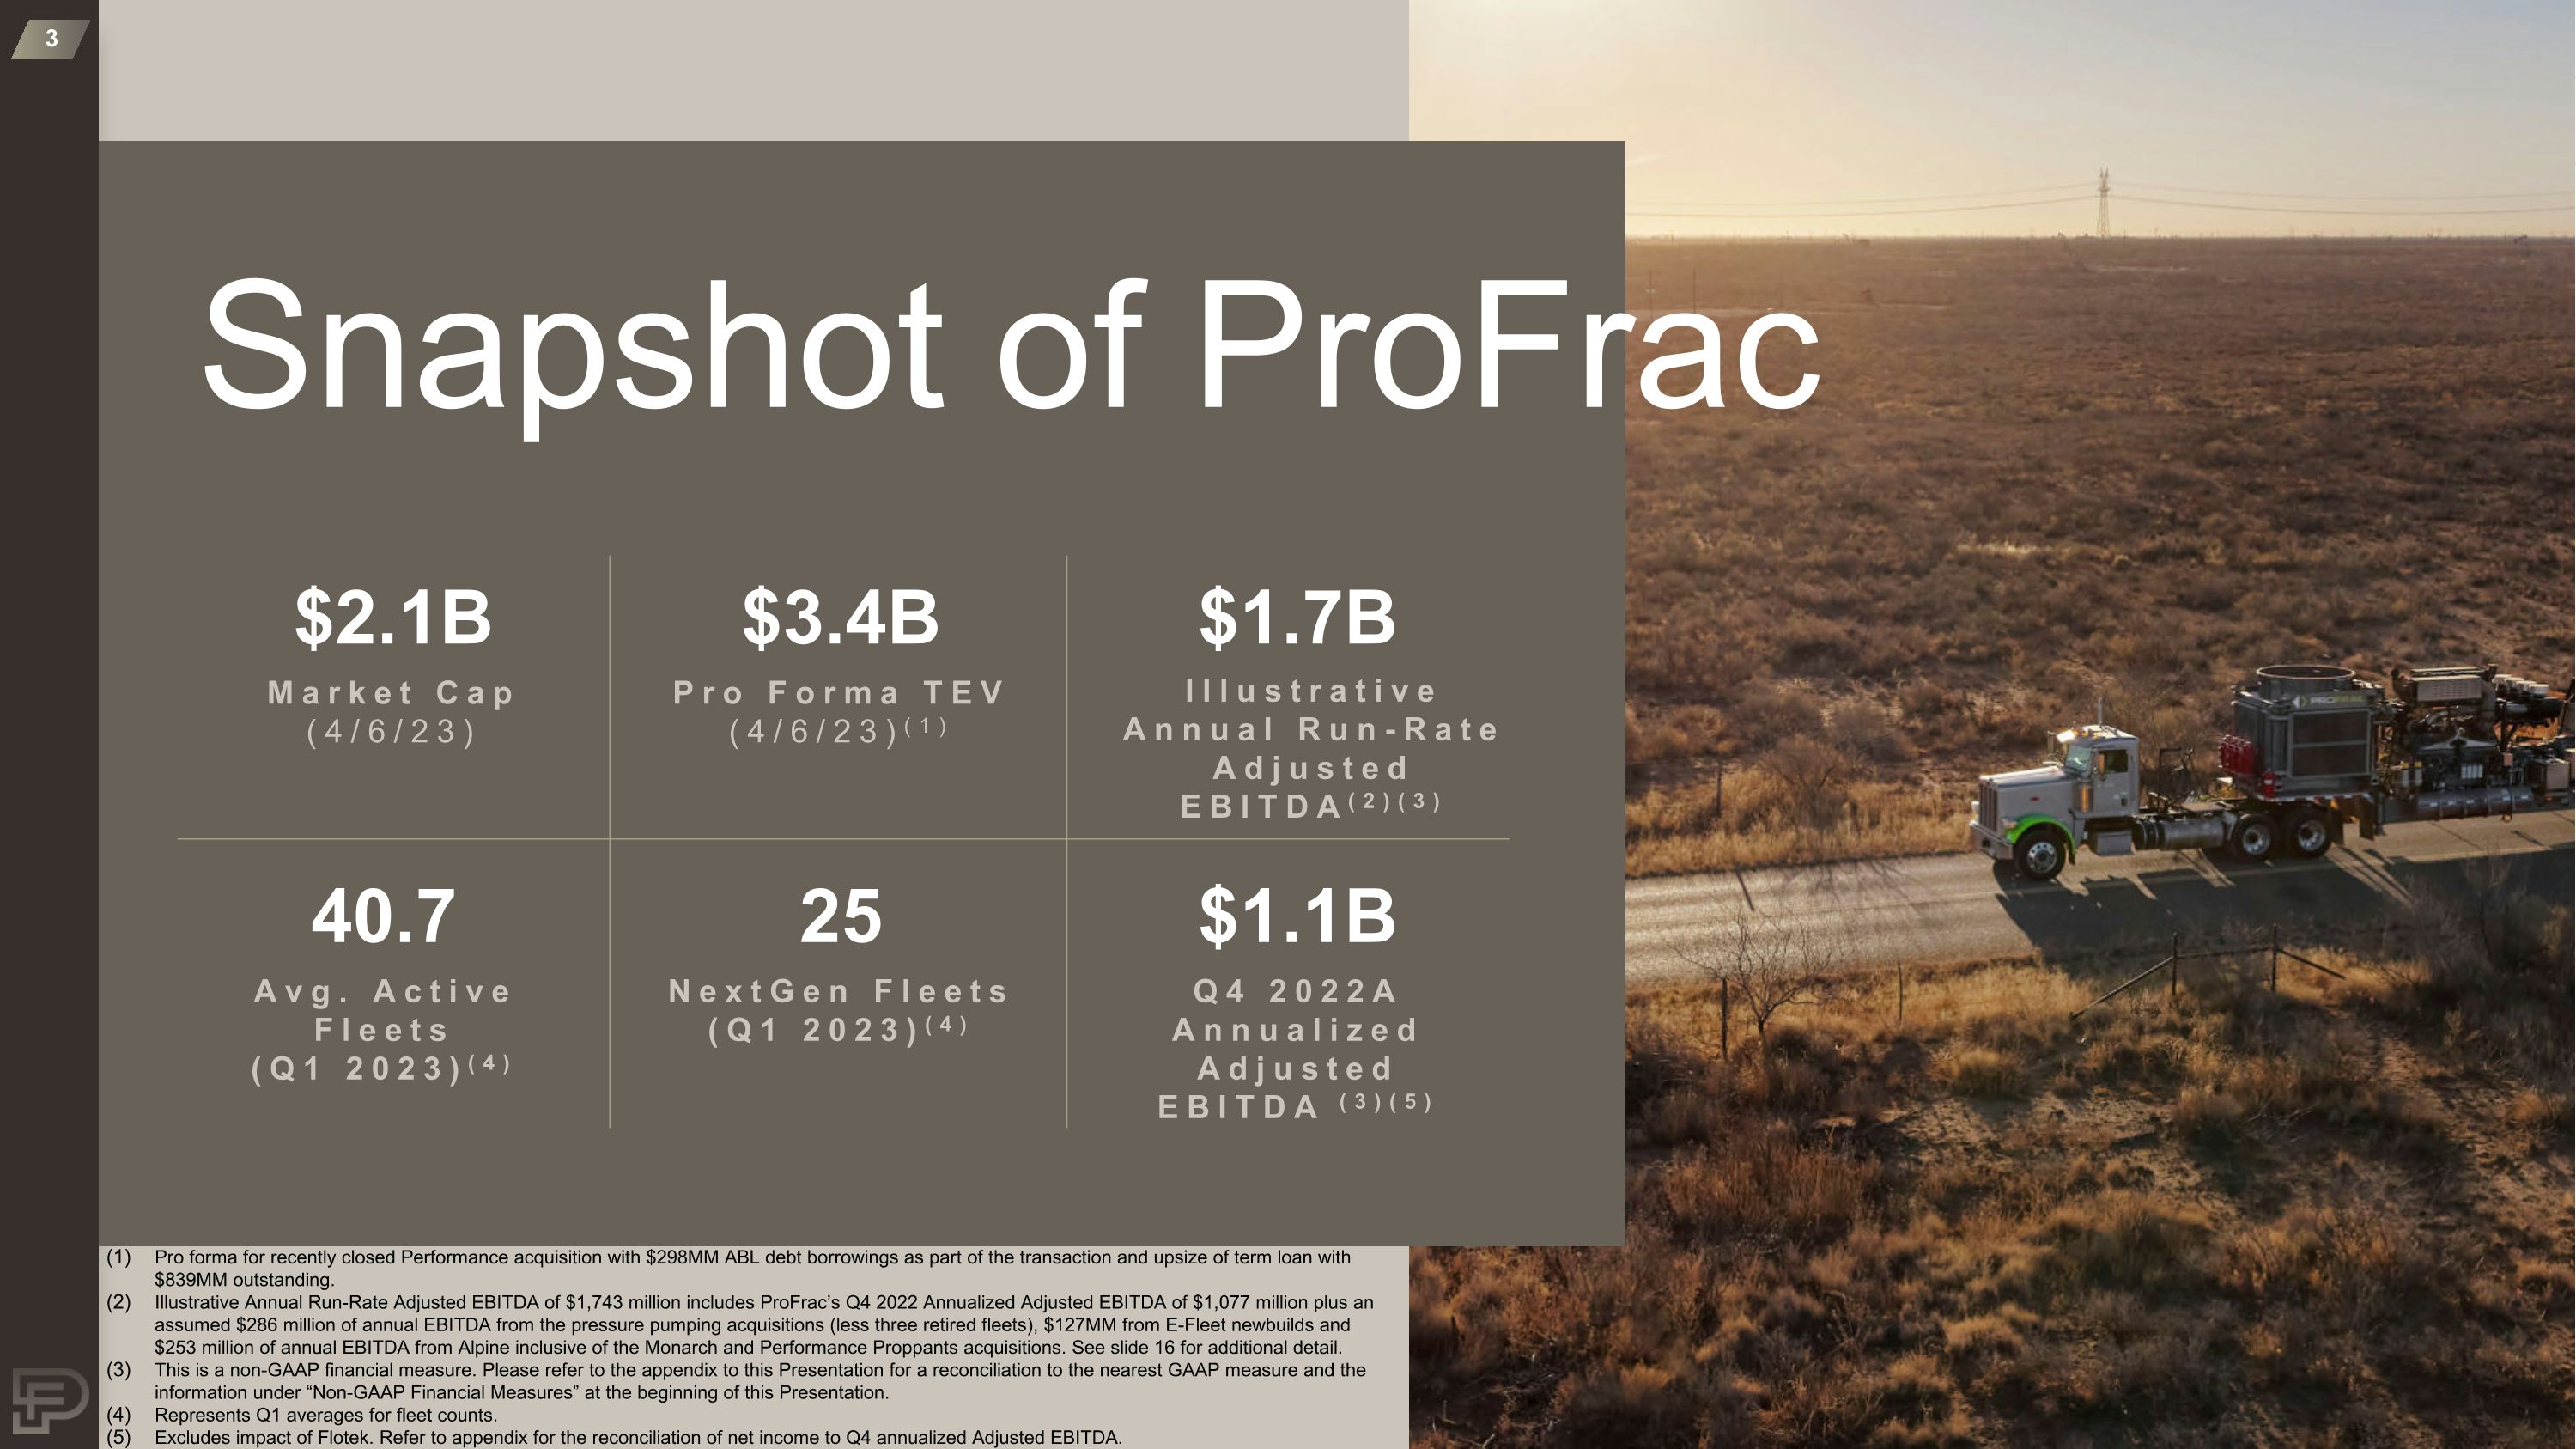
Snapshot of ProFrac $2.1B Market Cap (4/6/23) $3.4B Pro Forma TEV (4/6/23)(1) $1.7B Illustrative Annual Run-Rate Adjusted EBITDA(2)(3) 25 NextGen Fleets (Q1 2023)(4) $1.1B Q4 2022A Annualized Adjusted EBITDA (3)(5) 40.7 Avg. Active Fleets (Q1 2023)(4) Pro forma for recently closed Performance acquisition with $298MM ABL debt borrowings as part of the transaction and upsize of term loan with $839MM outstanding. Illustrative Annual Run-Rate Adjusted EBITDA of $1,743 million includes ProFrac’s Q4 2022 Annualized Adjusted EBITDA of $1,077 million plus an assumed $286 million of annual EBITDA from the pressure pumping acquisitions (less three retired fleets), $127MM from E-Fleet newbuilds and $253 million of annual EBITDA from Alpine inclusive of the Monarch and Performance Proppants acquisitions. See slide 16 for additional detail. This is a non-GAAP financial measure. Please refer to the appendix to this Presentation for a reconciliation to the nearest GAAP measure and the information under “Non-GAAP Financial Measures” at the beginning of this Presentation. Represents Q1 averages for fleet counts. Excludes impact of Flotek. Refer to appendix for the reconciliation of net income to Q4 annualized Adjusted EBITDA.
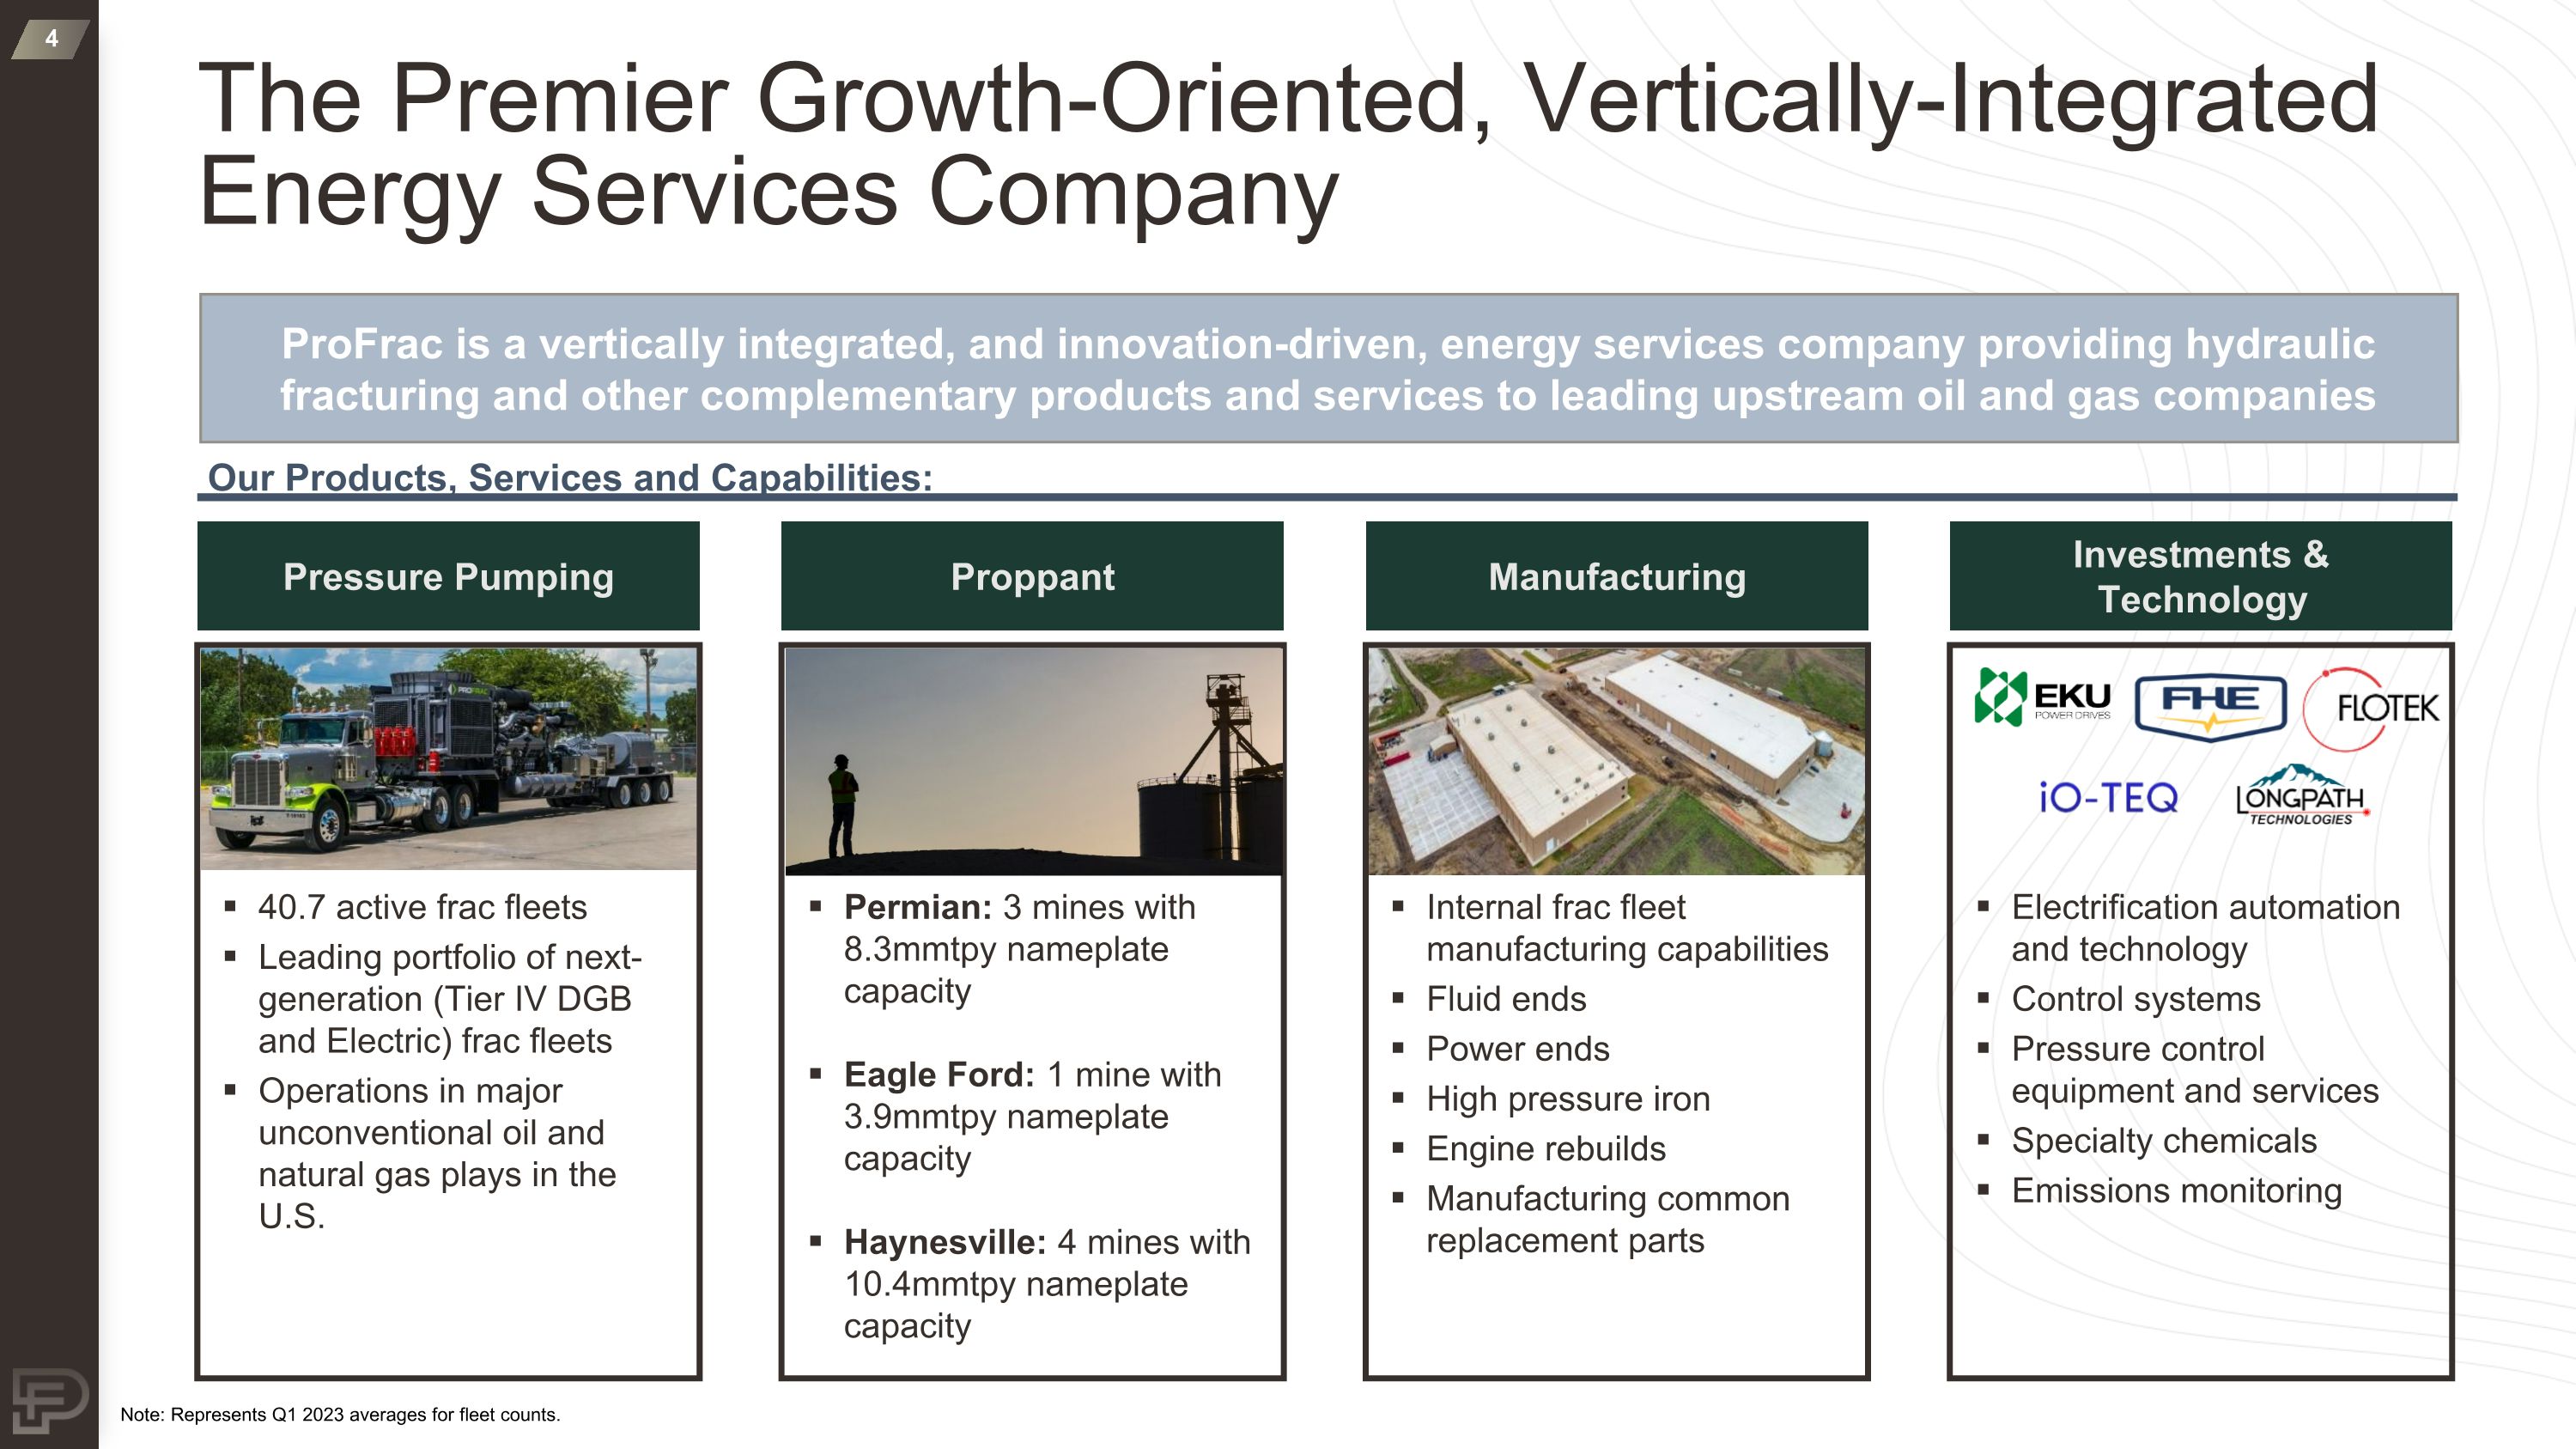
The Premier Growth-Oriented, Vertically-Integrated Energy Services Company Our Products, Services and Capabilities: Pressure Pumping Proppant Manufacturing Investments & Technology 40.7 active frac fleets Leading portfolio of next-generation (Tier IV DGB and Electric) frac fleets Operations in major unconventional oil and natural gas plays in the U.S. Permian: 3 mines with 8.3mmtpy nameplate capacity Eagle Ford: 1 mine with 3.9mmtpy nameplate capacity Haynesville: 4 mines with 10.4mmtpy nameplate capacity Internal frac fleet manufacturing capabilities Fluid ends Power ends High pressure iron Engine rebuilds Manufacturing common replacement parts Electrification automation and technology Control systems Pressure control equipment and services Specialty chemicals Emissions monitoring ProFrac is a vertically integrated, and innovation-driven, energy services company providing hydraulic fracturing and other complementary products and services to leading upstream oil and gas companies Note: Represents Q1 2023 averages for fleet counts.
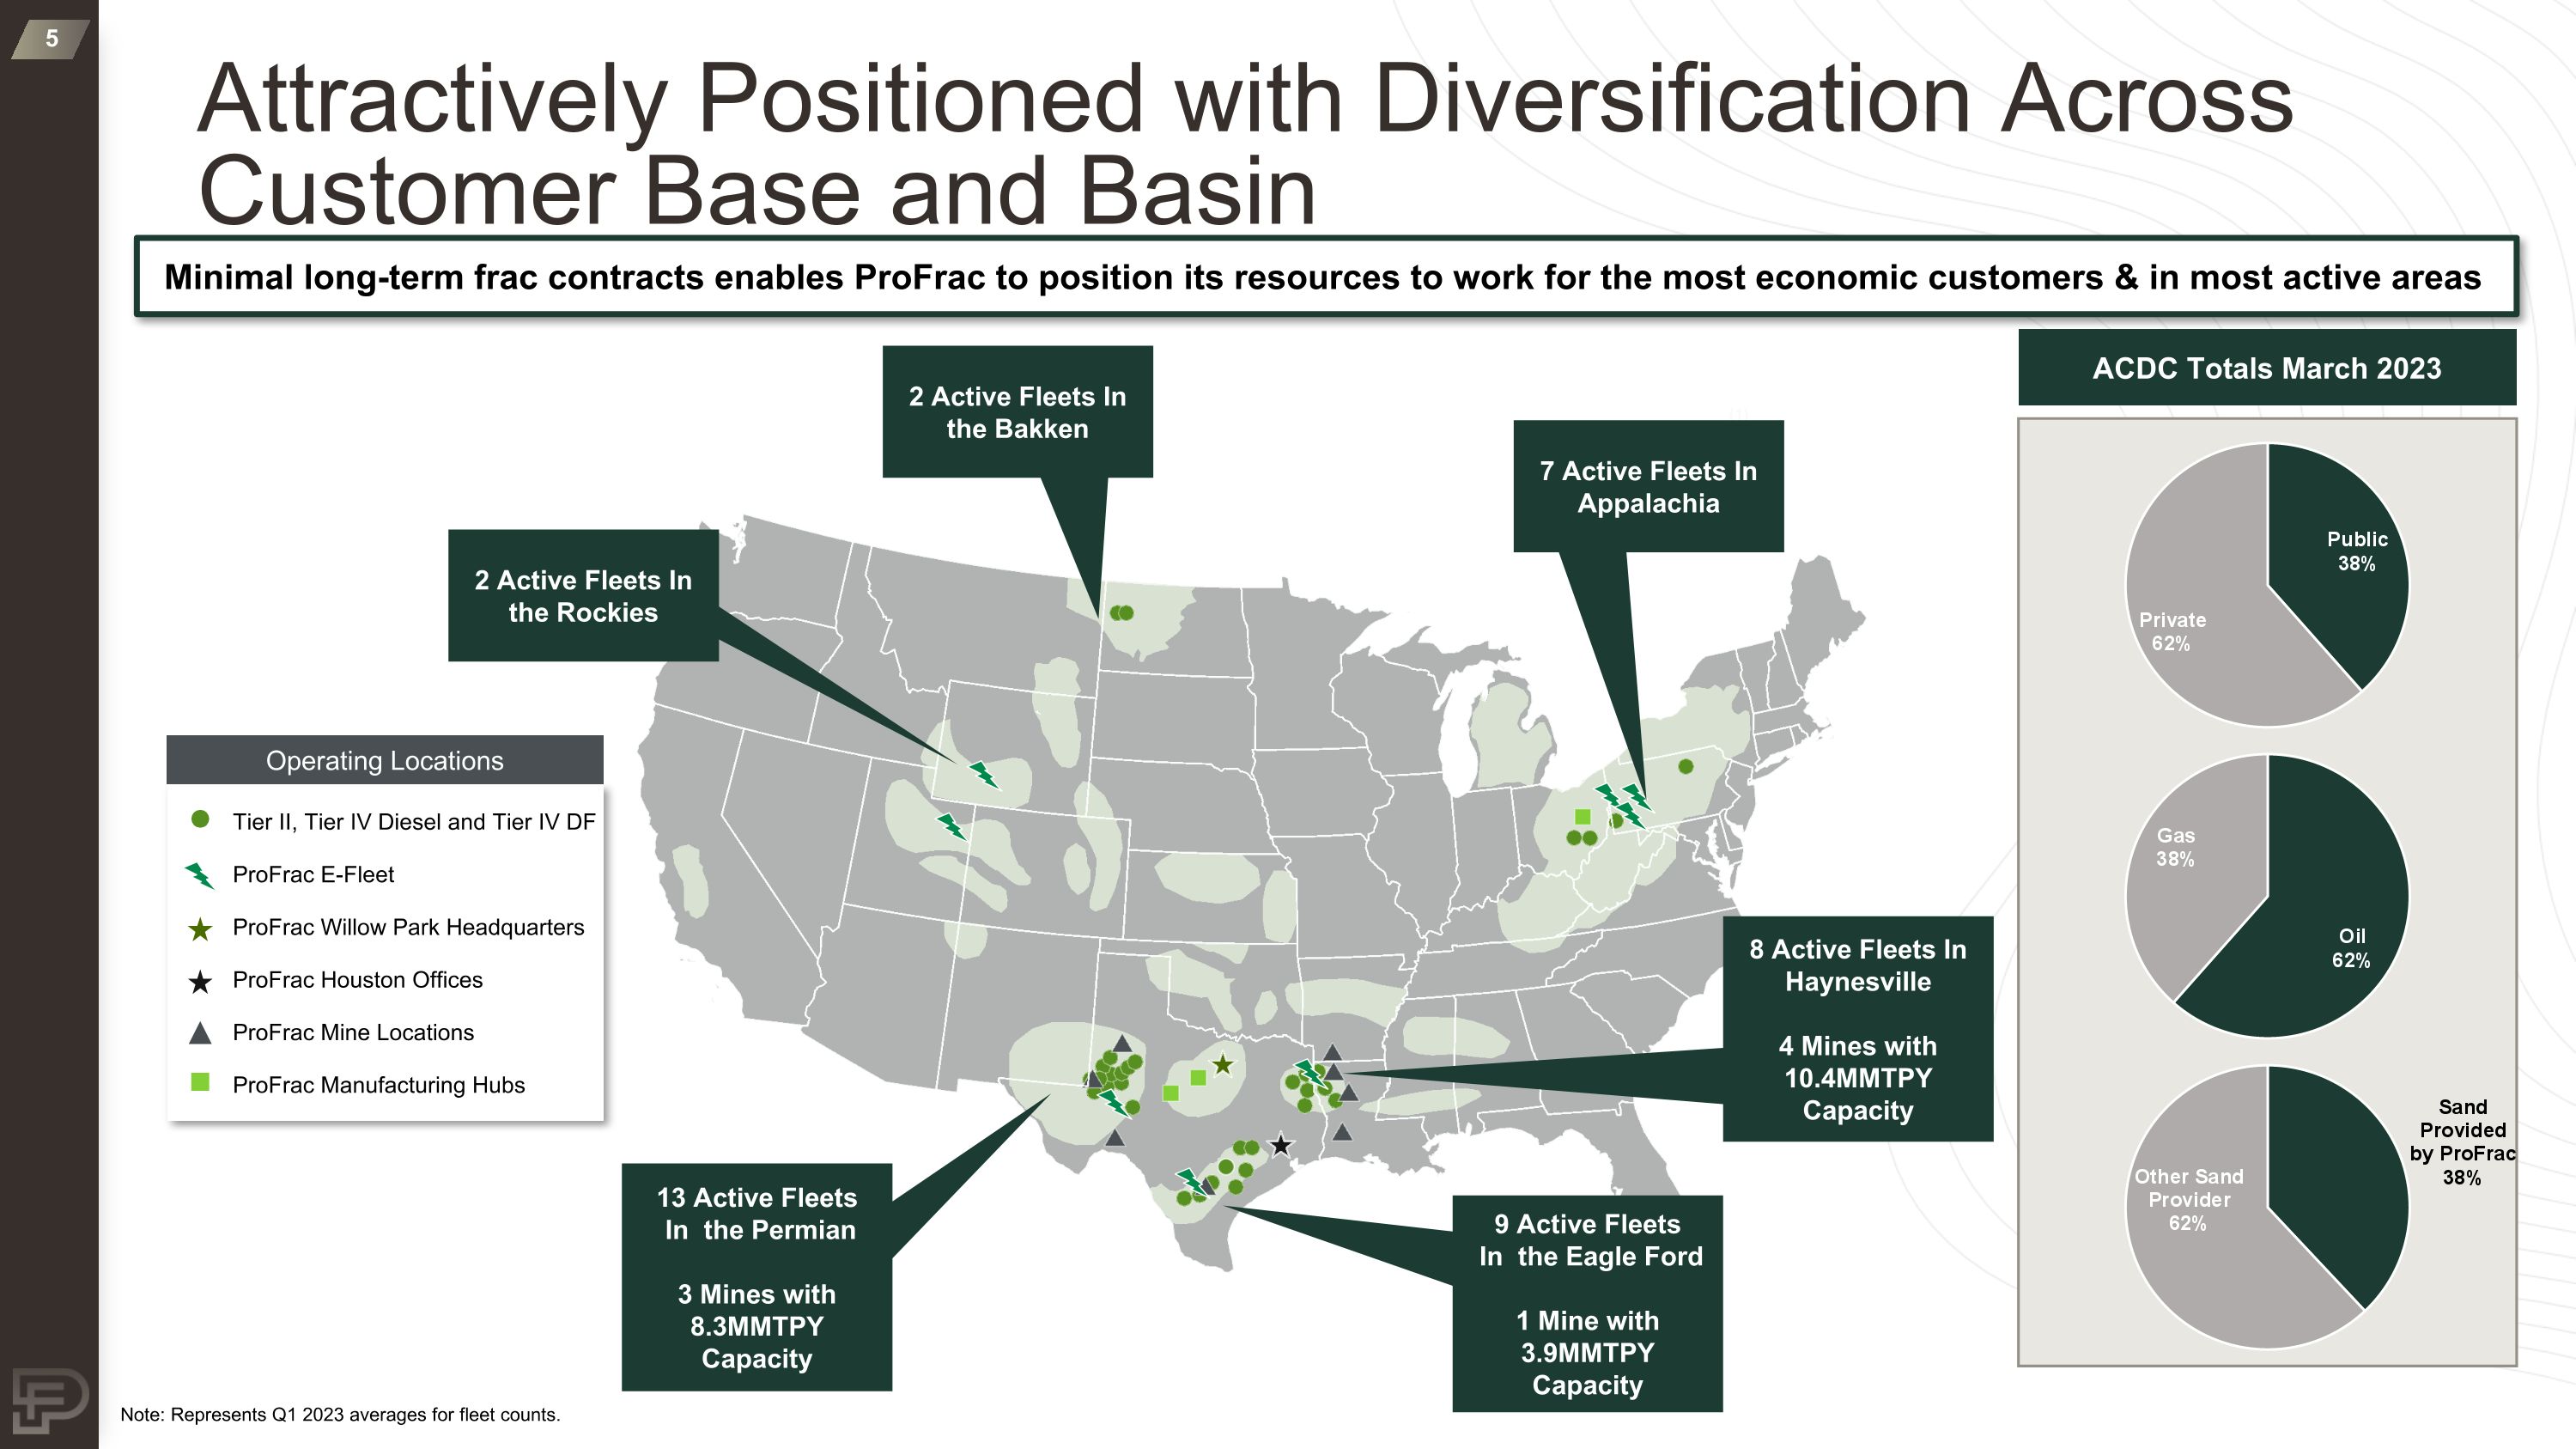
Attractively Positioned with Diversification Across Customer Base and Basin Minimal long-term frac contracts enables ProFrac to position its resources to work for the most economic customers & in most active areas Add pie charts from other page here. Revise text on left. ACDC Totals March 2023 (1) (1) Note: Represents Q1 2023 averages for fleet counts. 2 Active Fleets In the Rockies 2 Active Fleets In the Bakken 7 Active Fleets In Appalachia 8 Active Fleets In Haynesville 4 Mines with 10.4MMTPY Capacity 9 Active Fleets In the Eagle Ford 1 Mine with 3.9MMTPY Capacity 13 Active Fleets In the Permian 3 Mines with 8.3MMTPY Capacity Operating Locations Tier II, Tier IV Diesel and Tier IV DF ProFrac E-Fleet ProFrac Willow Park Headquarters ProFrac Houston Offices ProFrac Mine Locations ProFrac Manufacturing Hubs
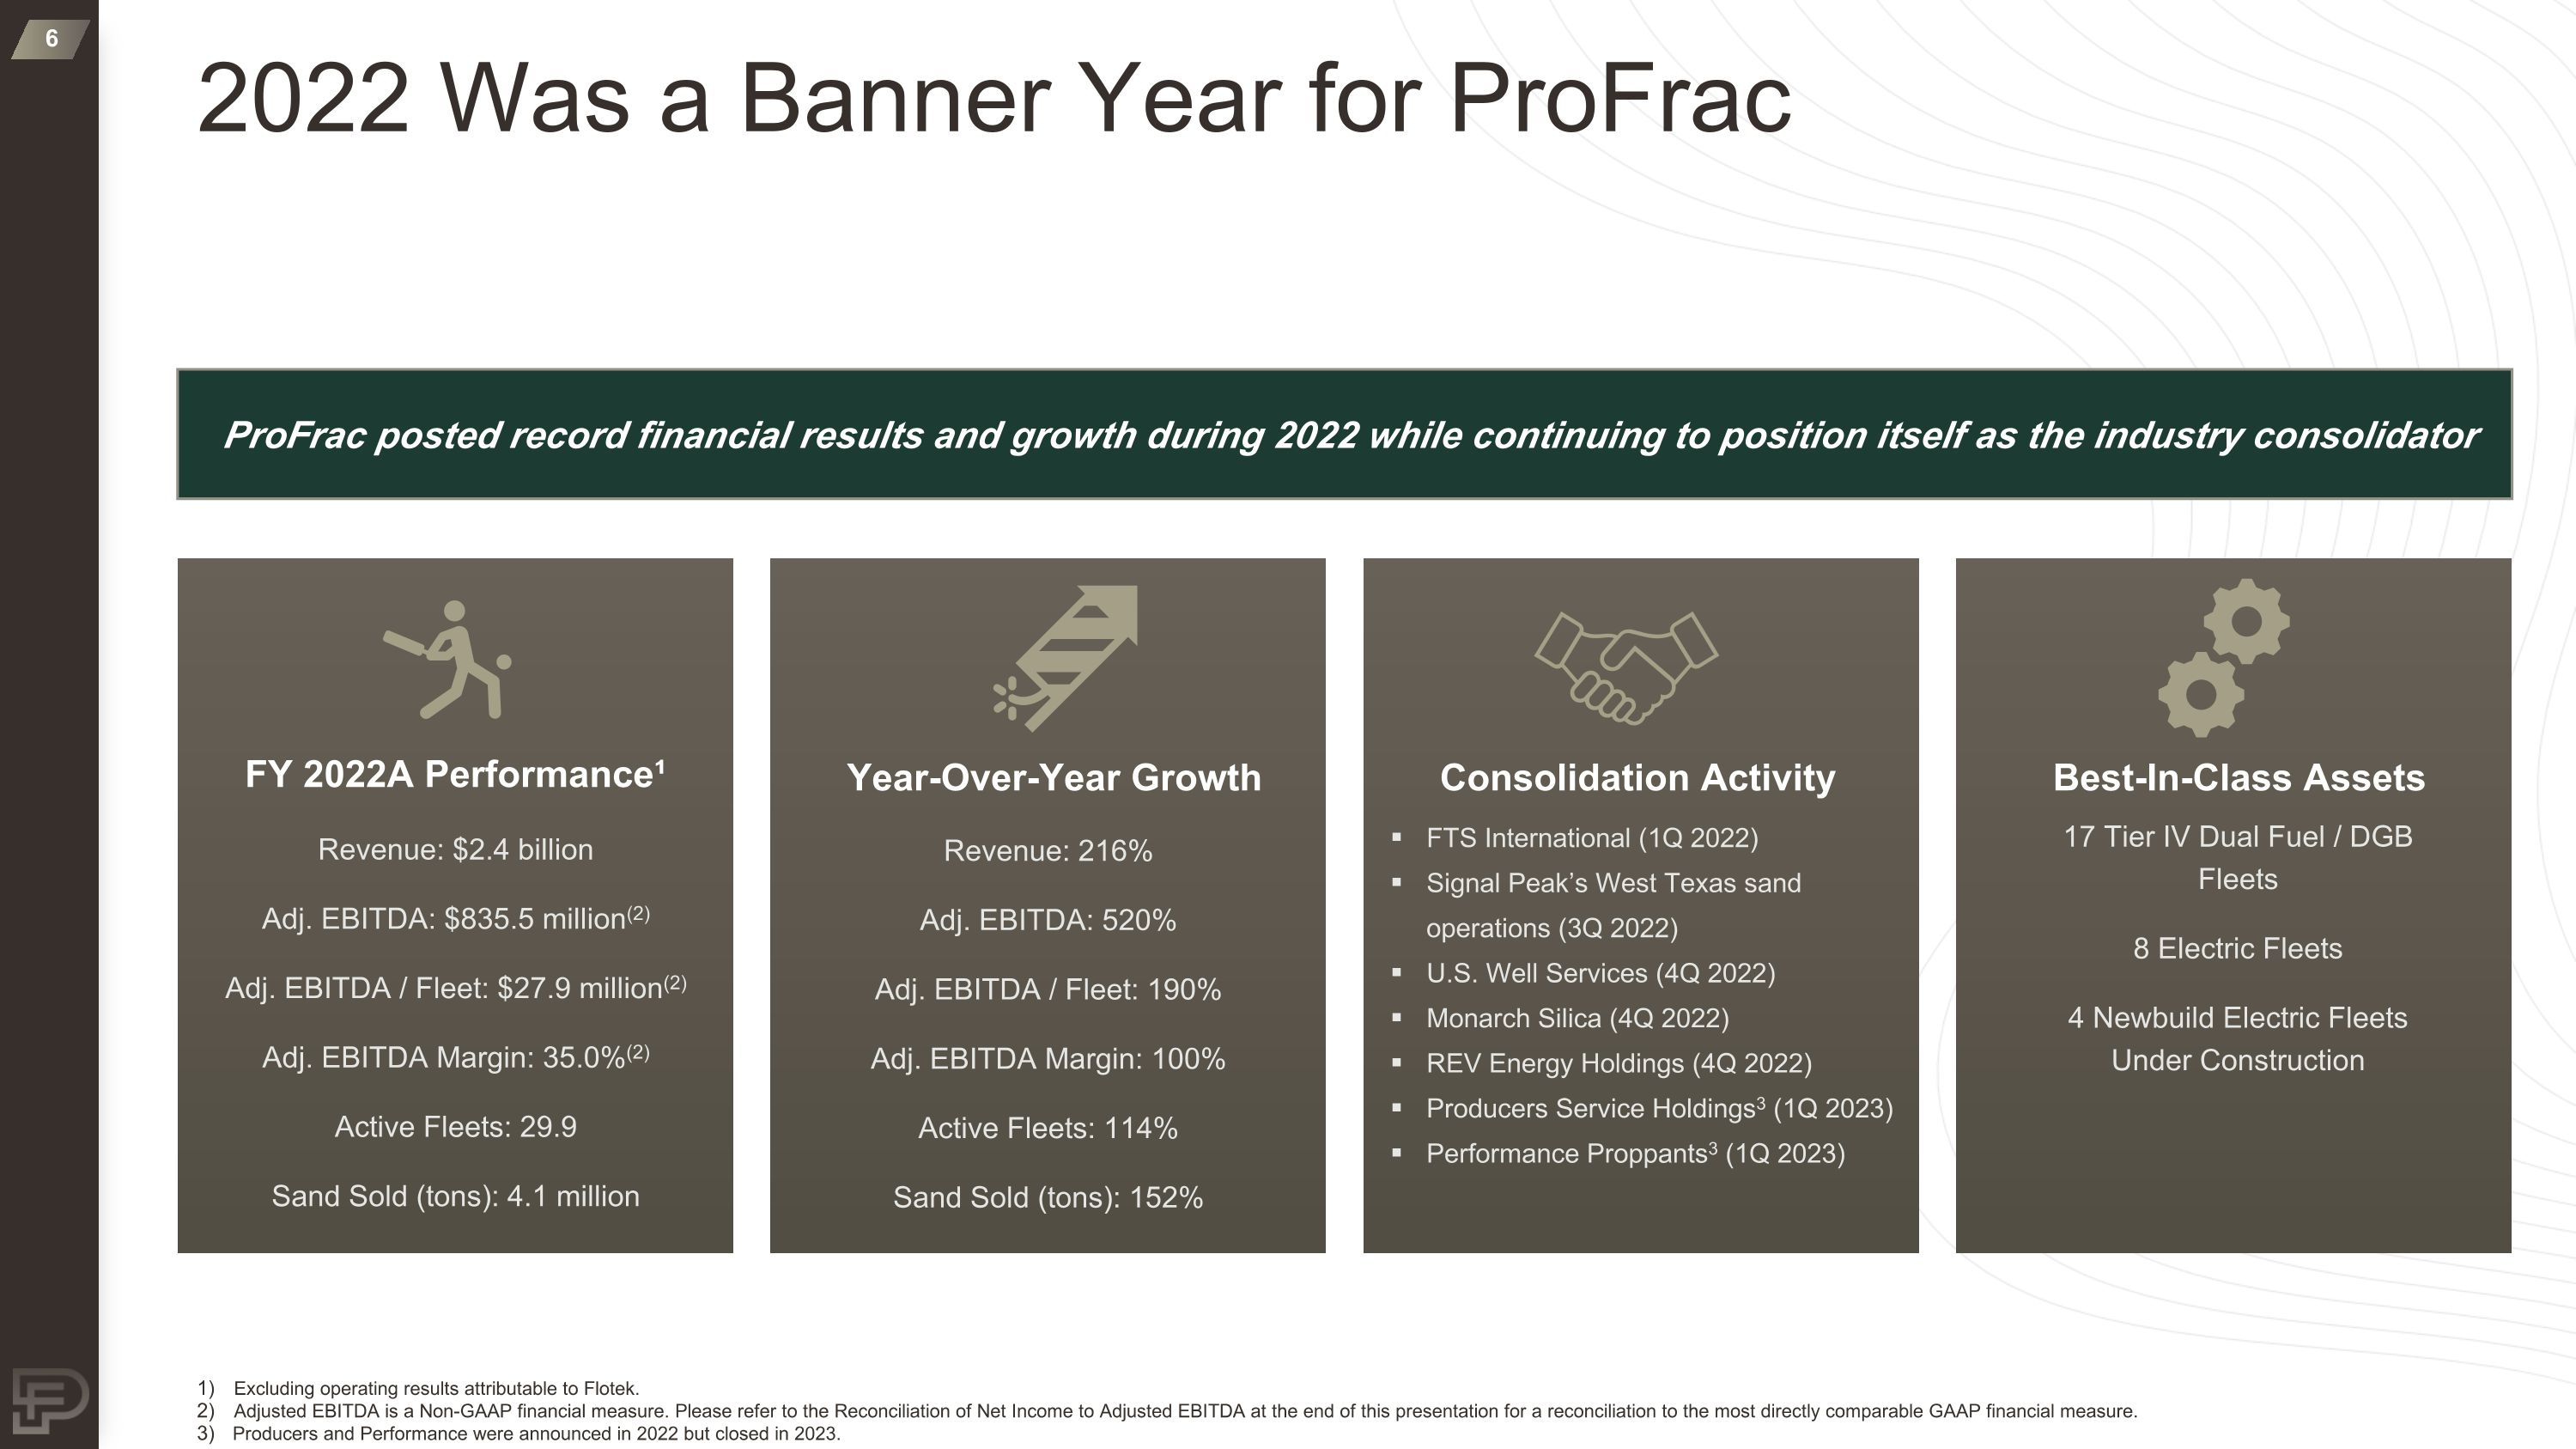
2022 Was a Banner Year for ProFrac Revenue: $2.4 billion Adj. EBITDA: $835.5 million(2) Adj. EBITDA / Fleet: $27.9 million(2) Adj. EBITDA Margin: 35.0%(2) Active Fleets: 29.9 Sand Sold (tons): 4.1 million Year-Over-Year Growth Revenue: 216% Adj. EBITDA: 520% Adj. EBITDA / Fleet: 190% Adj. EBITDA Margin: 100% Active Fleets: 114% Sand Sold (tons): 152% Consolidation Activity FTS International (1Q 2022) Signal Peak’s West Texas sand operations (3Q 2022) U.S. Well Services (4Q 2022) Monarch Silica (4Q 2022) REV Energy Holdings (4Q 2022) Producers Service Holdings3 (1Q 2023) Performance Proppants3 (1Q 2023) Best-In-Class Assets 17 Tier IV Dual Fuel / DGB Fleets 8 Electric Fleets 4 Newbuild Electric Fleets Under Construction FY 2022A Performance¹ Excluding operating results attributable to Flotek. Adjusted EBITDA is a Non-GAAP financial measure. Please refer to the Reconciliation of Net Income to Adjusted EBITDA at the end of this presentation for a reconciliation to the most directly comparable GAAP financial measure. Producers and Performance were announced in 2022 but closed in 2023. ProFrac posted record financial results and growth during 2022 while continuing to position itself as the industry consolidator
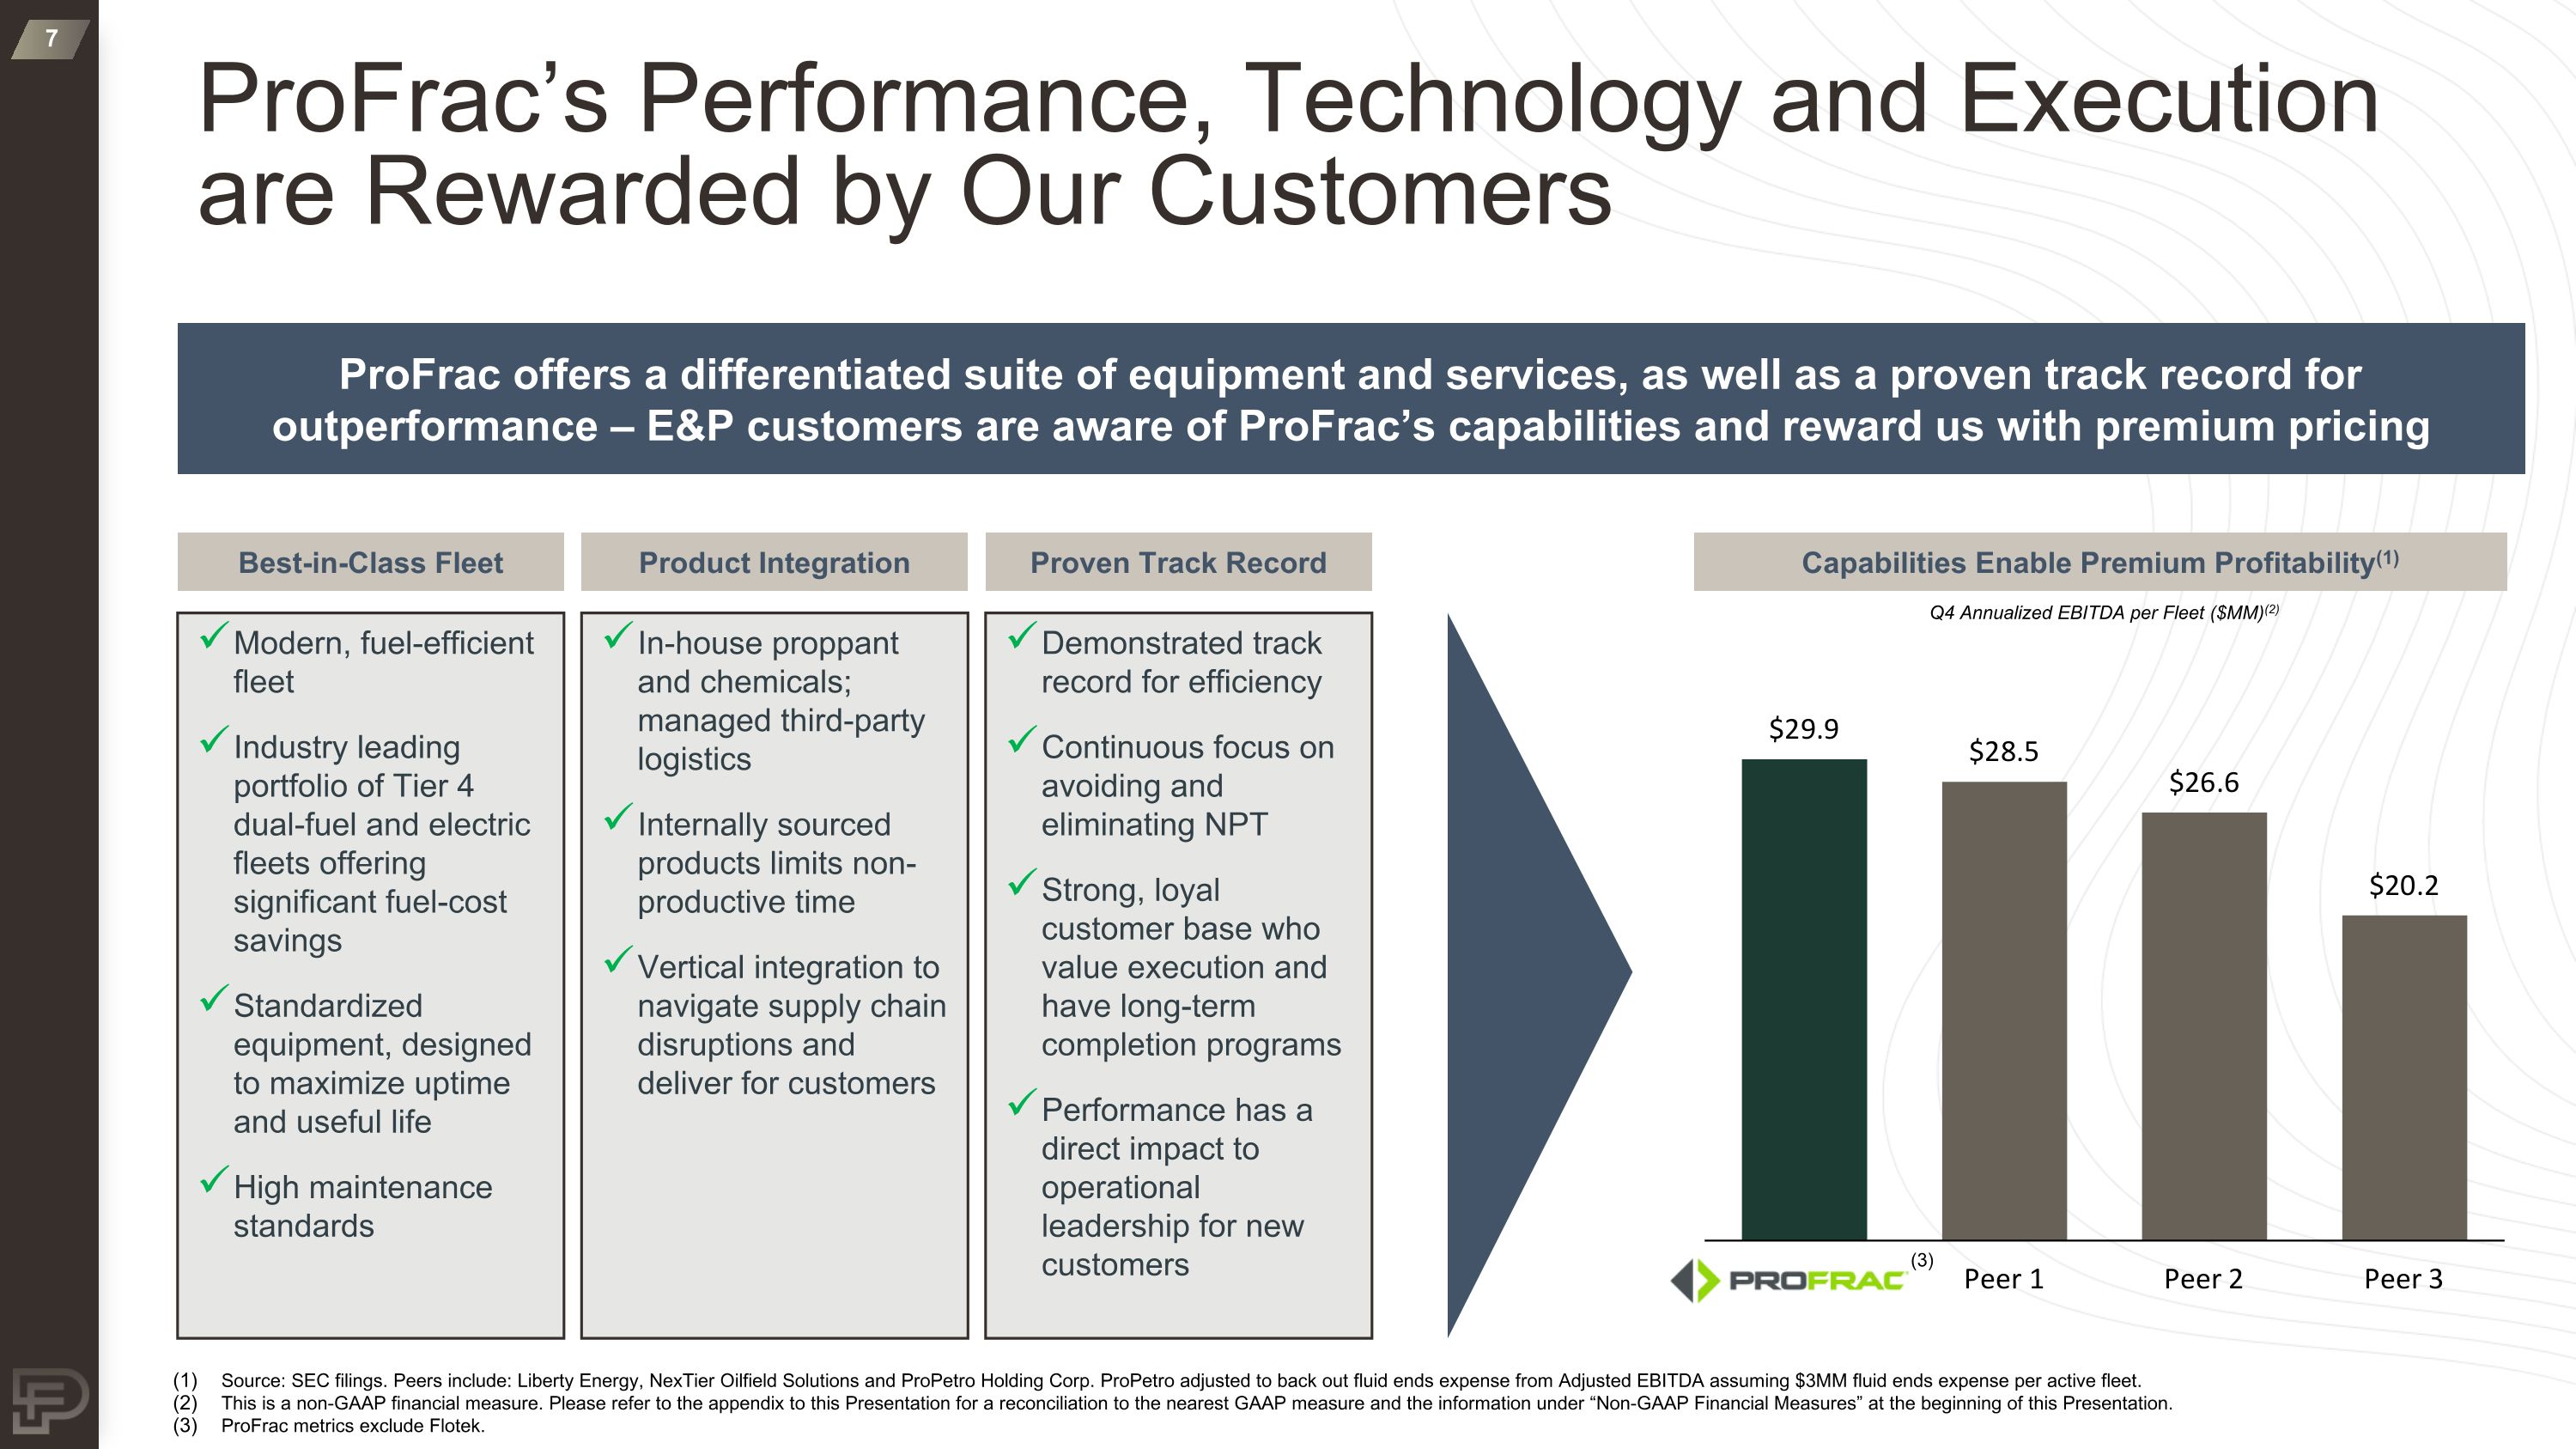
ProFrac’s Performance, Technology and Execution are Rewarded by Our Customers Best-in-Class Fleet Product Integration Proven Track Record Modern, fuel-efficient fleet Industry leading portfolio of Tier 4 dual-fuel and electric fleets offering significant fuel-cost savings Standardized equipment, designed to maximize uptime and useful life High maintenance standards In-house proppant and chemicals; managed third-party logistics Internally sourced products limits non-productive time Vertical integration to navigate supply chain disruptions and deliver for customers Demonstrated track record for efficiency Continuous focus on avoiding and eliminating NPT Strong, loyal customer base who value execution and have long-term completion programs Performance has a direct impact to operational leadership for new customers Capabilities Enable Premium Profitability(1) ProFrac offers a differentiated suite of equipment and services, as well as a proven track record for outperformance – E&P customers are aware of ProFrac’s capabilities and reward us with premium pricing Source: SEC filings. Peers include: Liberty Energy, NexTier Oilfield Solutions and ProPetro Holding Corp. ProPetro adjusted to back out fluid ends expense from Adjusted EBITDA assuming $3MM fluid ends expense per active fleet. This is a non-GAAP financial measure. Please refer to the appendix to this Presentation for a reconciliation to the nearest GAAP measure and the information under “Non-GAAP Financial Measures” at the beginning of this Presentation. ProFrac metrics exclude Flotek. Q4 Annualized EBITDA per Fleet ($MM)(2) (3)
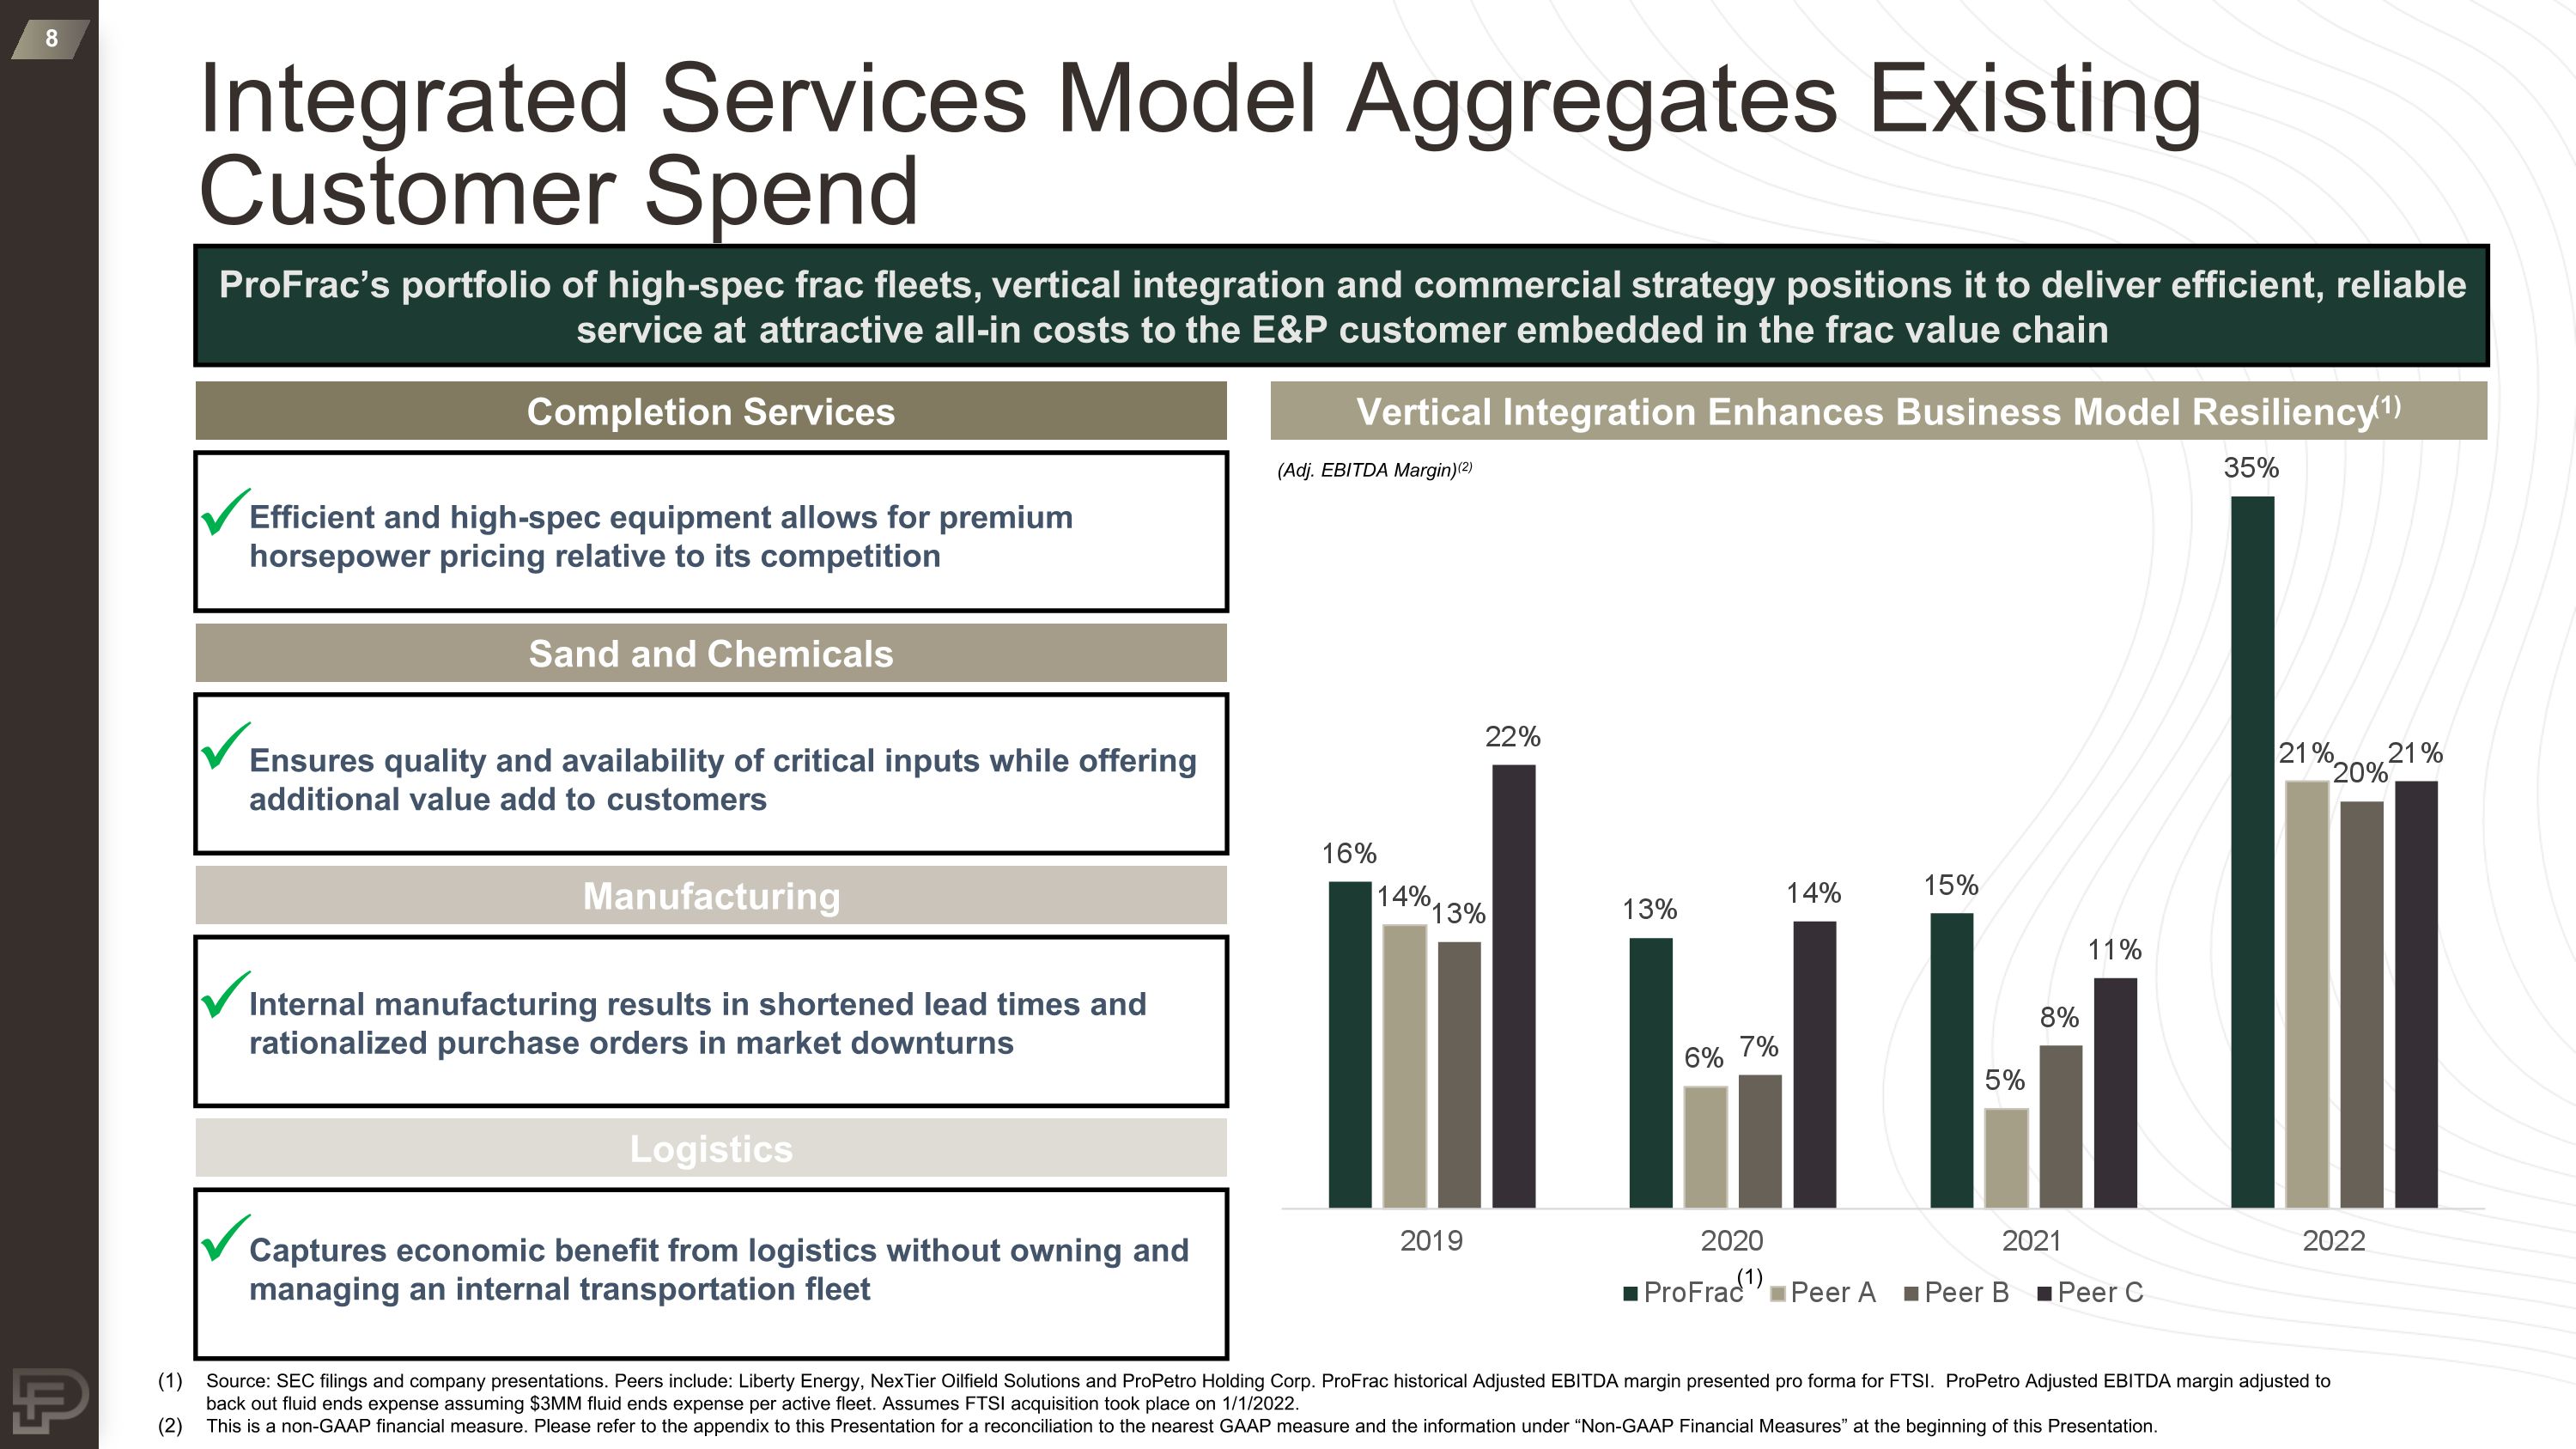
Integrated Services Model Aggregates Existing Customer Spend Completion Services Sand and Chemicals Logistics Efficient and high-spec equipment allows for premium horsepower pricing relative to its competition Ensures quality and availability of critical inputs while offering additional value add to customers Captures economic benefit from logistics without owning and managing an internal transportation fleet Manufacturing Internal manufacturing results in shortened lead times and rationalized purchase orders in market downturns (Adj. EBITDA Margin)(2) Vertical Integration Enhances Business Model Resiliency(1) ProFrac’s portfolio of high-spec frac fleets, vertical integration and commercial strategy positions it to deliver efficient, reliable service at attractive all-in costs to the E&P customer embedded in the frac value chain Source: SEC filings and company presentations. Peers include: Liberty Energy, NexTier Oilfield Solutions and ProPetro Holding Corp. ProFrac historical Adjusted EBITDA margin presented pro forma for FTSI. ProPetro Adjusted EBITDA margin adjusted to back out fluid ends expense assuming $3MM fluid ends expense per active fleet. Assumes FTSI acquisition took place on 1/1/2022. This is a non-GAAP financial measure. Please refer to the appendix to this Presentation for a reconciliation to the nearest GAAP measure and the information under “Non-GAAP Financial Measures” at the beginning of this Presentation. (1)
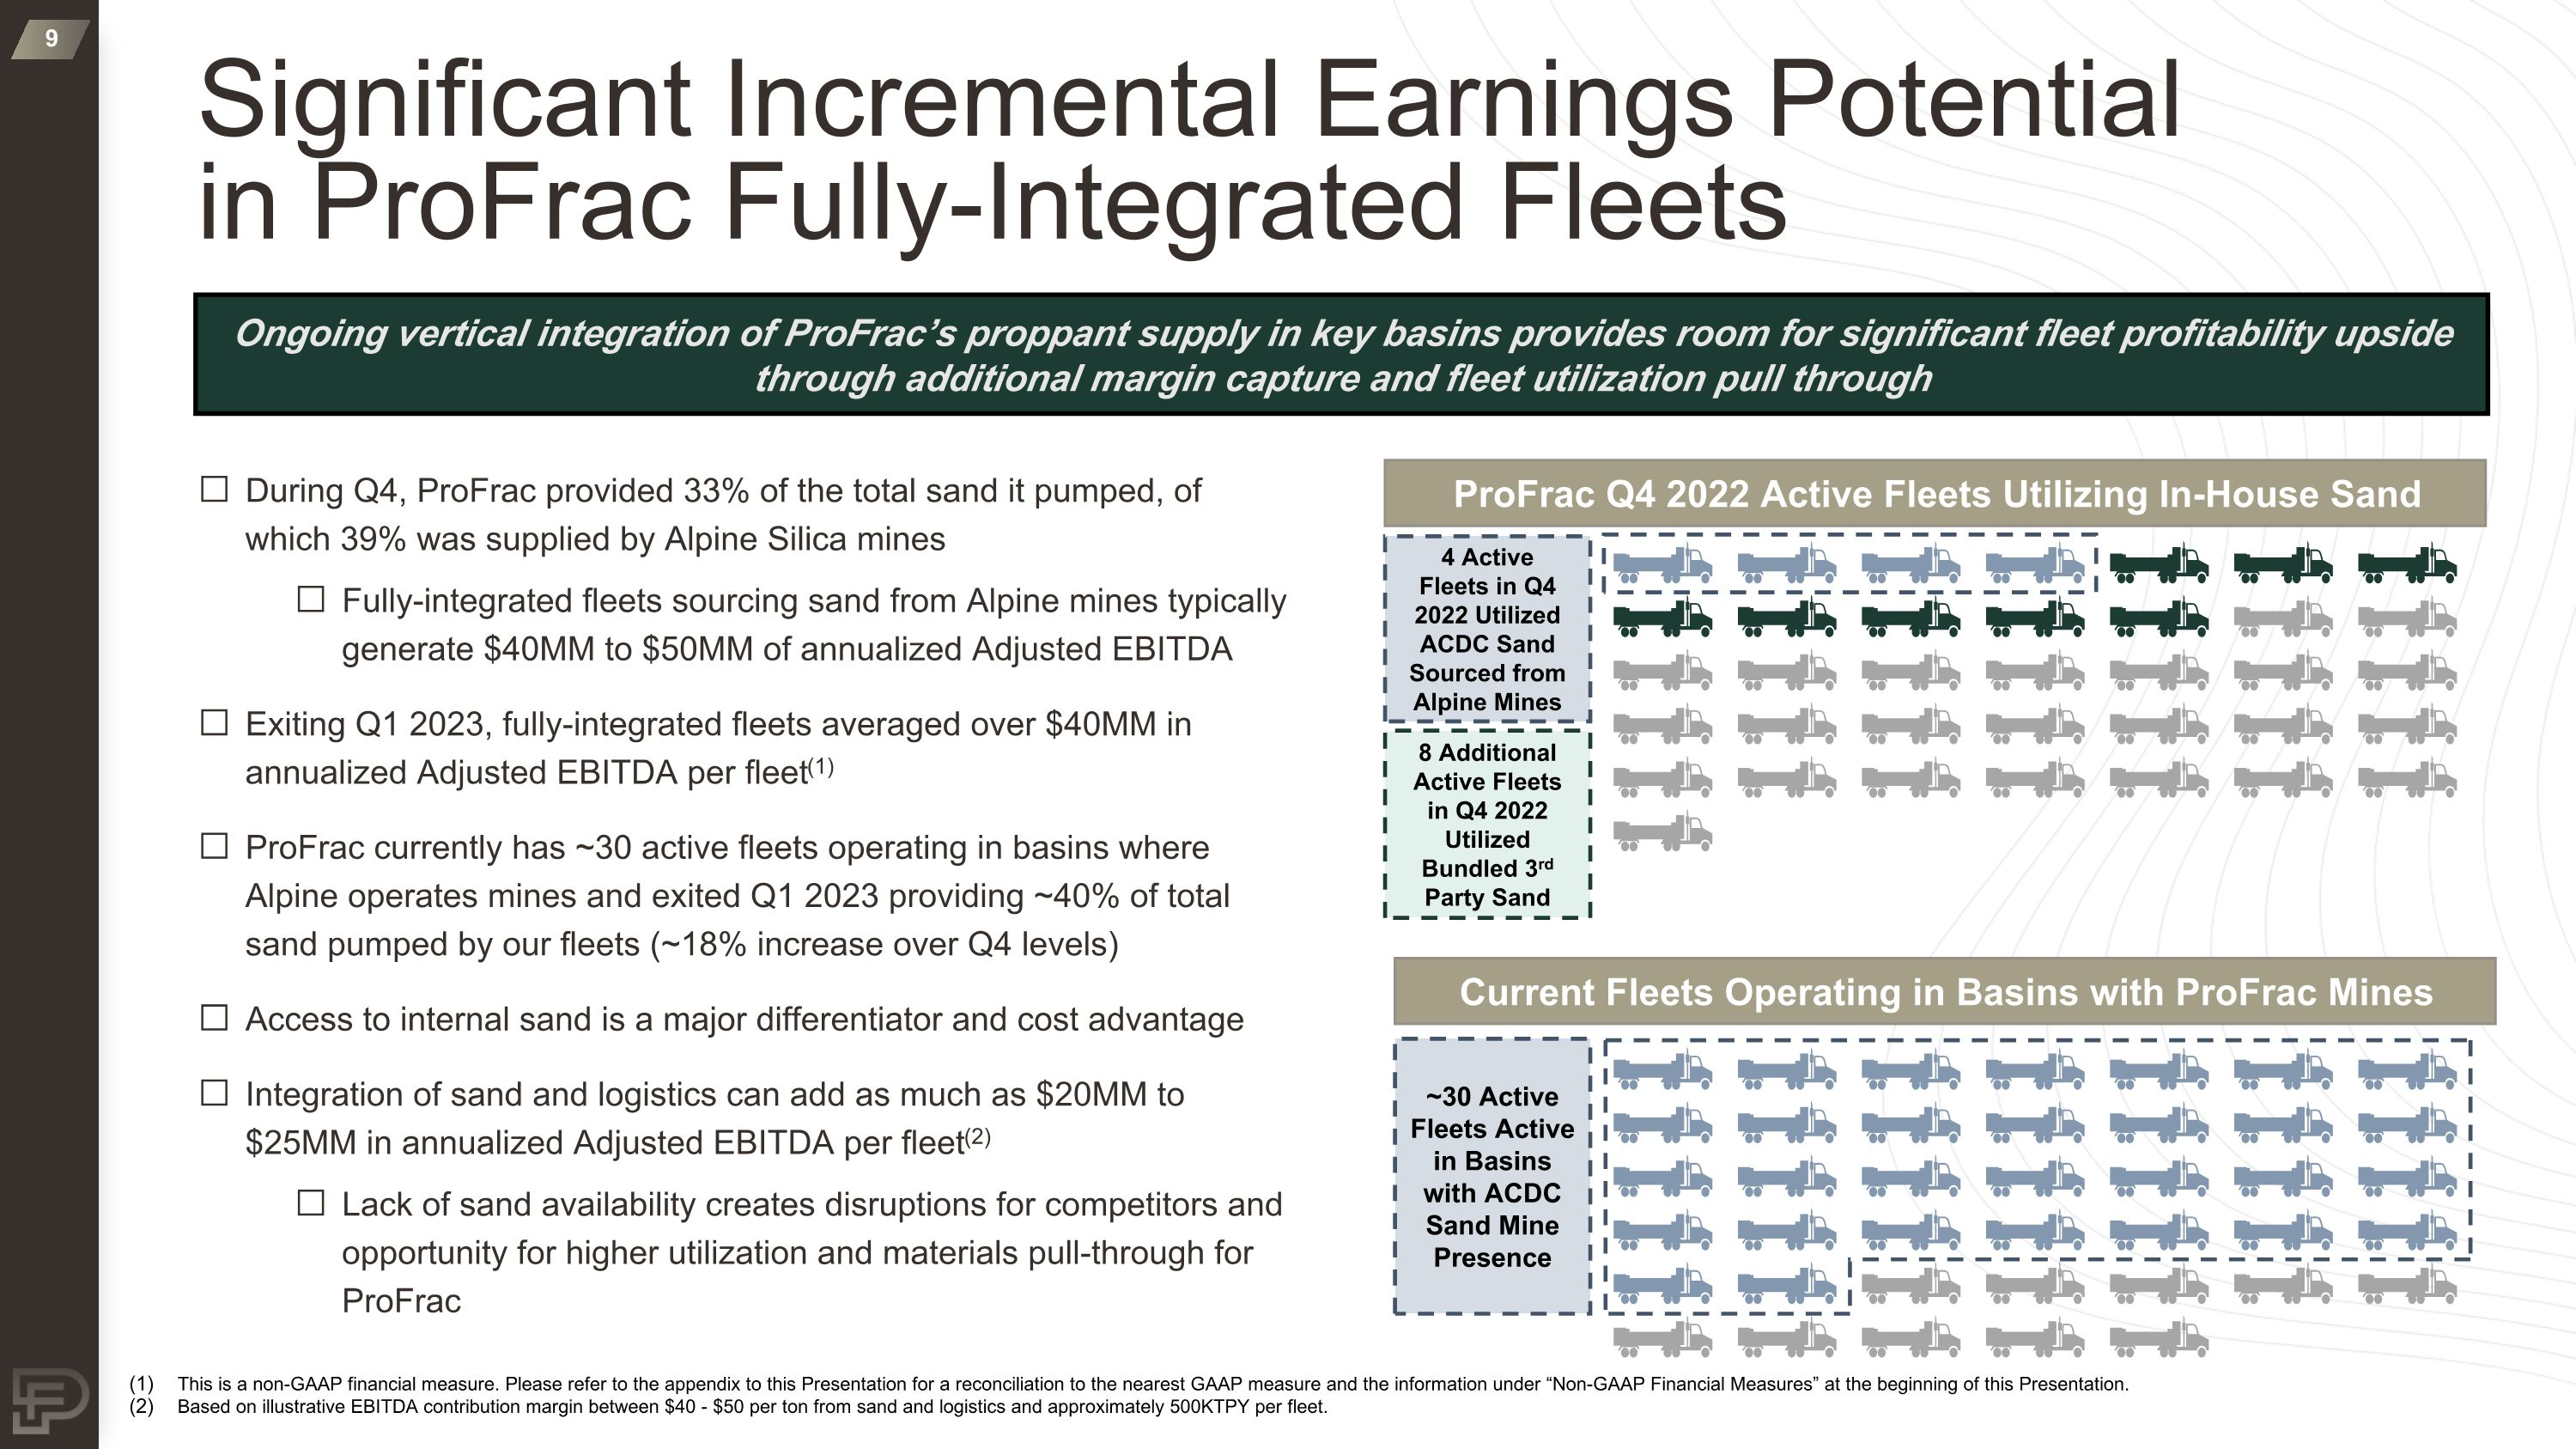
Significant Incremental Earnings Potential in ProFrac Fully-Integrated Fleets This is a non-GAAP financial measure. Please refer to the appendix to this Presentation for a reconciliation to the nearest GAAP measure and the information under “Non-GAAP Financial Measures” at the beginning of this Presentation. Based on illustrative EBITDA contribution margin between $40 - $50 per ton from sand and logistics and approximately 500KTPY per fleet. ProFrac Q4 2022 Active Fleets Utilizing In-House Sand Current Fleets Operating in Basins with ProFrac Mines 8 Additional Active Fleets in Q4 2022 Utilized Bundled 3rd Party Sand ~30 Active Fleets Active in Basins with ACDC Sand Mine Presence During Q4, ProFrac provided 33% of the total sand it pumped, of which 39% was supplied by Alpine Silica mines Fully-integrated fleets sourcing sand from Alpine mines typically generate $40MM to $50MM of annualized Adjusted EBITDA Exiting Q1 2023, fully-integrated fleets averaged over $40MM in annualized Adjusted EBITDA per fleet(1) ProFrac currently has ~30 active fleets operating in basins where Alpine operates mines and exited Q1 2023 providing ~40% of total sand pumped by our fleets (~18% increase over Q4 levels) Access to internal sand is a major differentiator and cost advantage Integration of sand and logistics can add as much as $20MM to $25MM in annualized Adjusted EBITDA per fleet(2) Lack of sand availability creates disruptions for competitors and opportunity for higher utilization and materials pull-through for ProFrac Ongoing vertical integration of ProFrac’s proppant supply in key basins provides room for significant fleet profitability upside through additional margin capture and fleet utilization pull through 4 Active Fleets in Q4 2022 Utilized ACDC Sand Sourced from Alpine Mines
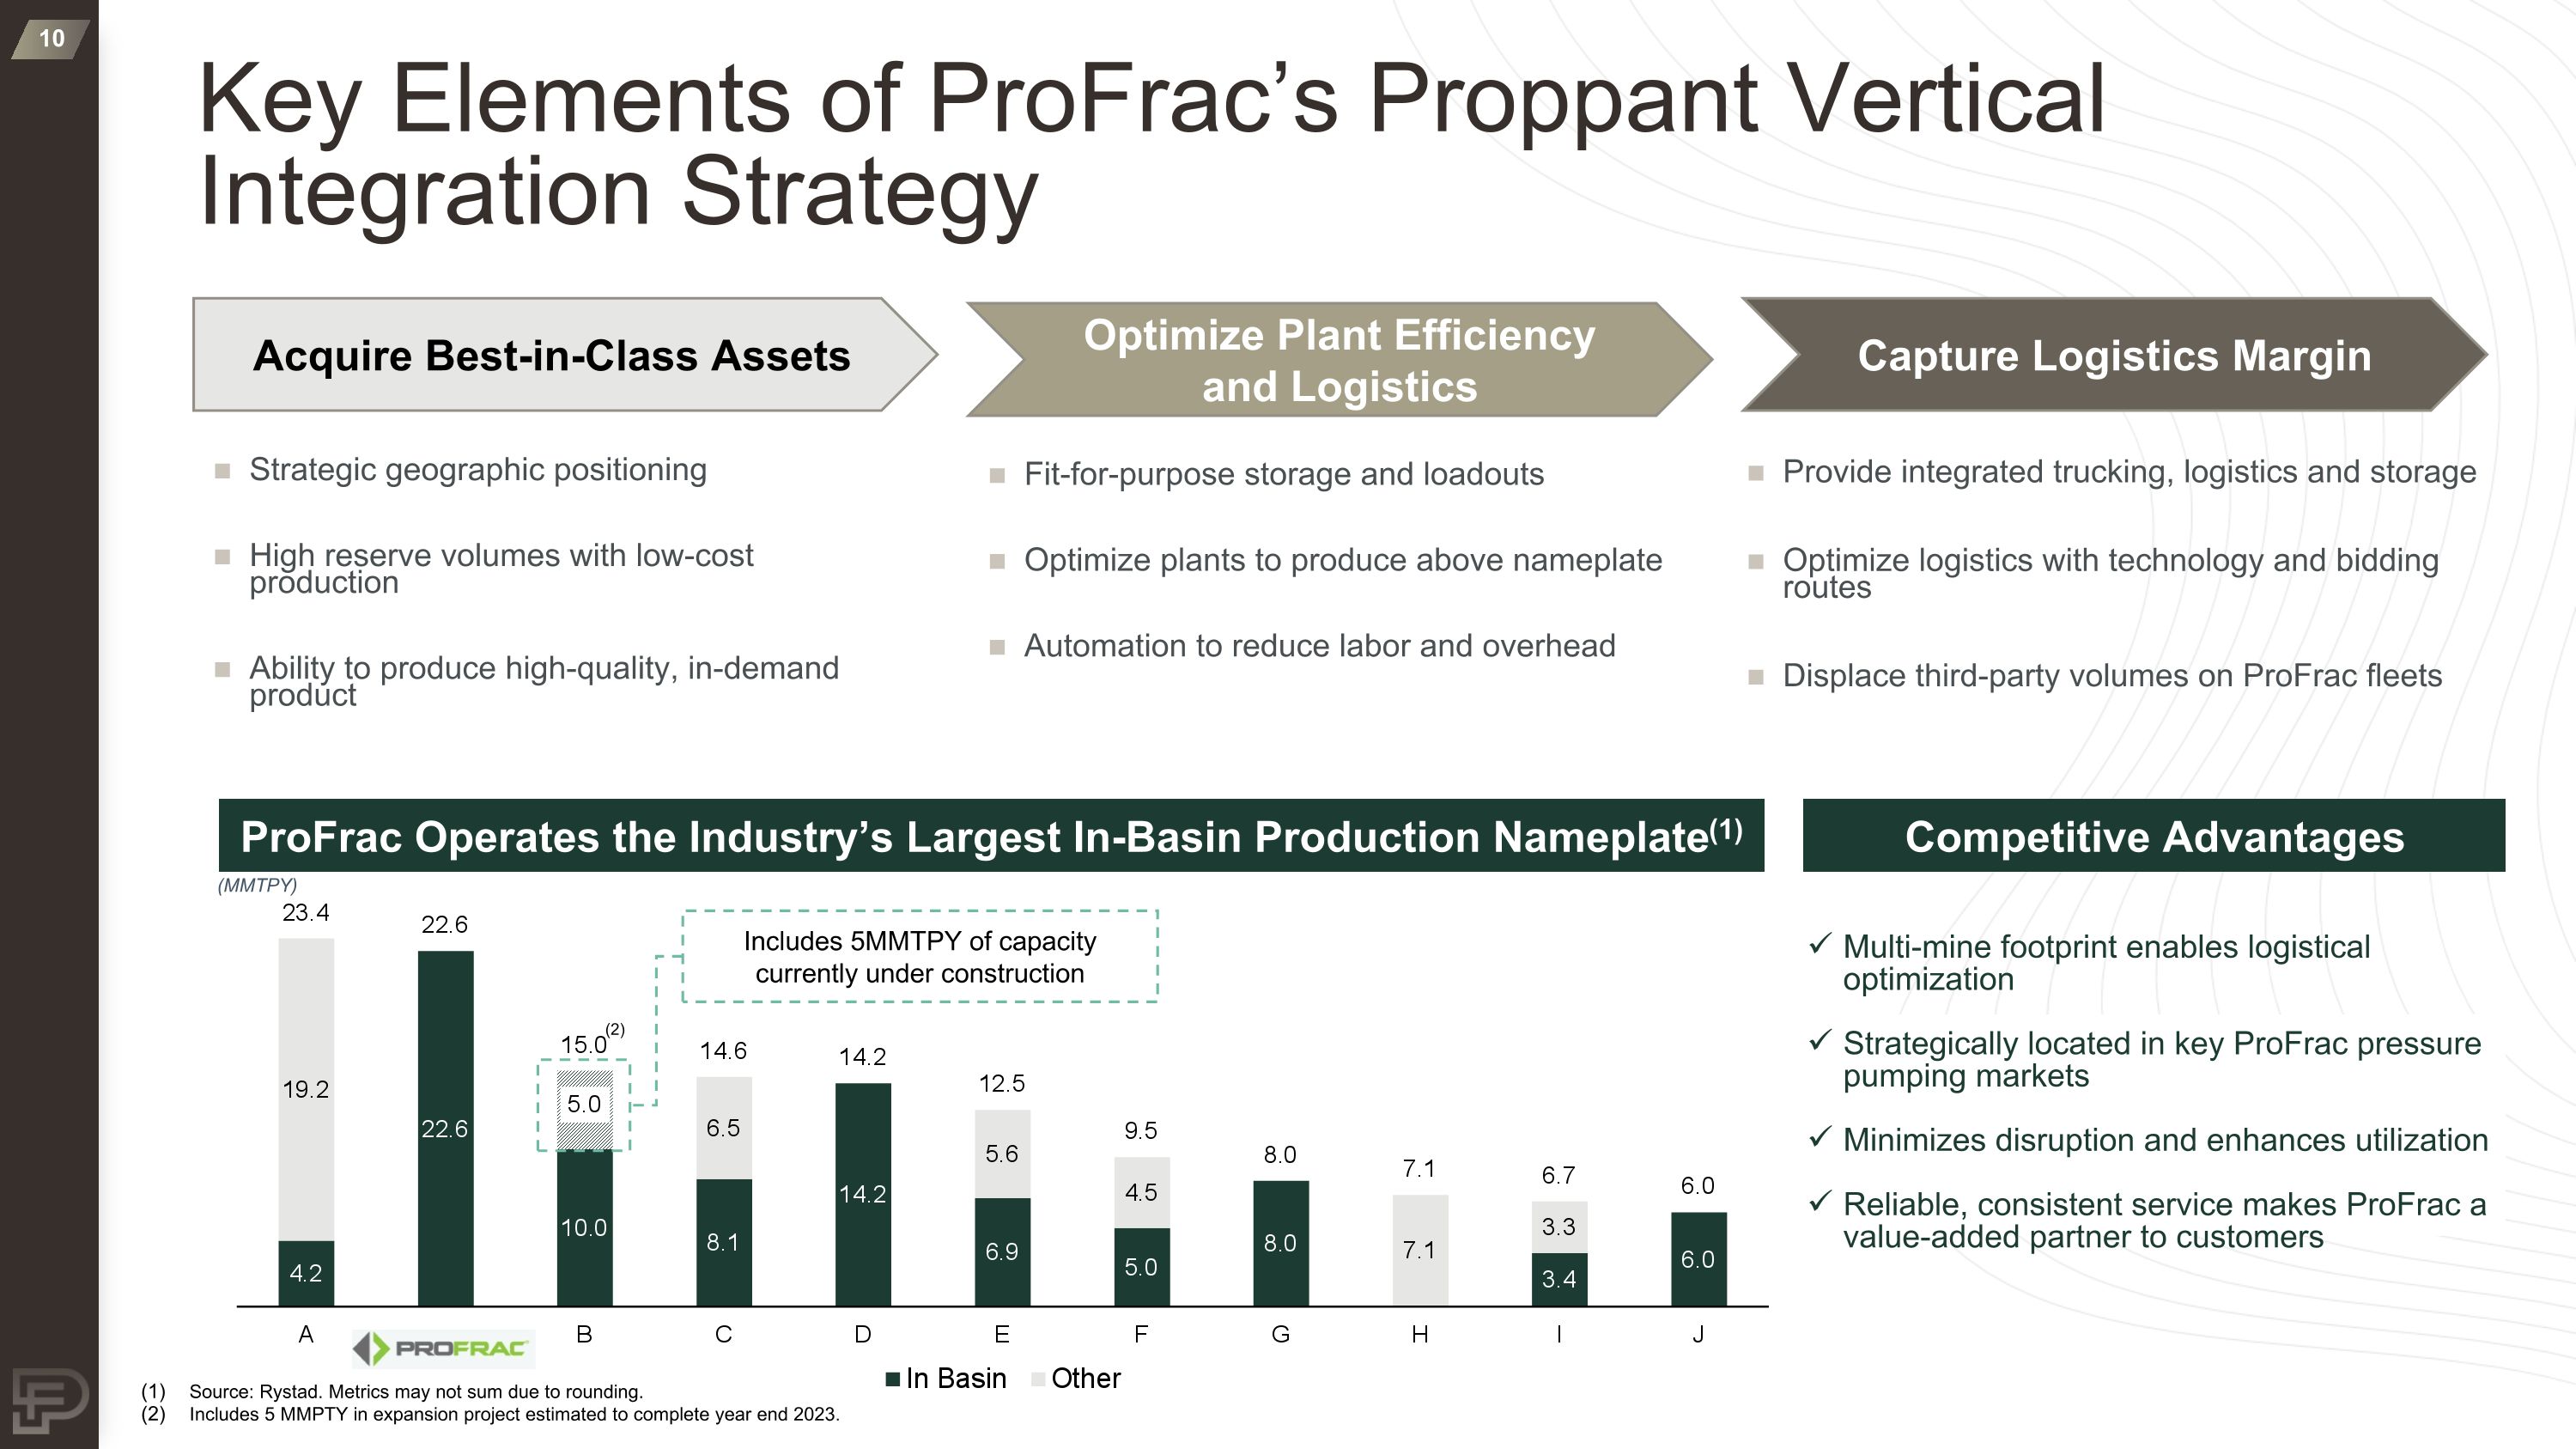
Key Elements of ProFrac’s Proppant Vertical Integration Strategy Acquire Best-in-Class Assets Optimize Plant Efficiency and Logistics Capture Logistics Margin Strategic geographic positioning High reserve volumes with low-cost production Ability to produce high-quality, in-demand product Fit-for-purpose storage and loadouts Optimize plants to produce above nameplate Automation to reduce labor and overhead Provide integrated trucking, logistics and storage Optimize logistics with technology and bidding routes Displace third-party volumes on ProFrac fleets ProFrac Operates the Industry’s Largest In-Basin Production Nameplate(1) Multi-mine footprint enables logistical optimization Strategically located in key ProFrac pressure pumping markets Minimizes disruption and enhances utilization Reliable, consistent service makes ProFrac a value-added partner to customers Competitive Advantages (MMTPY) Source: Rystad. Metrics may not sum due to rounding. Includes 5 MMPTY in expansion project estimated to complete year end 2023. (2) Includes 5MMTPY of capacity currently under construction
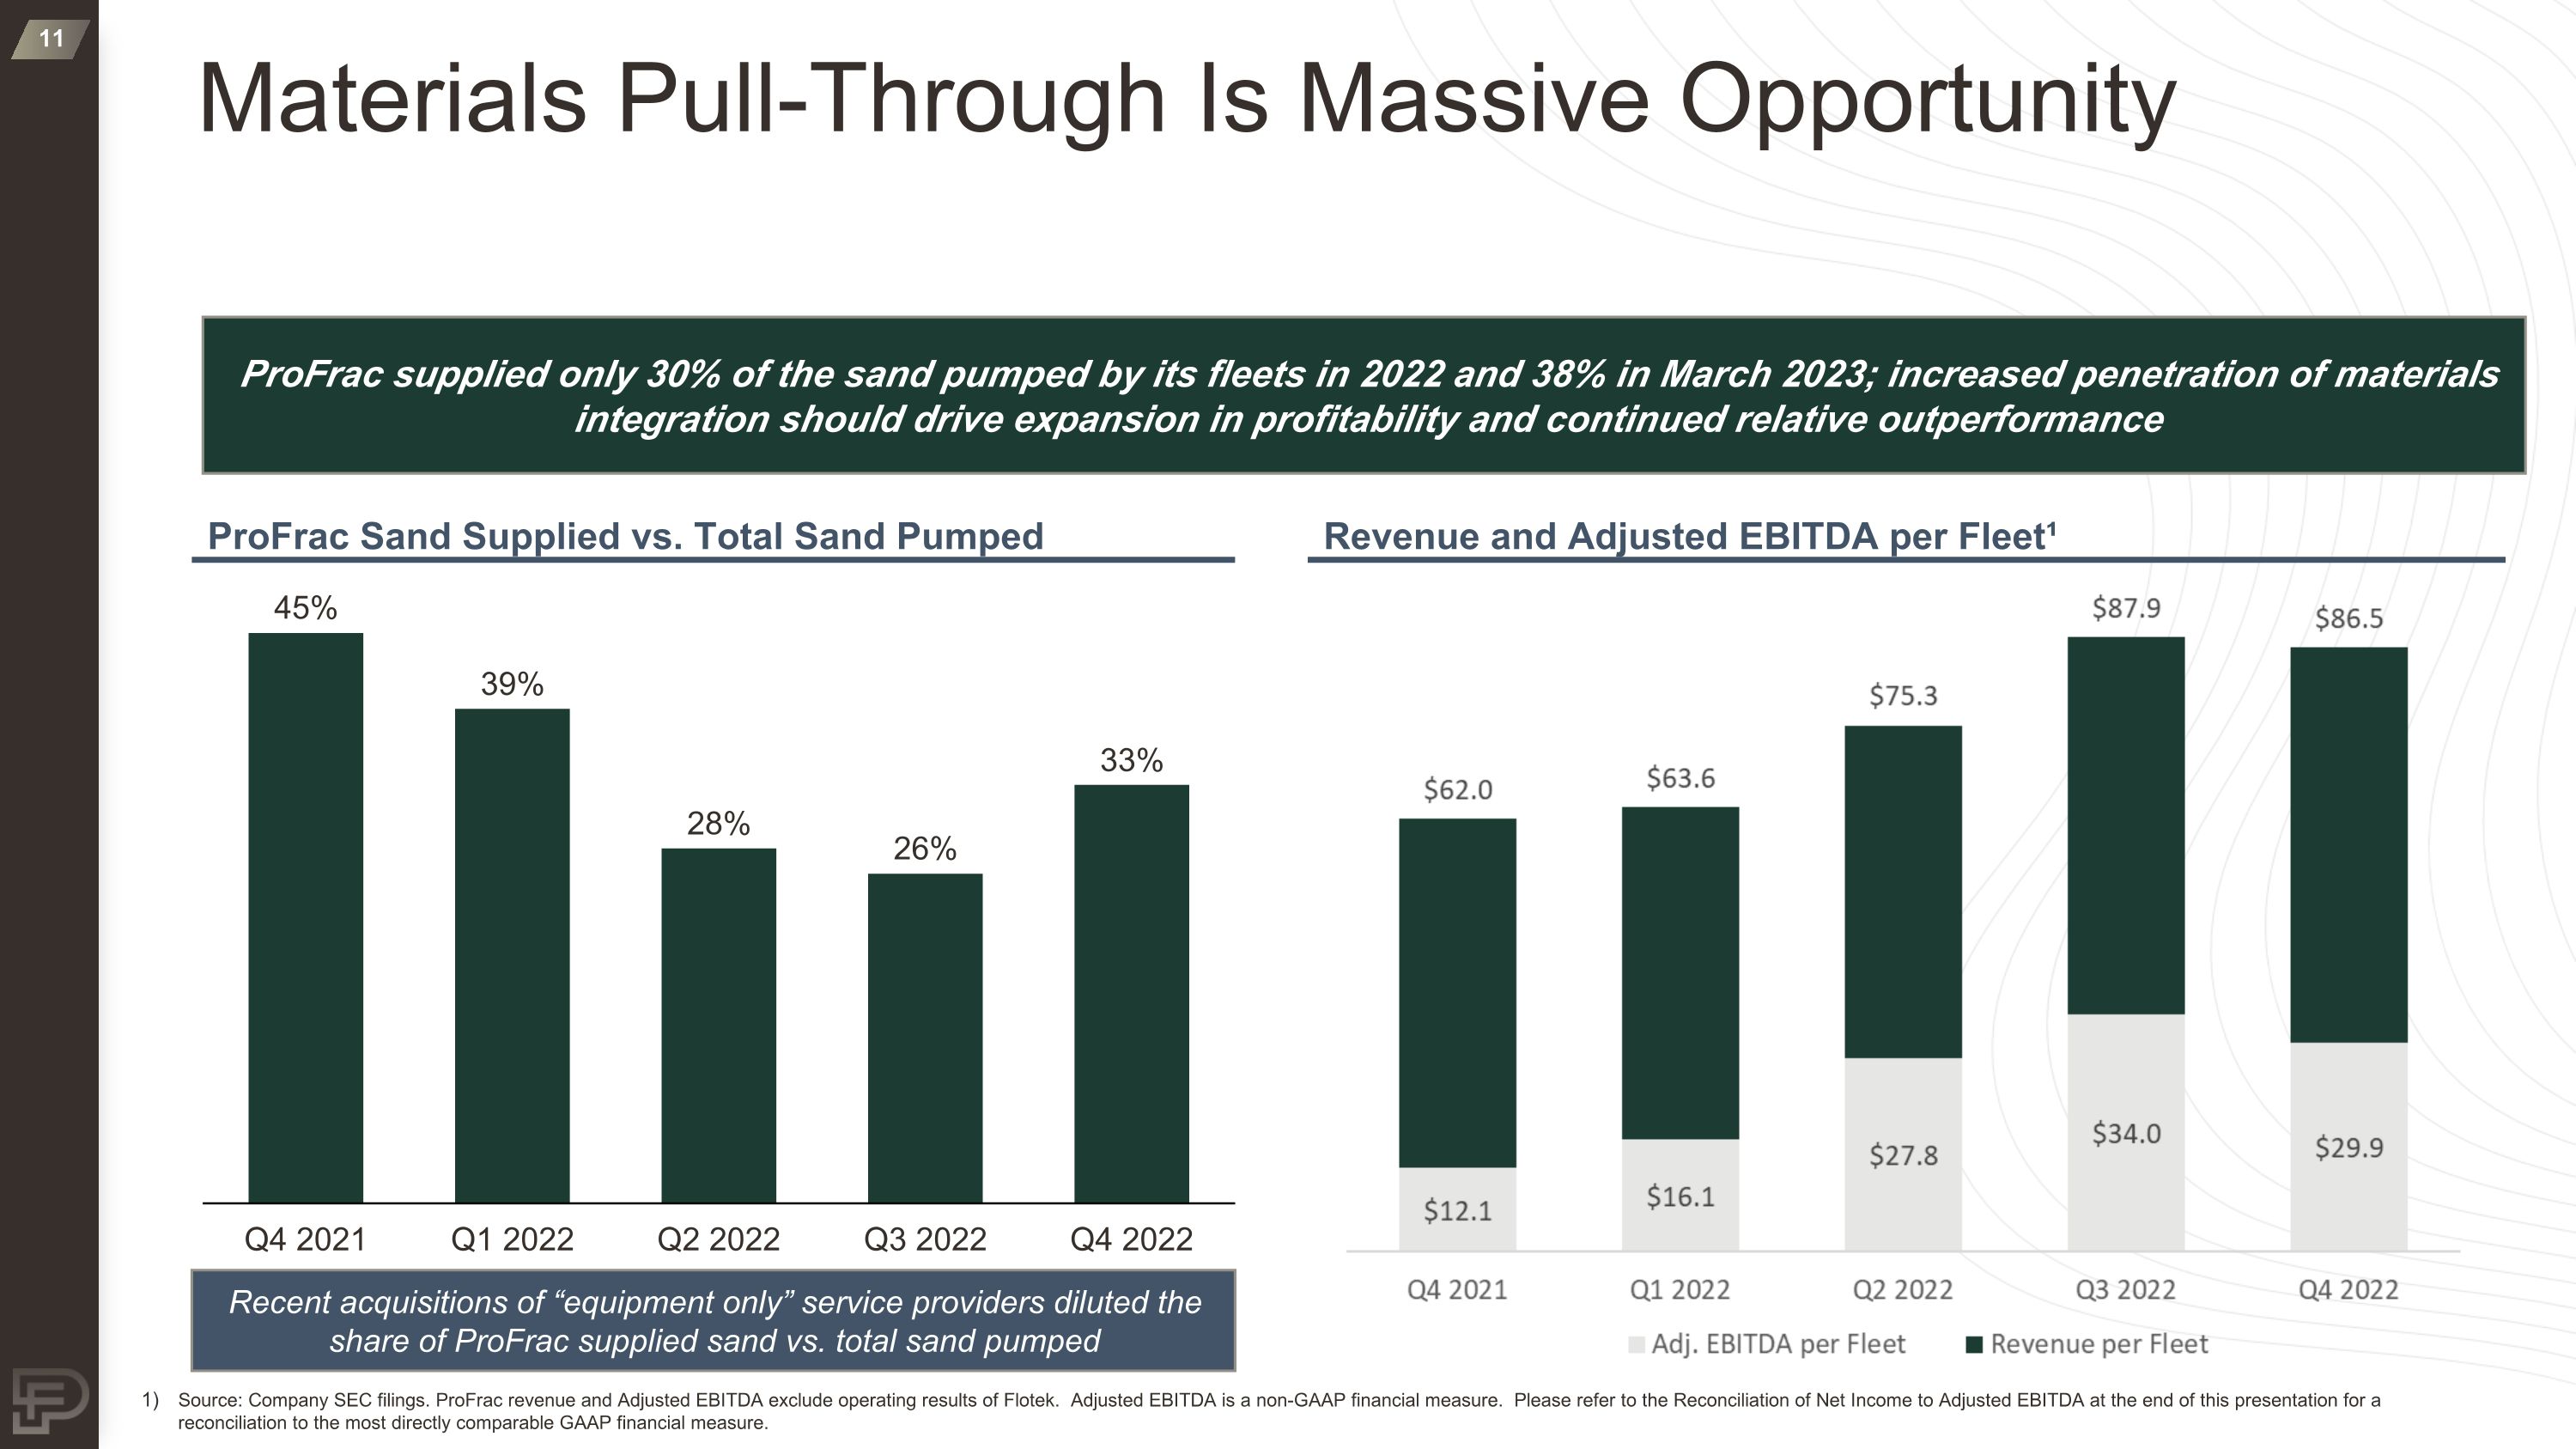
Materials Pull-Through Is Massive Opportunity ProFrac supplied only 30% of the sand pumped by its fleets in 2022 and 38% in March 2023; increased penetration of materials integration should drive expansion in profitability and continued relative outperformance ProFrac Sand Supplied vs. Total Sand Pumped Revenue and Adjusted EBITDA per Fleet¹ Q4 2021 Q1 2022 Q2 2022 Q3 2022 Q4 2022 Recent acquisitions of “equipment only” service providers diluted the share of ProFrac supplied sand vs. total sand pumped Source: Company SEC filings. ProFrac revenue and Adjusted EBITDA exclude operating results of Flotek. Adjusted EBITDA is a non-GAAP financial measure. Please refer to the Reconciliation of Net Income to Adjusted EBITDA at the end of this presentation for a reconciliation to the most directly comparable GAAP financial measure.
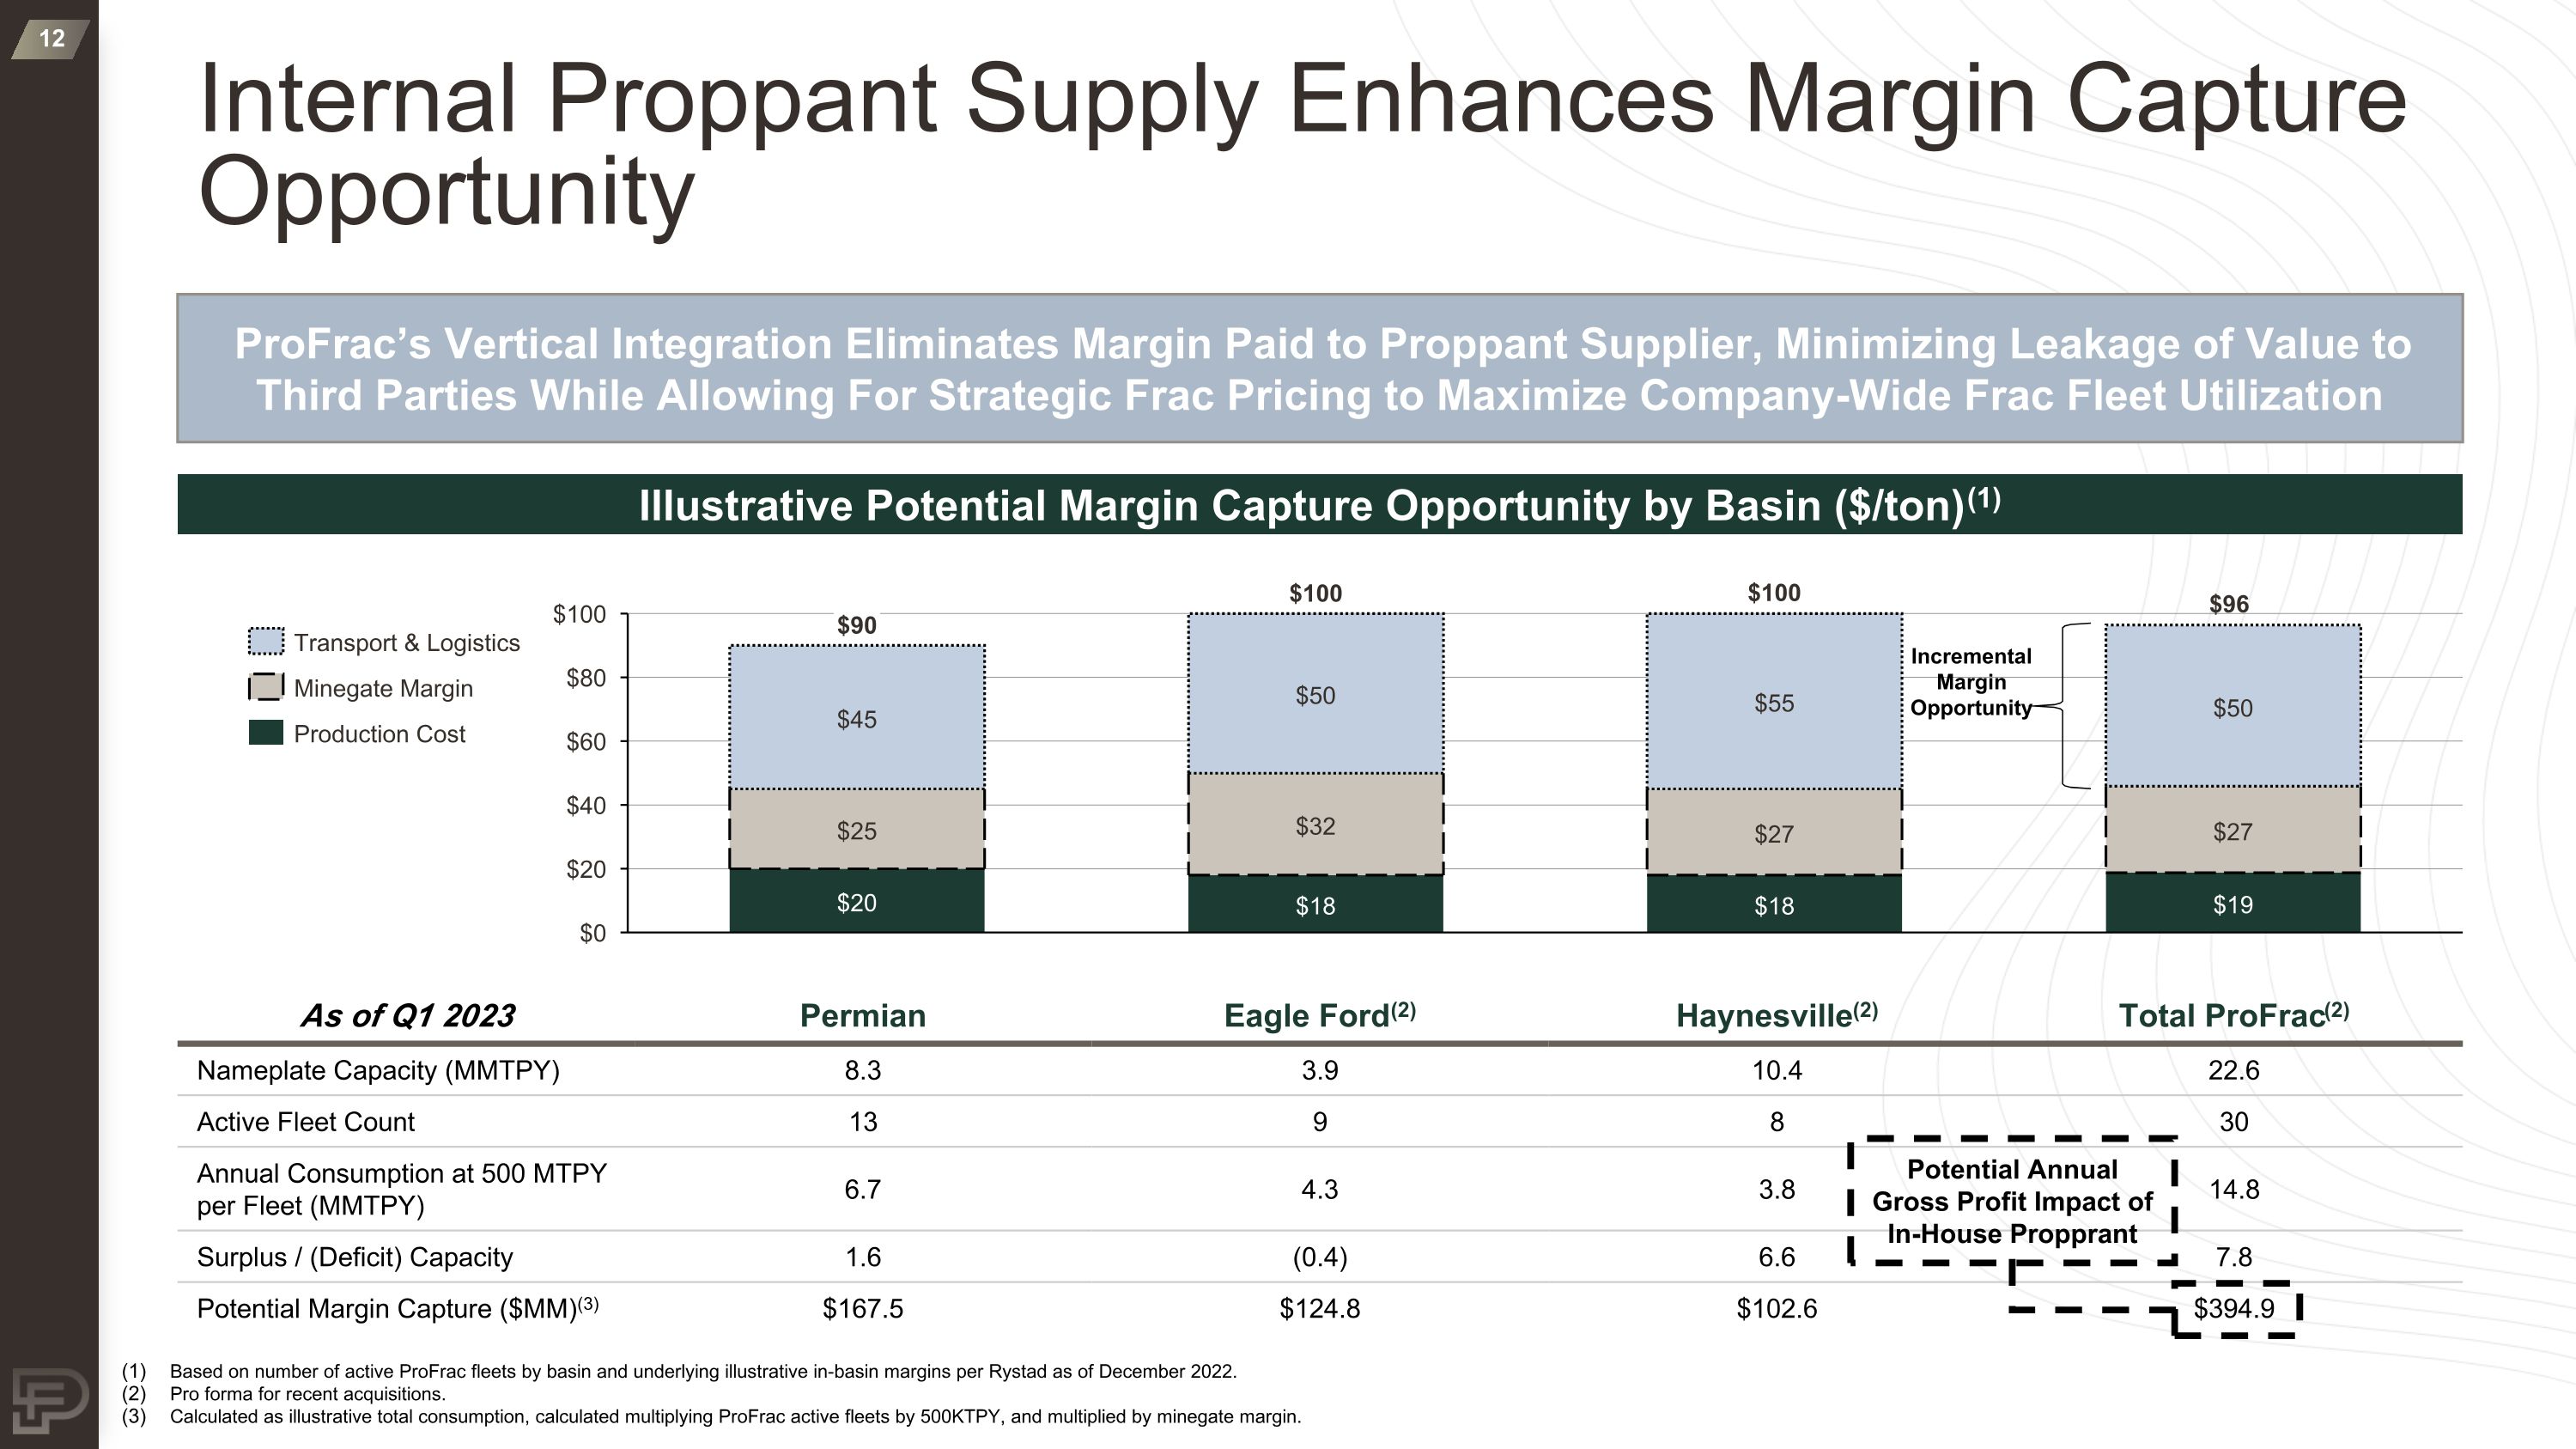
Internal Proppant Supply Enhances Margin Capture Opportunity Illustrative Potential Margin Capture Opportunity by Basin ($/ton)(1) As of Q1 2023 Permian Eagle Ford(2) Haynesville(2) Total ProFrac(2) Nameplate Capacity (MMTPY) 8.3 3.9 10.4 22.6 Active Fleet Count 13 9 8 30 Annual Consumption at 500 MTPY per Fleet (MMTPY) 6.7 4.3 3.8 14.8 Surplus / (Deficit) Capacity 1.6 (0.4) 6.6 7.8 Potential Margin Capture ($MM)(3) $167.5 $124.8 $102.6 $394.9 $100 $100 $90 $96 Transport & Logistics Minegate Margin Production Cost Incremental Margin Opportunity Based on number of active ProFrac fleets by basin and underlying illustrative in-basin margins per Rystad as of December 2022. Pro forma for recent acquisitions. Calculated as illustrative total consumption, calculated multiplying ProFrac active fleets by 500KTPY, and multiplied by minegate margin. Potential Annual Gross Profit Impact of In-House Propprant ProFrac’s Vertical Integration Eliminates Margin Paid to Proppant Supplier, Minimizing Leakage of Value to Third Parties While Allowing For Strategic Frac Pricing to Maximize Company-Wide Frac Fleet Utilization
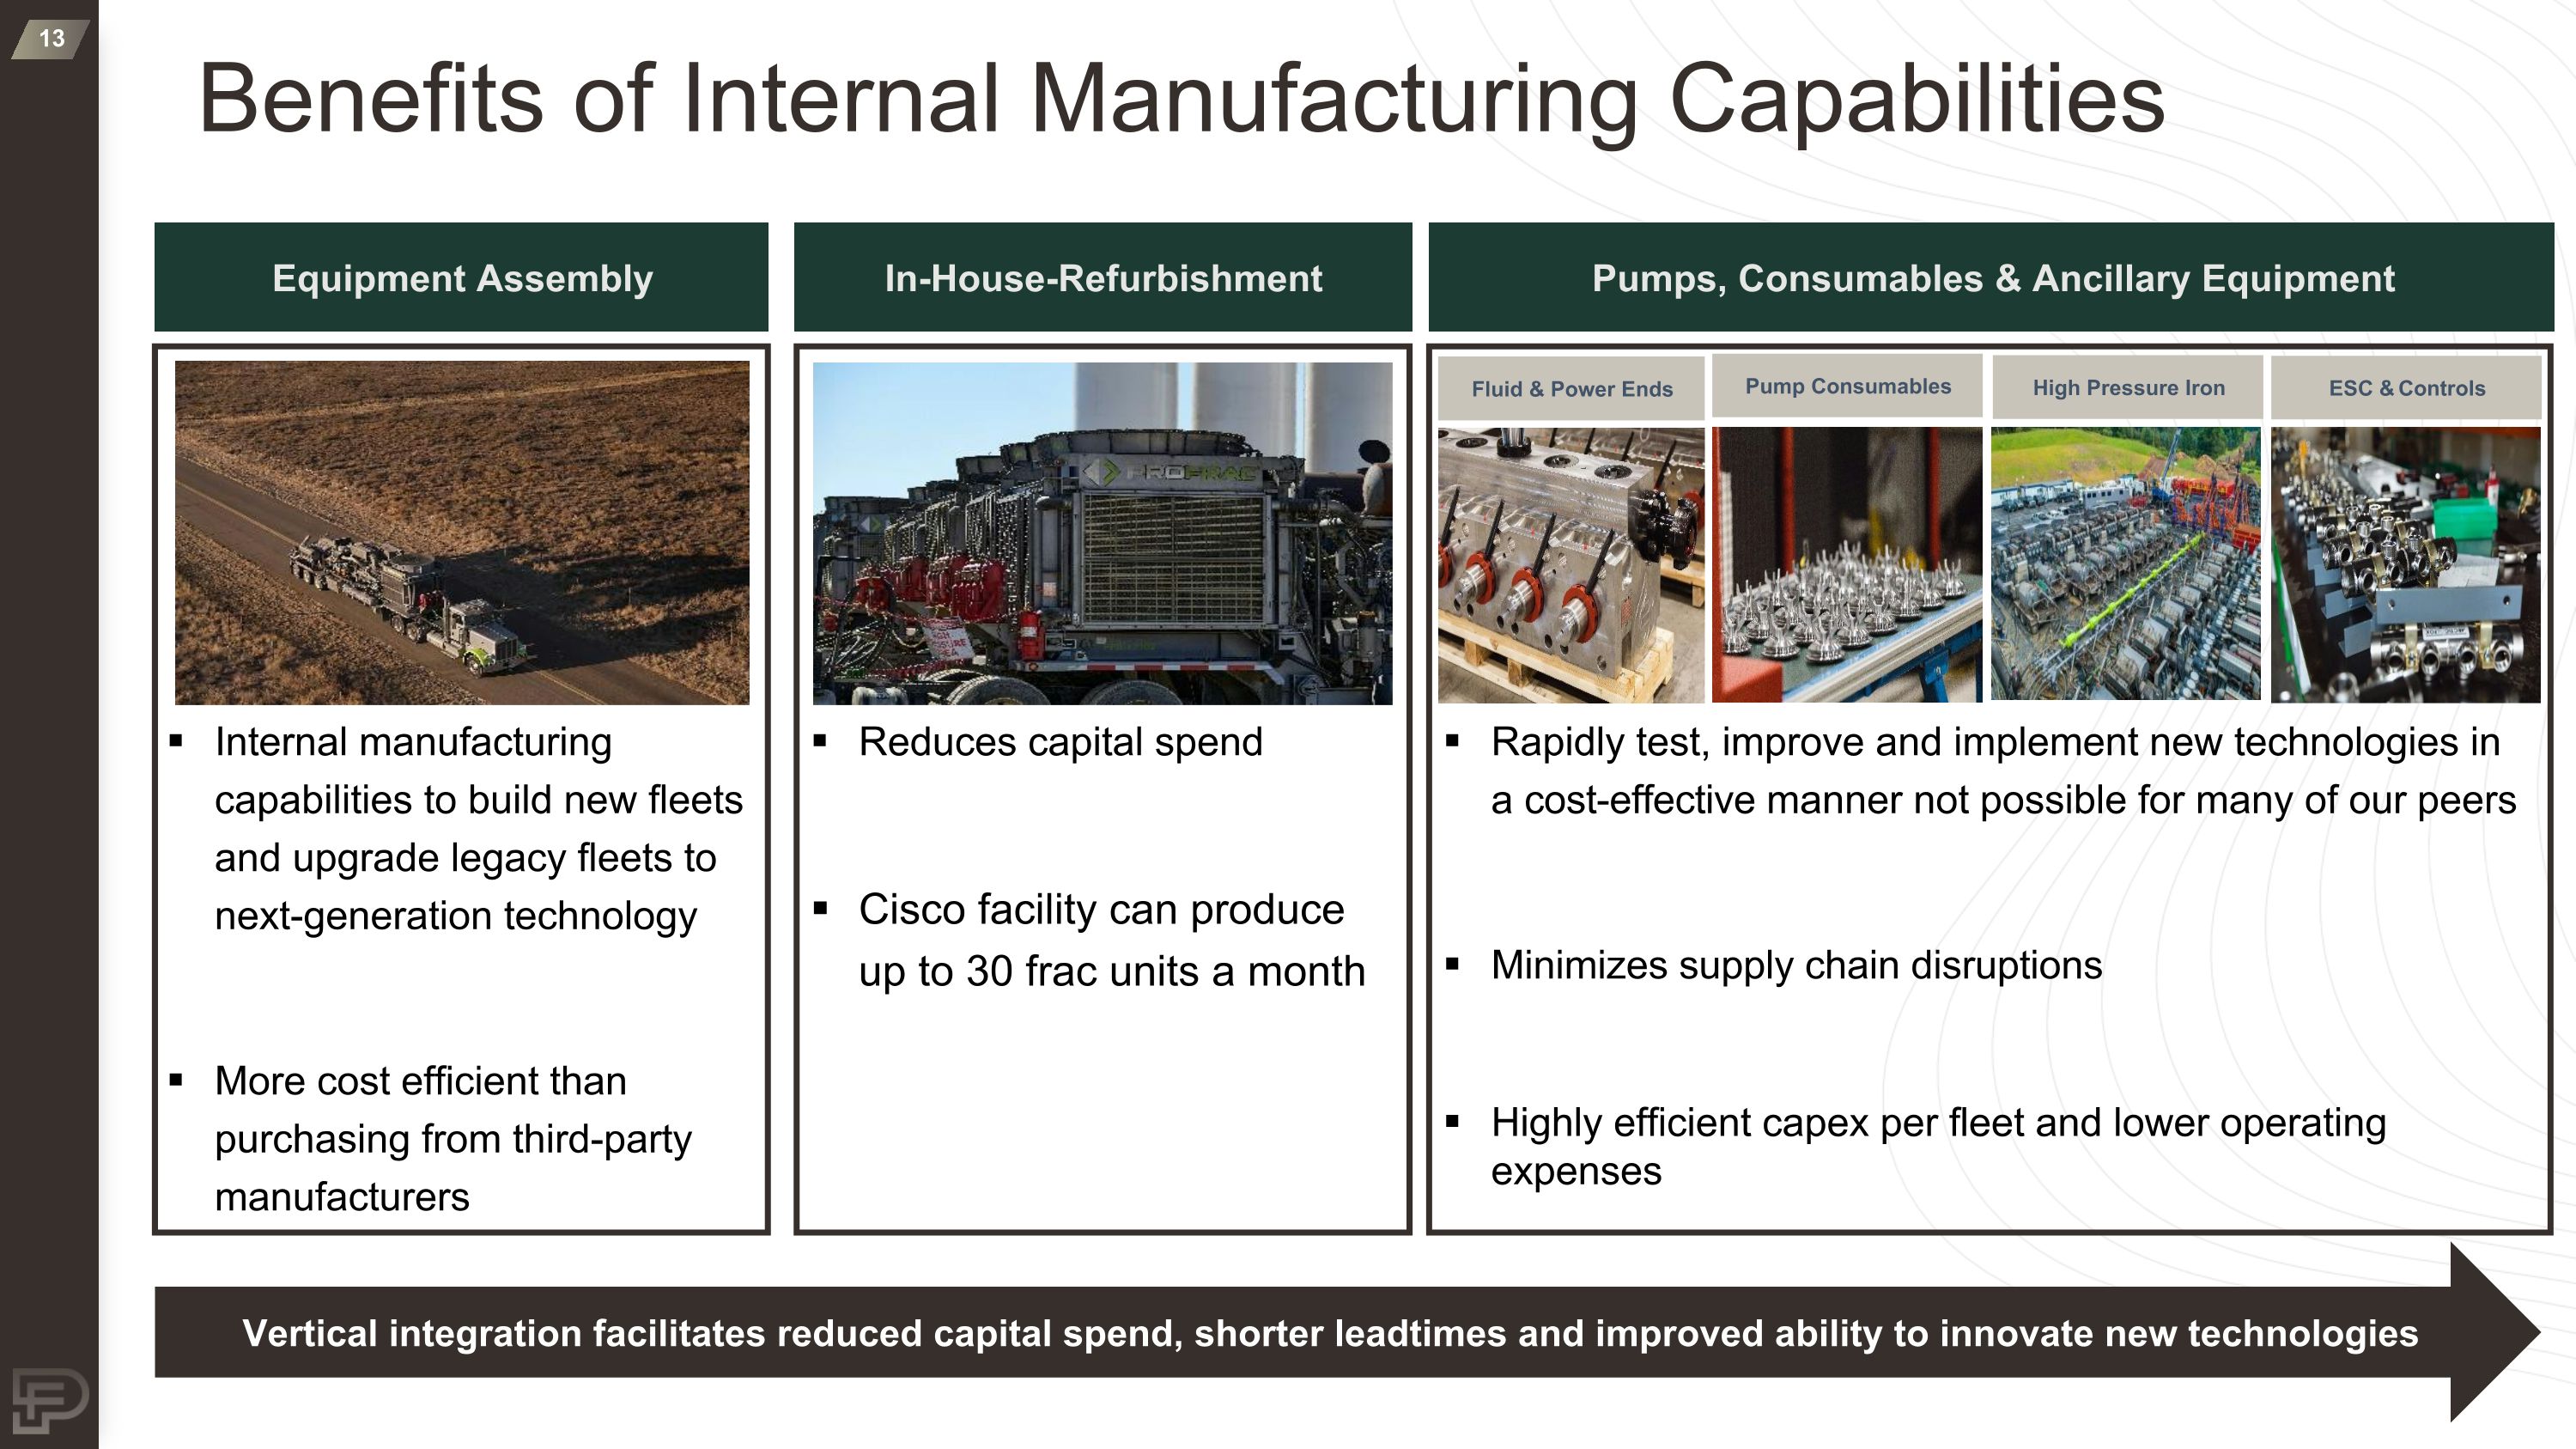
Benefits of Internal Manufacturing Capabilities Equipment Assembly Internal manufacturing capabilities to build new fleets and upgrade legacy fleets to next-generation technology More cost efficient than purchasing from third-party manufacturers In-House-Refurbishment Reduces capital spend Cisco facility can produce up to 30 frac units a month Pumps, Consumables & Ancillary Equipment Rapidly test, improve and implement new technologies in a cost-effective manner not possible for many of our peers Minimizes supply chain disruptions Highly efficient capex per fleet and lower operating expenses Fluid & Power Ends Pump Consumables High Pressure Iron ESC & Controls Vertical integration facilitates reduced capital spend, shorter leadtimes and improved ability to innovate new technologies
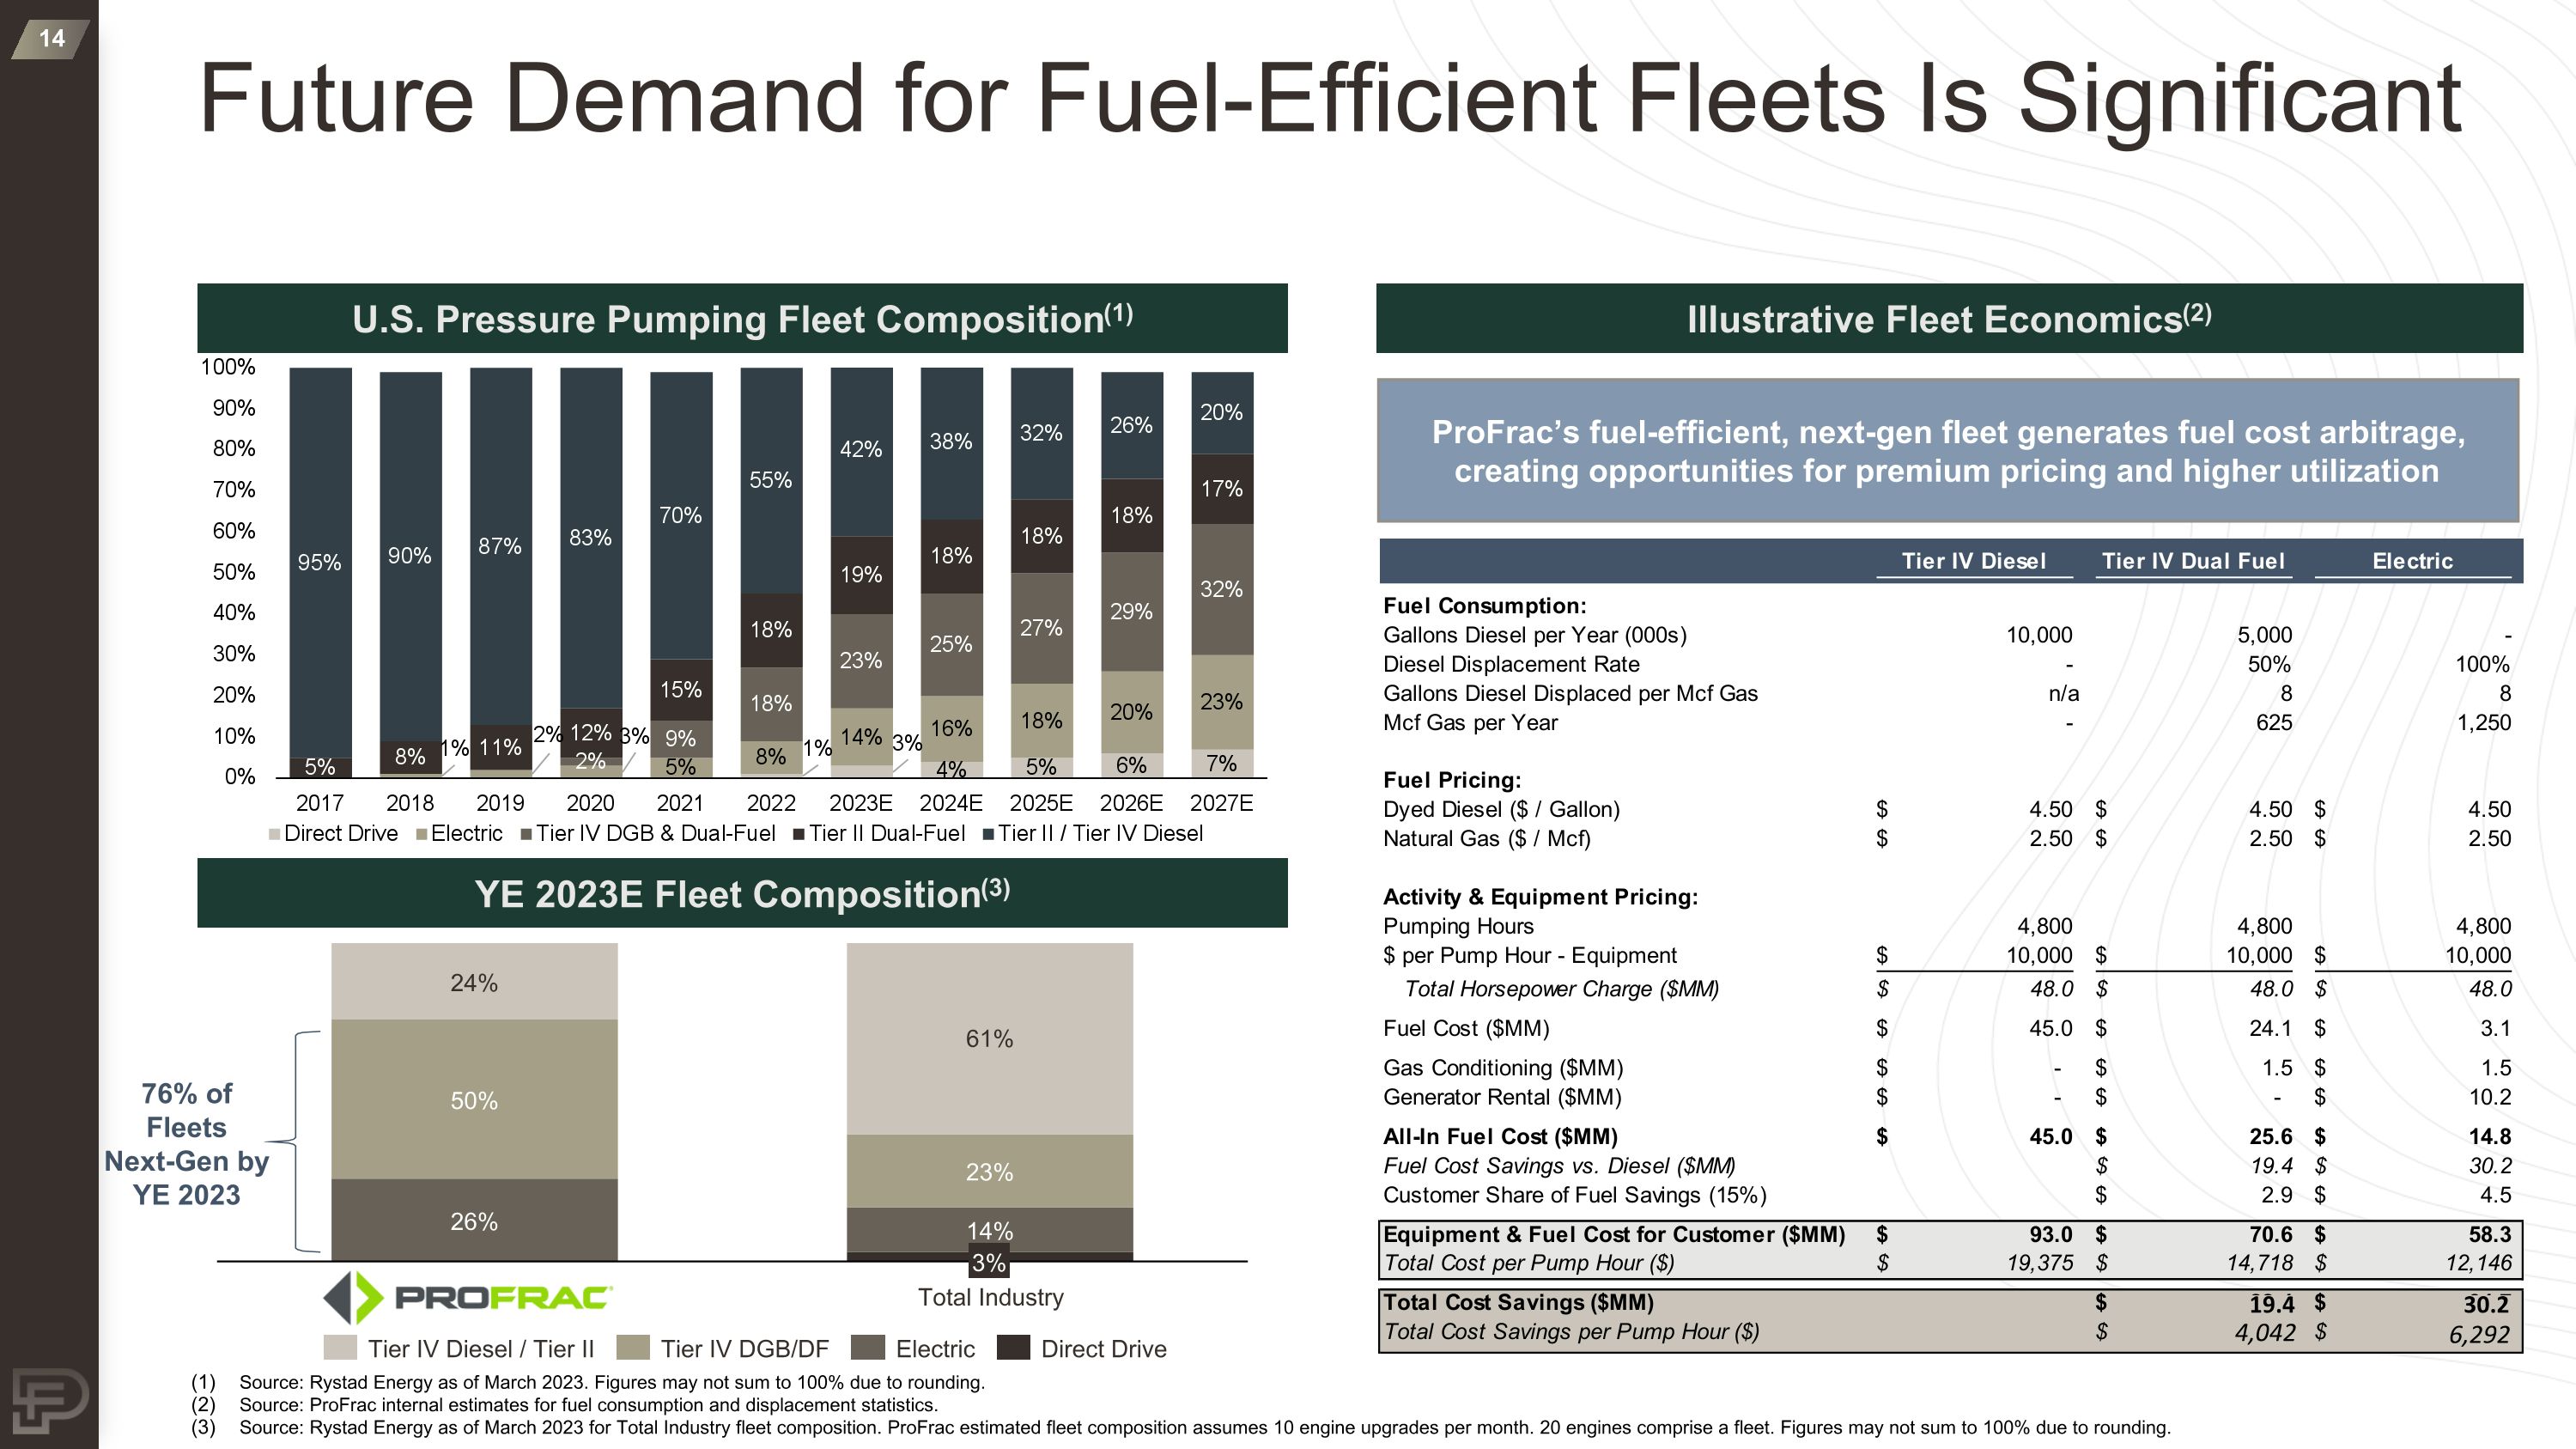
Future Demand for Fuel-Efficient Fleets Is Significant U.S. Pressure Pumping Fleet Composition(1) Source: Rystad Energy as of March 2023. Figures may not sum to 100% due to rounding. Source: ProFrac internal estimates for fuel consumption and displacement statistics. Source: Rystad Energy as of March 2023 for Total Industry fleet composition. ProFrac estimated fleet composition assumes 10 engine upgrades per month. 20 engines comprise a fleet. Figures may not sum to 100% due to rounding. YE 2023E Fleet Composition(3) 76% of Fleets Next-Gen by YE 2023 Illustrative Fleet Economics(2) ProFrac’s fuel-efficient, next-gen fleet generates fuel cost arbitrage, creating opportunities for premium pricing and higher utilization 3% Total Industry Direct Drive Electric Tier IV Diesel / Tier II Tier IV DGB/DF 4,042 6,292 19.4 30.2
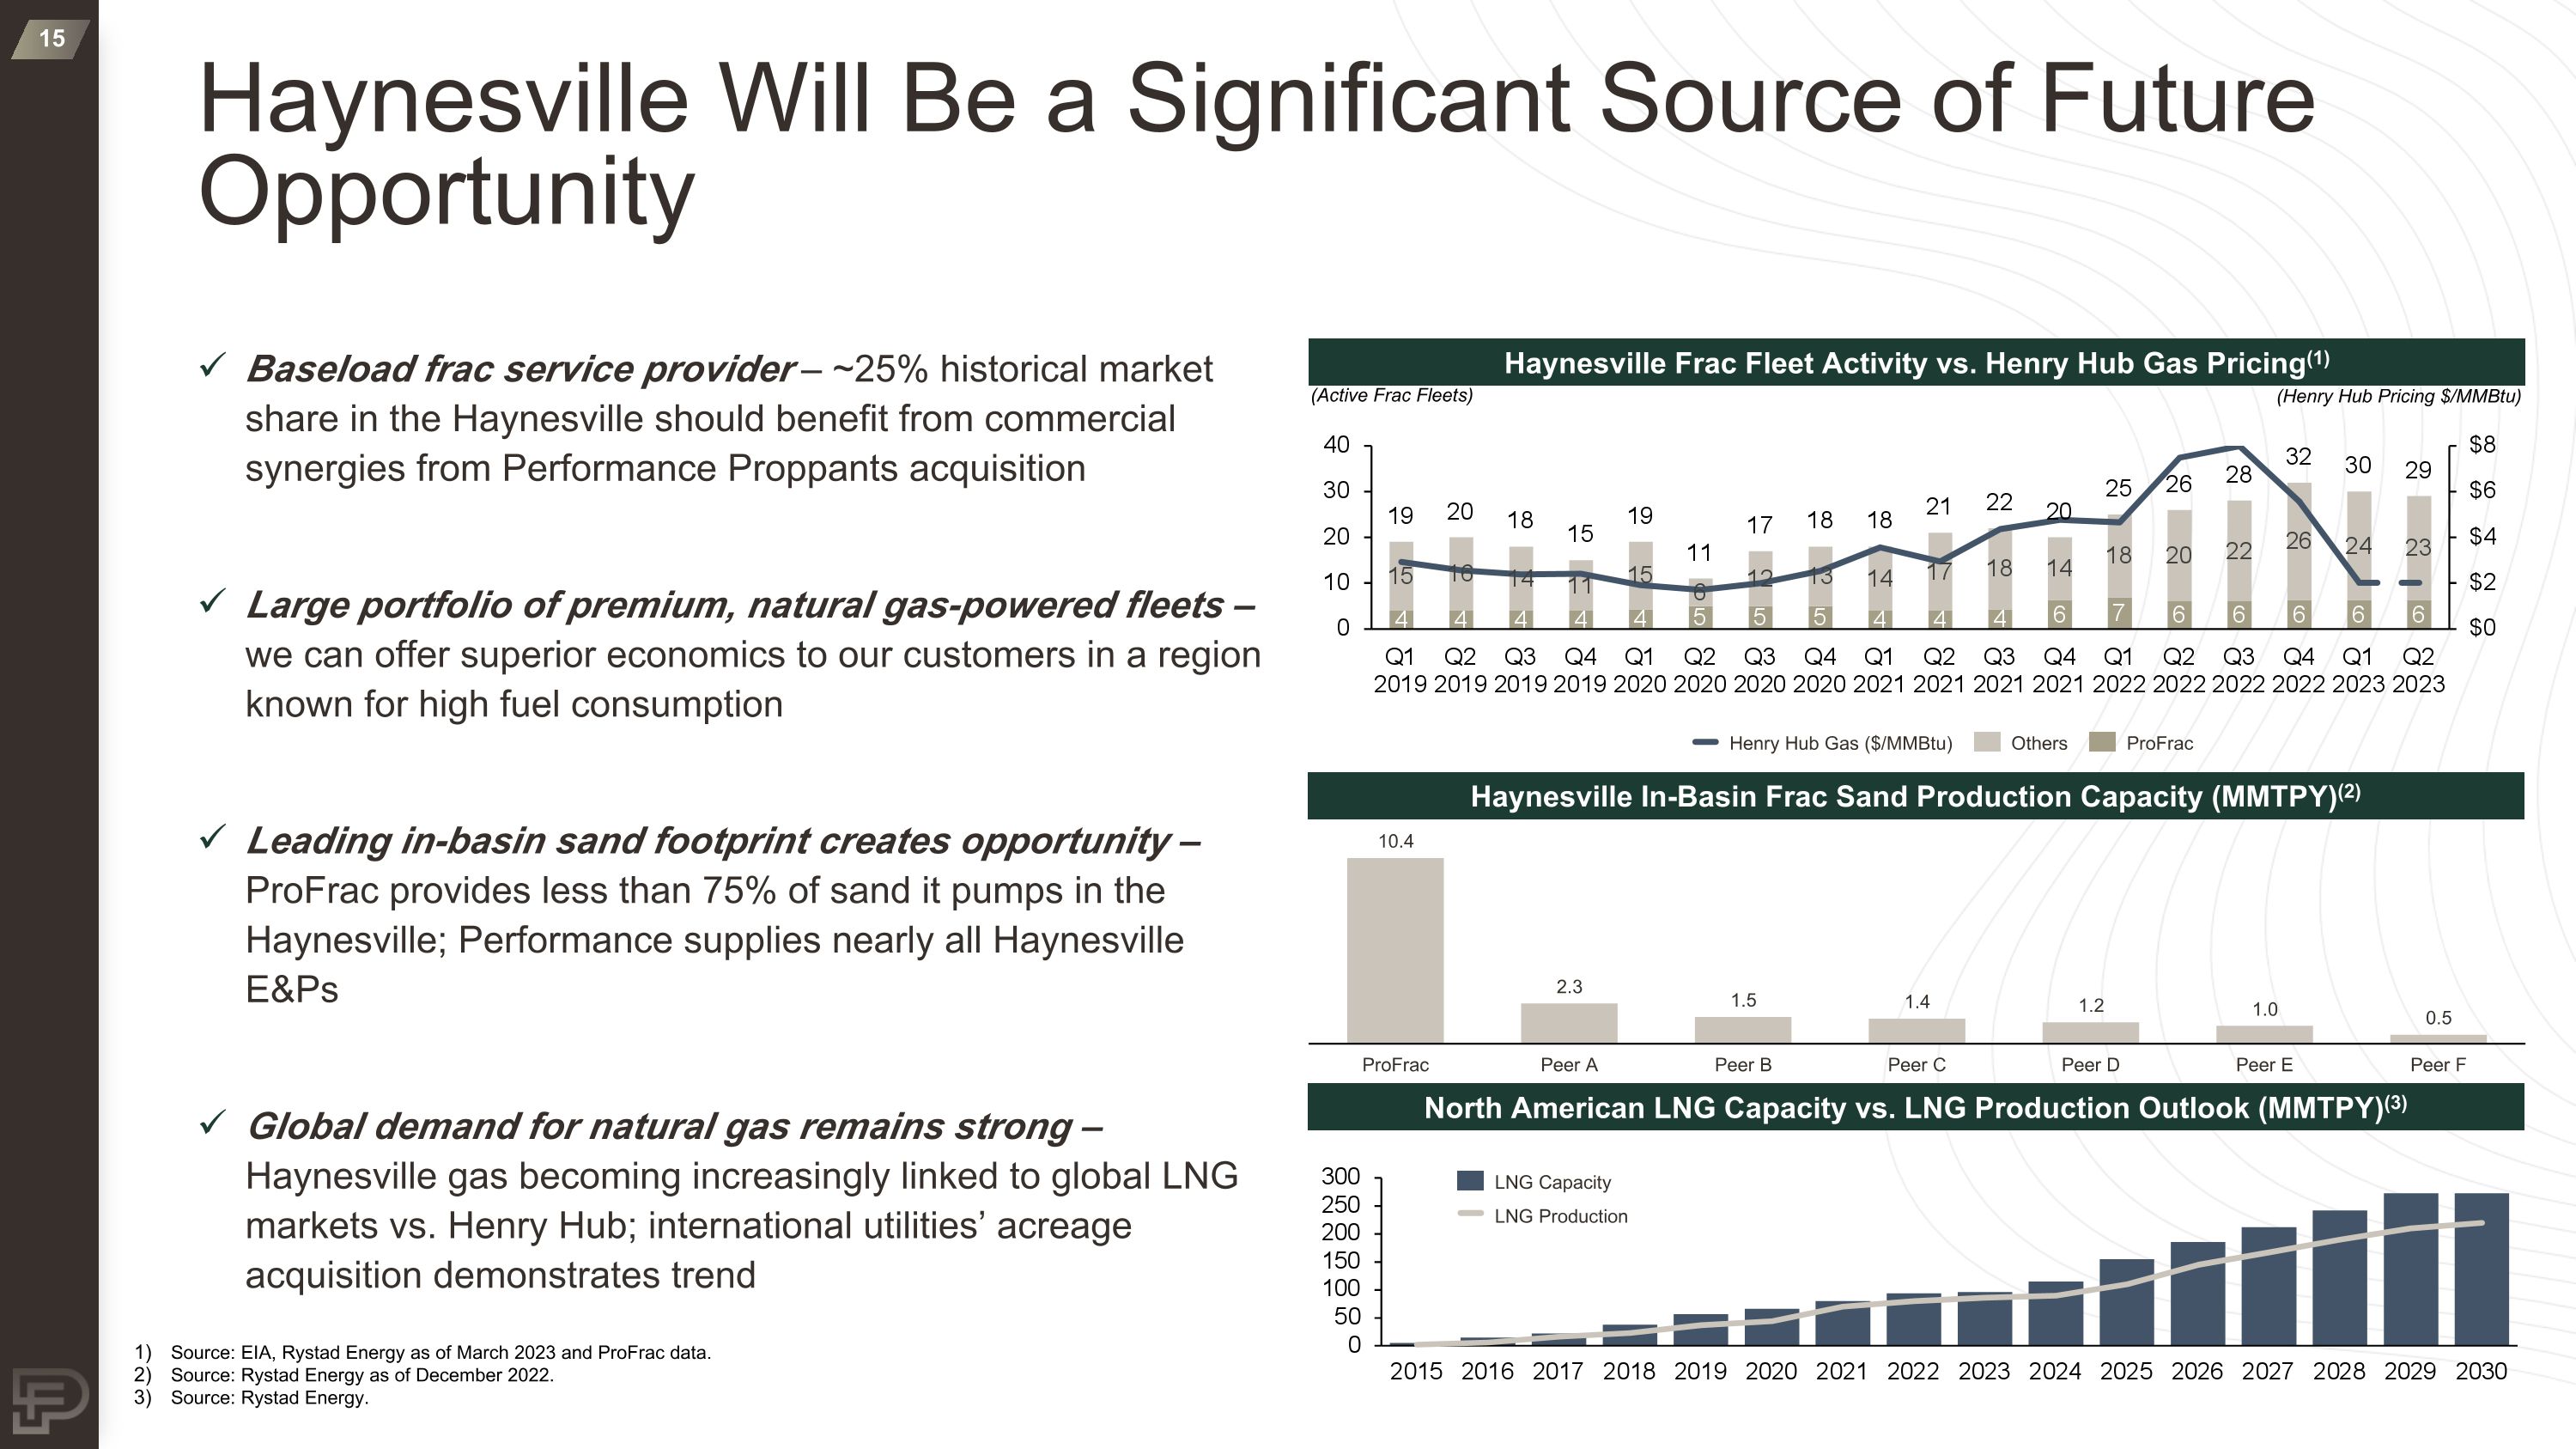
Haynesville Will Be a Significant Source of Future Opportunity Baseload frac service provider – ~25% historical market share in the Haynesville should benefit from commercial synergies from Performance Proppants acquisition Large portfolio of premium, natural gas-powered fleets – we can offer superior economics to our customers in a region known for high fuel consumption Leading in-basin sand footprint creates opportunity – ProFrac provides less than 75% of sand it pumps in the Haynesville; Performance supplies nearly all Haynesville E&Ps Global demand for natural gas remains strong – Haynesville gas becoming increasingly linked to global LNG markets vs. Henry Hub; international utilities’ acreage acquisition demonstrates trend Henry Hub Gas ($/MMBtu) ProFrac Others Haynesville Frac Fleet Activity vs. Henry Hub Gas Pricing(1) (Active Frac Fleets) (Henry Hub Pricing $/MMBtu) Haynesville In-Basin Frac Sand Production Capacity (MMTPY)(2) North American LNG Capacity vs. LNG Production Outlook (MMTPY)(3) Source: EIA, Rystad Energy as of March 2023 and ProFrac data. Source: Rystad Energy as of December 2022. Source: Rystad Energy. LNG Capacity ProFrac Peer A Peer B Peer C Peer D Peer E Peer F LNG Production
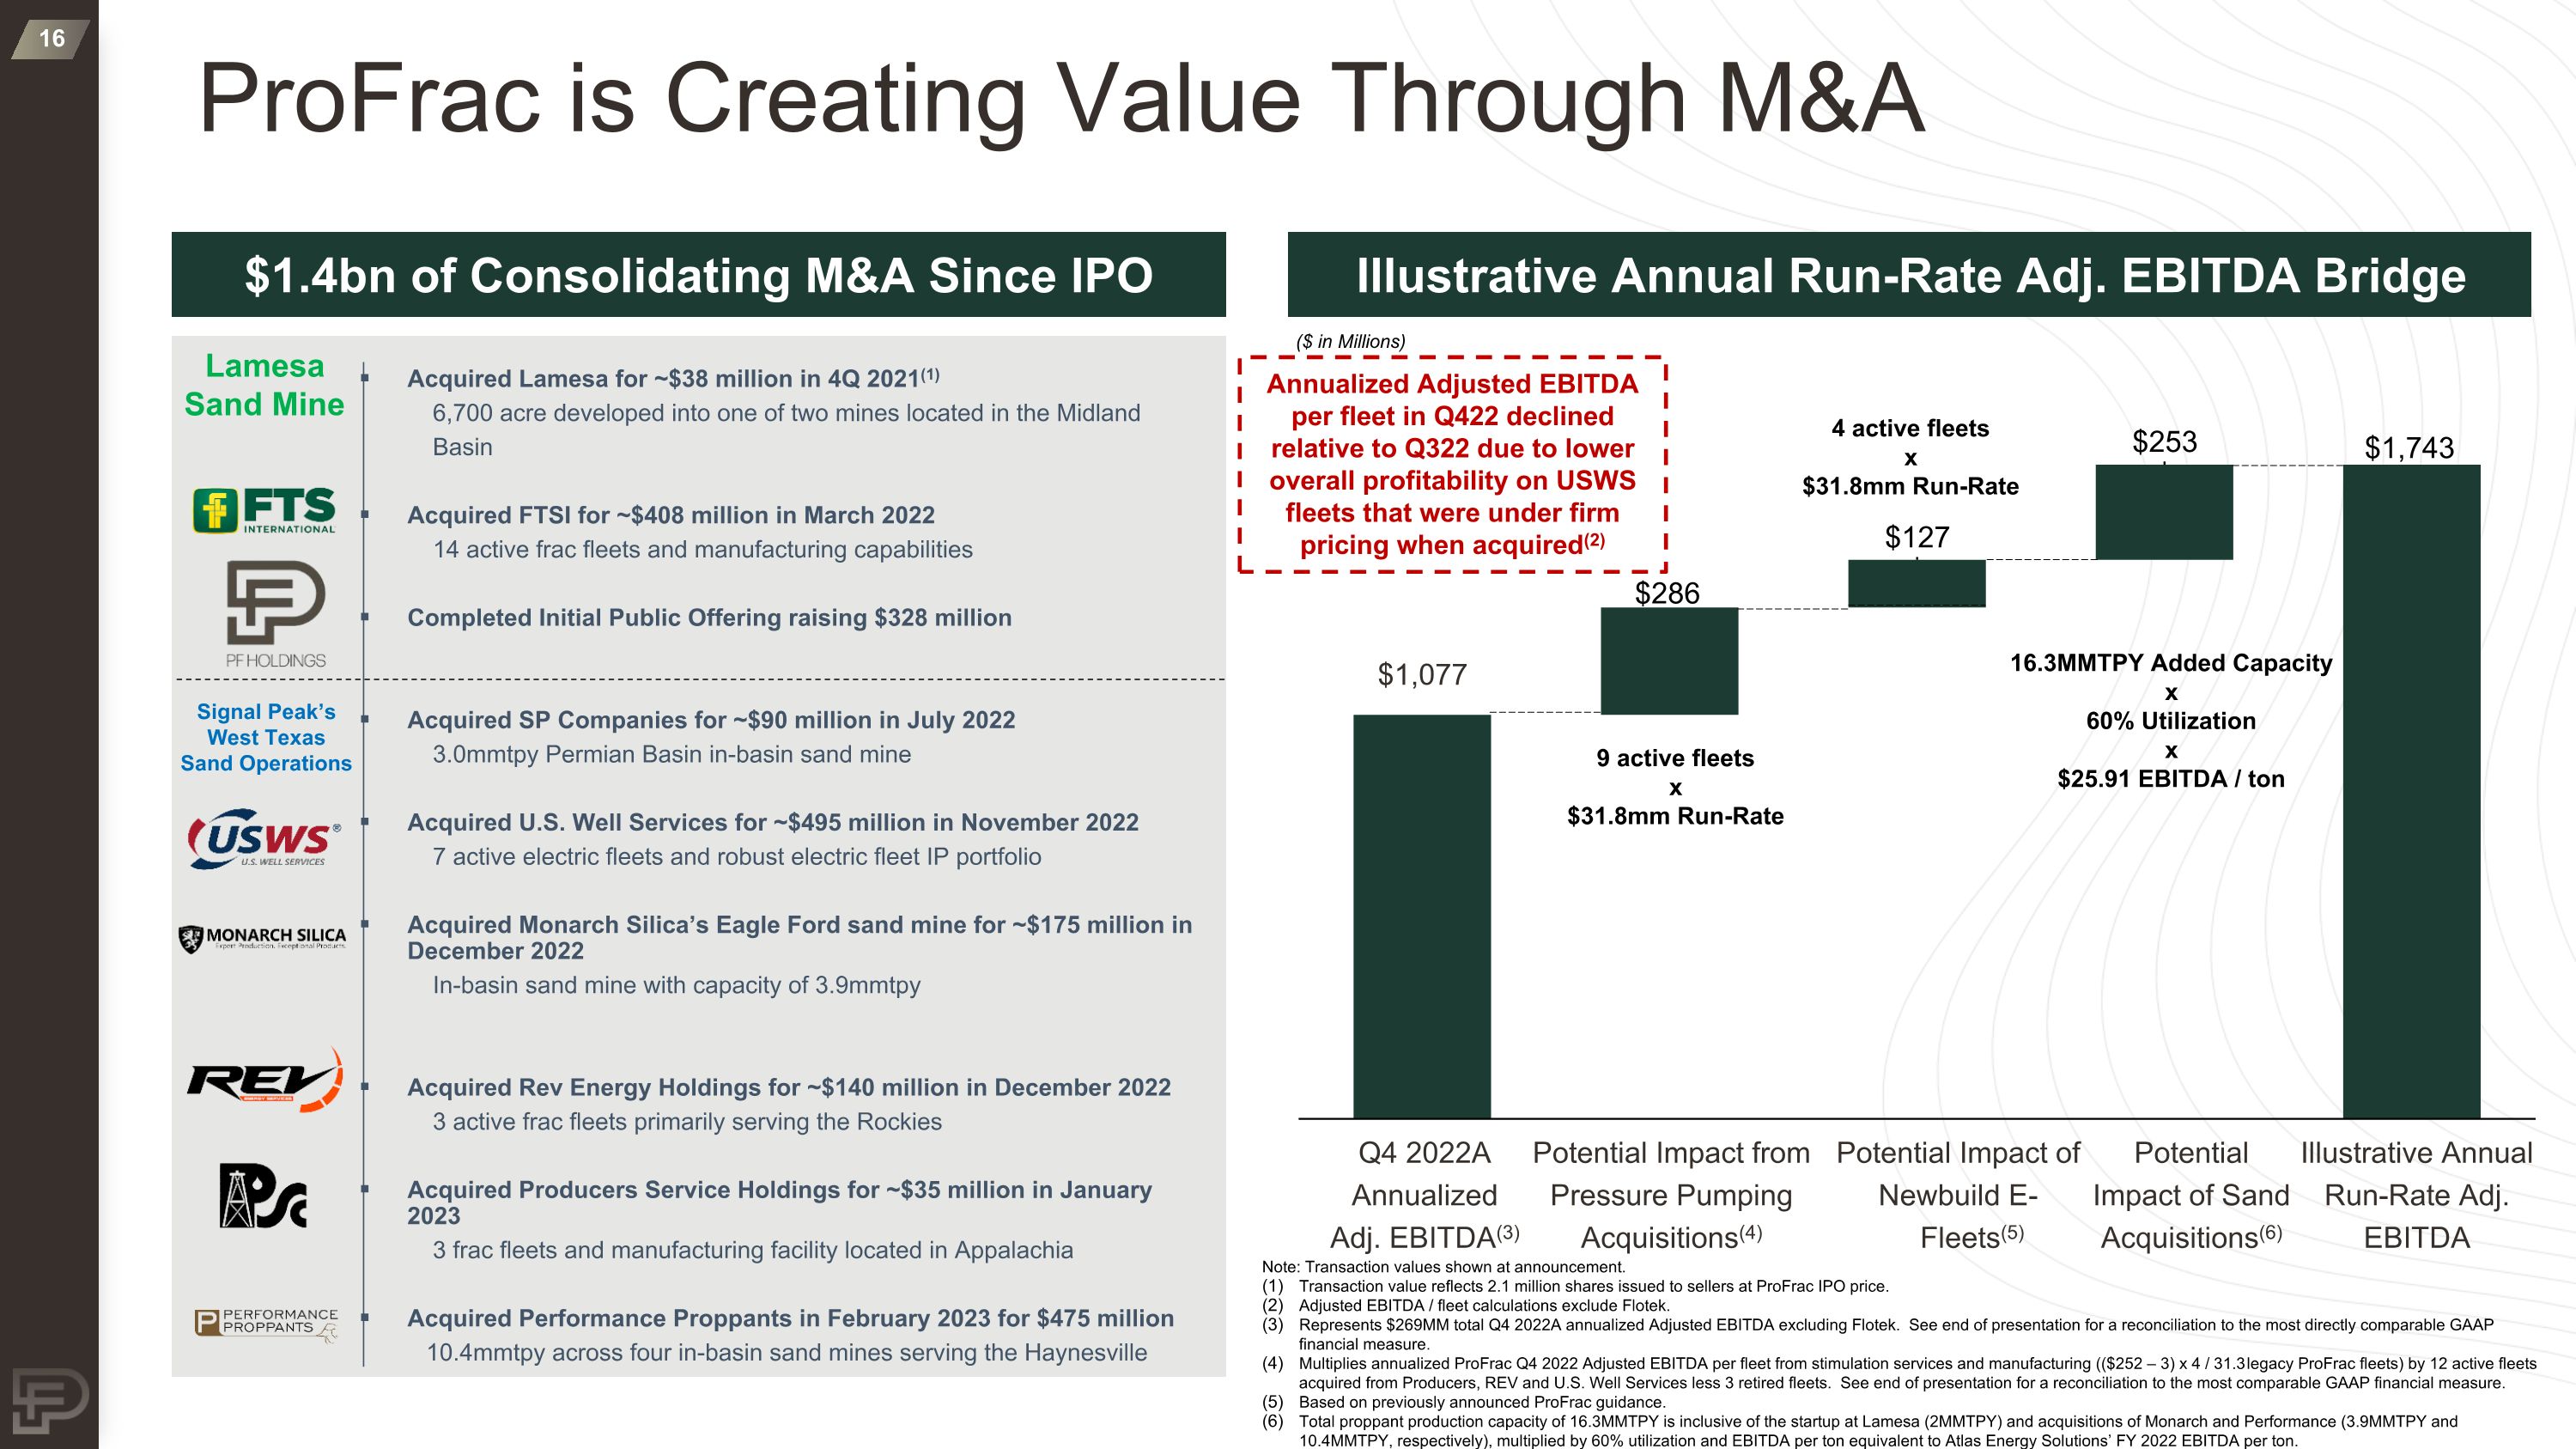
ProFrac is Creating Value Through M&A Acquired Lamesa for ~$38 million in 4Q 2021(1) 6,700 acre developed into one of two mines located in the Midland Basin Acquired FTSI for ~$408 million in March 2022 14 active frac fleets and manufacturing capabilities Completed Initial Public Offering raising $328 million Acquired SP Companies for ~$90 million in July 2022 3.0mmtpy Permian Basin in-basin sand mine Acquired U.S. Well Services for ~$495 million in November 2022 7 active electric fleets and robust electric fleet IP portfolio Acquired Monarch Silica’s Eagle Ford sand mine for ~$175 million in December 2022 In-basin sand mine with capacity of 3.9mmtpy Acquired Rev Energy Holdings for ~$140 million in December 2022 3 active frac fleets primarily serving the Rockies Acquired Producers Service Holdings for ~$35 million in January 2023 3 frac fleets and manufacturing facility located in Appalachia Acquired Performance Proppants in February 2023 for $475 million 10.4mmtpy across four in-basin sand mines serving the Haynesville Lamesa Sand Mine Signal Peak’s West Texas Sand Operations Note: Transaction values shown at announcement. Transaction value reflects 2.1 million shares issued to sellers at ProFrac IPO price. Adjusted EBITDA / fleet calculations exclude Flotek. Represents $269MM total Q4 2022A annualized Adjusted EBITDA excluding Flotek. See end of presentation for a reconciliation to the most directly comparable GAAP financial measure. Multiplies annualized ProFrac Q4 2022 Adjusted EBITDA per fleet from stimulation services and manufacturing (($252 – 3) x 4 / 31.3 legacy ProFrac fleets) by 12 active fleets acquired from Producers, REV and U.S. Well Services less 3 retired fleets. See end of presentation for a reconciliation to the most comparable GAAP financial measure. Based on previously announced ProFrac guidance. Total proppant production capacity of 16.3MMTPY is inclusive of the startup at Lamesa (2MMTPY) and acquisitions of Monarch and Performance (3.9MMTPY and 10.4MMTPY, respectively), multiplied by 60% utilization and EBITDA per ton equivalent to Atlas Energy Solutions’ FY 2022 EBITDA per ton. Illustrative Annual Run-Rate Adj. EBITDA Bridge $1.4bn of Consolidating M&A Since IPO ($ in Millions) Potential Impact from Pressure Pumping Acquisitions(4) Q4 2022A Annualized Adj. EBITDA(3) Illustrative Annual Run-Rate Adj. EBITDA 9 active fleets x $31.8mm Run-Rate 16.3MMTPY Added Capacity x 60% Utilization x $25.91 EBITDA / ton Annualized Adjusted EBITDA per fleet in Q422 declined relative to Q322 due to lower overall profitability on USWS fleets that were under firm pricing when acquired(2) 4 active fleets x $31.8mm Run-Rate Potential Impact of Newbuild E-Fleets(5) Potential Impact of Sand Acquisitions(6)
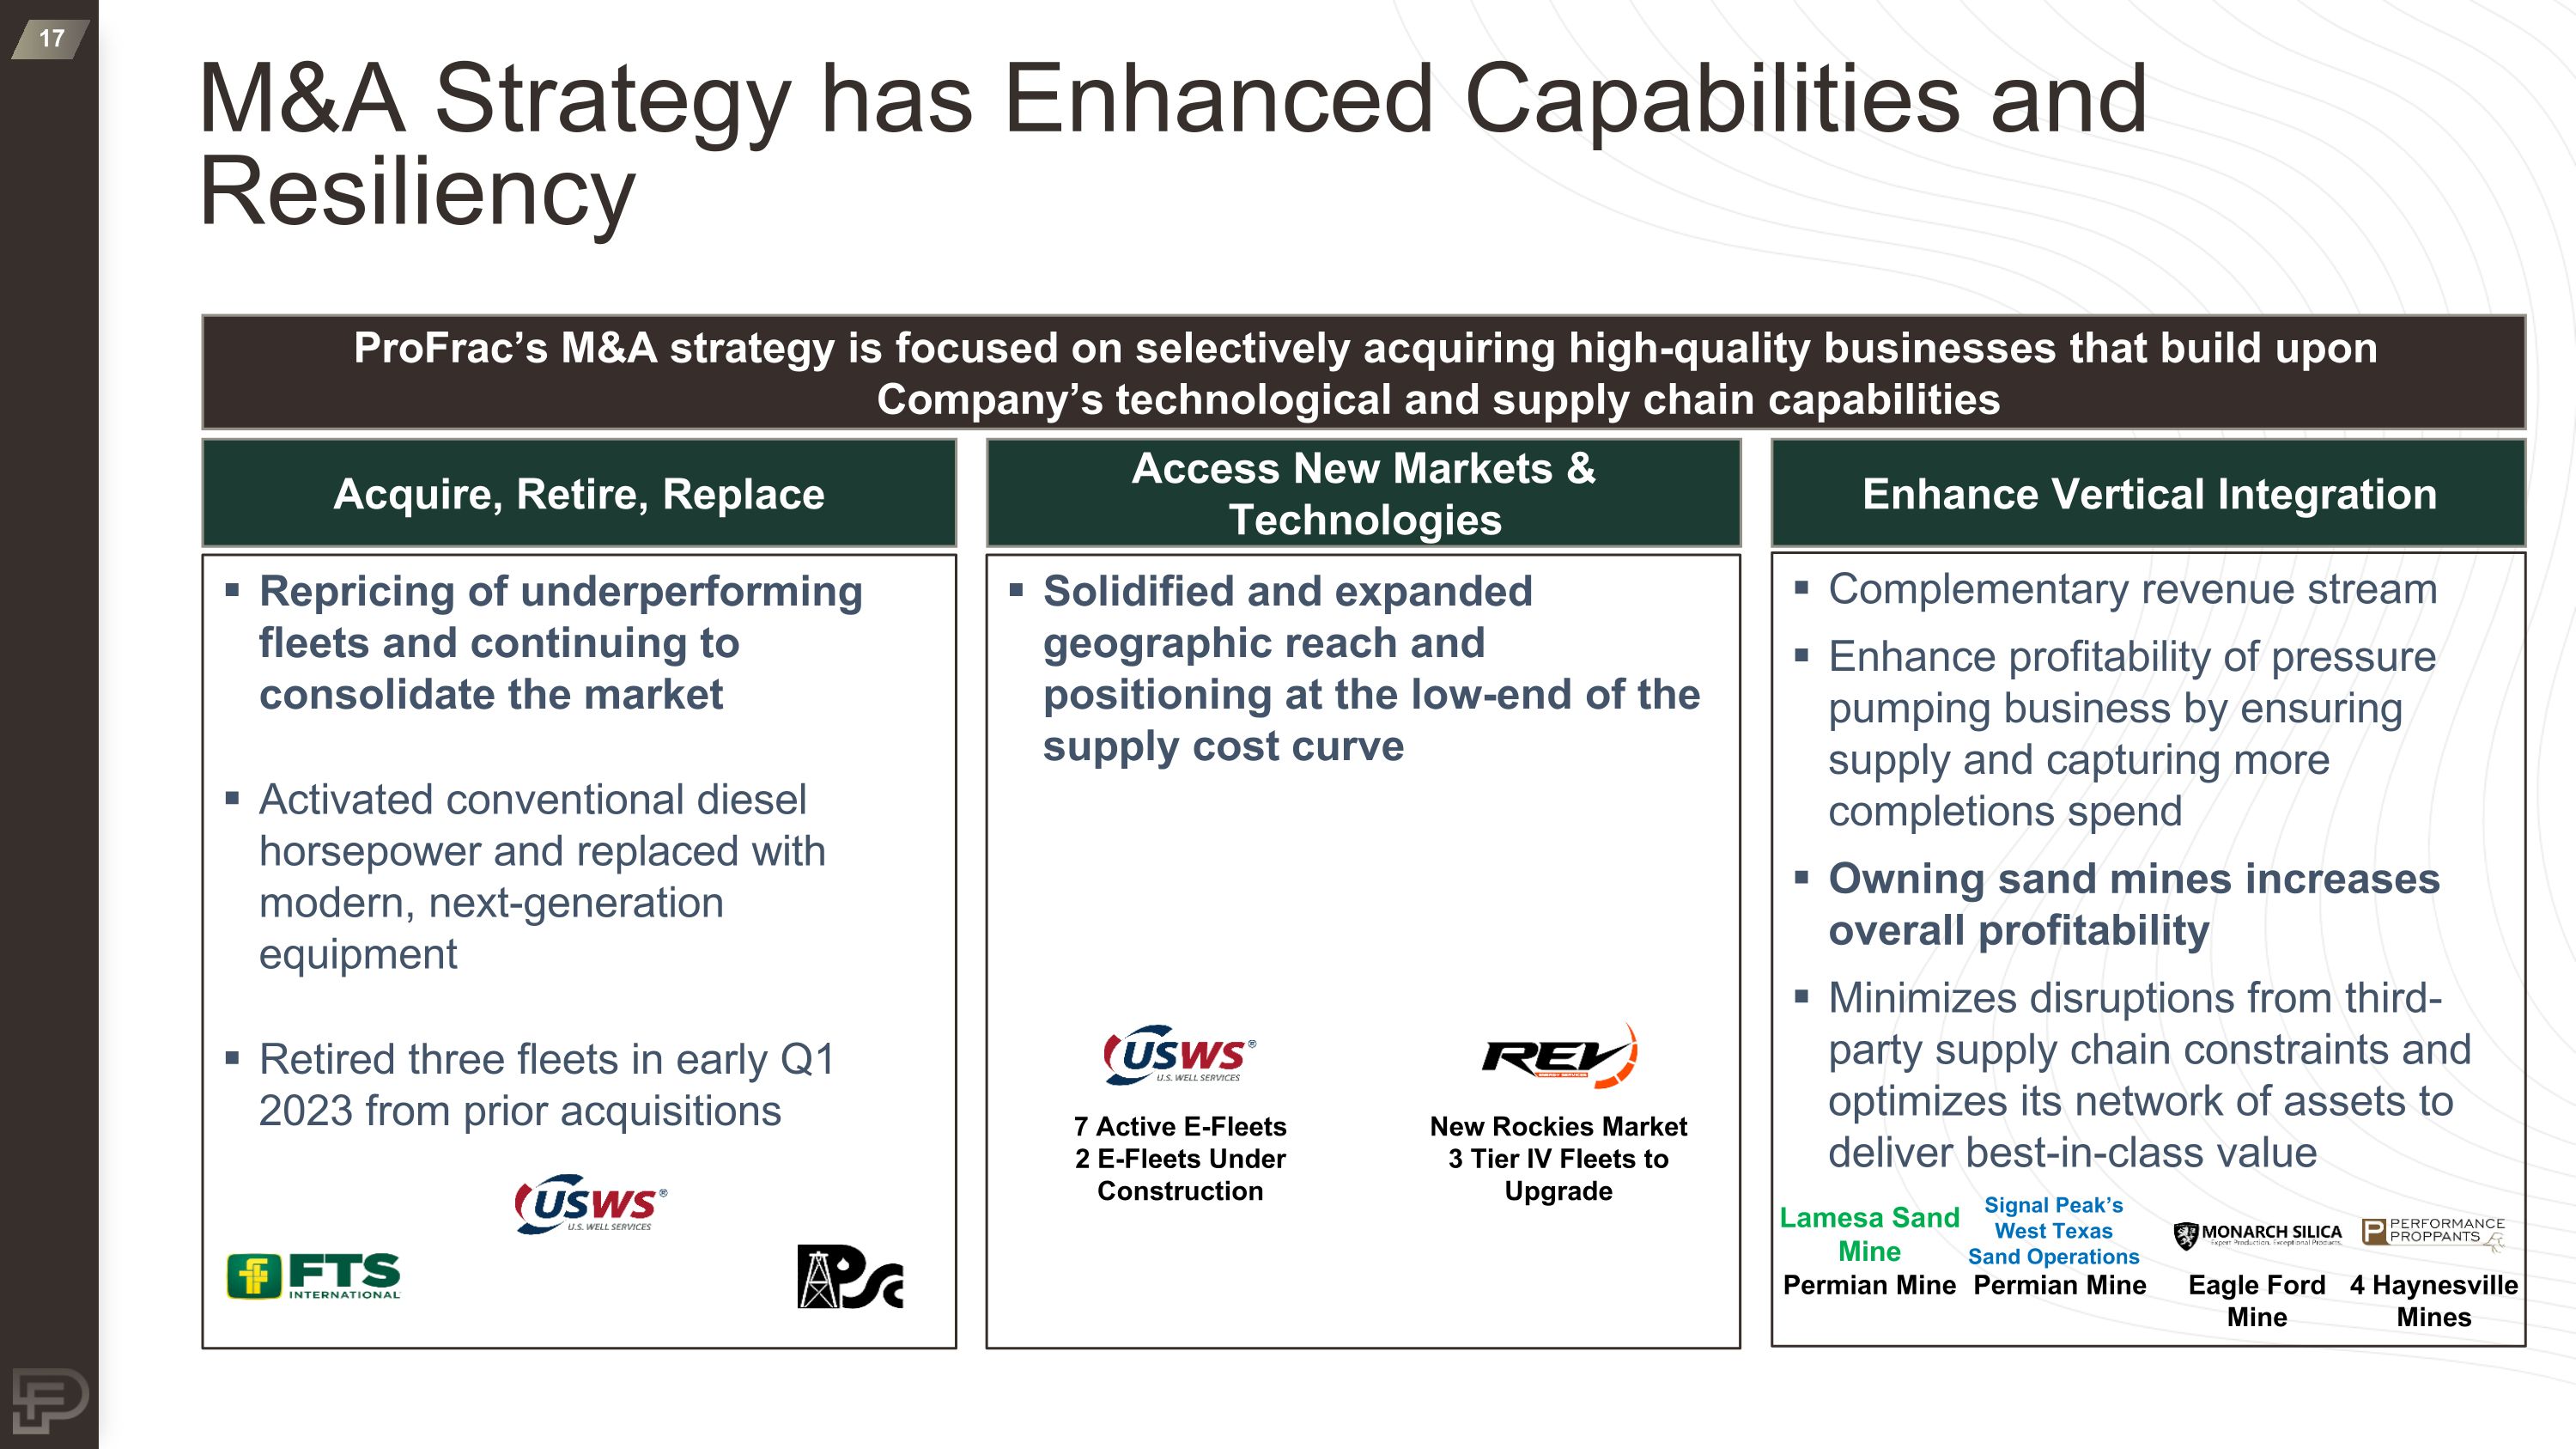
Repricing of underperforming fleets and continuing to consolidate the market Activated conventional diesel horsepower and replaced with modern, next-generation equipment Retired three fleets in early Q1 2023 from prior acquisitions Solidified and expanded geographic reach and positioning at the low-end of the supply cost curve Complementary revenue stream Enhance profitability of pressure pumping business by ensuring supply and capturing more completions spend Owning sand mines increases overall profitability Minimizes disruptions from third-party supply chain constraints and optimizes its network of assets to deliver best-in-class value M&A Strategy has Enhanced Capabilities and Resiliency Acquire, Retire, Replace Access New Markets & Technologies Enhance Vertical Integration ProFrac’s M&A strategy is focused on selectively acquiring high-quality businesses that build upon Company’s technological and supply chain capabilities Lamesa Sand Mine 7 Active E-Fleets 2 E-Fleets Under Construction New Rockies Market 3 Tier IV Fleets to Upgrade 4 Haynesville Mines Permian Mine Eagle Ford Mine Permian Mine Signal Peak’s West Texas Sand Operations
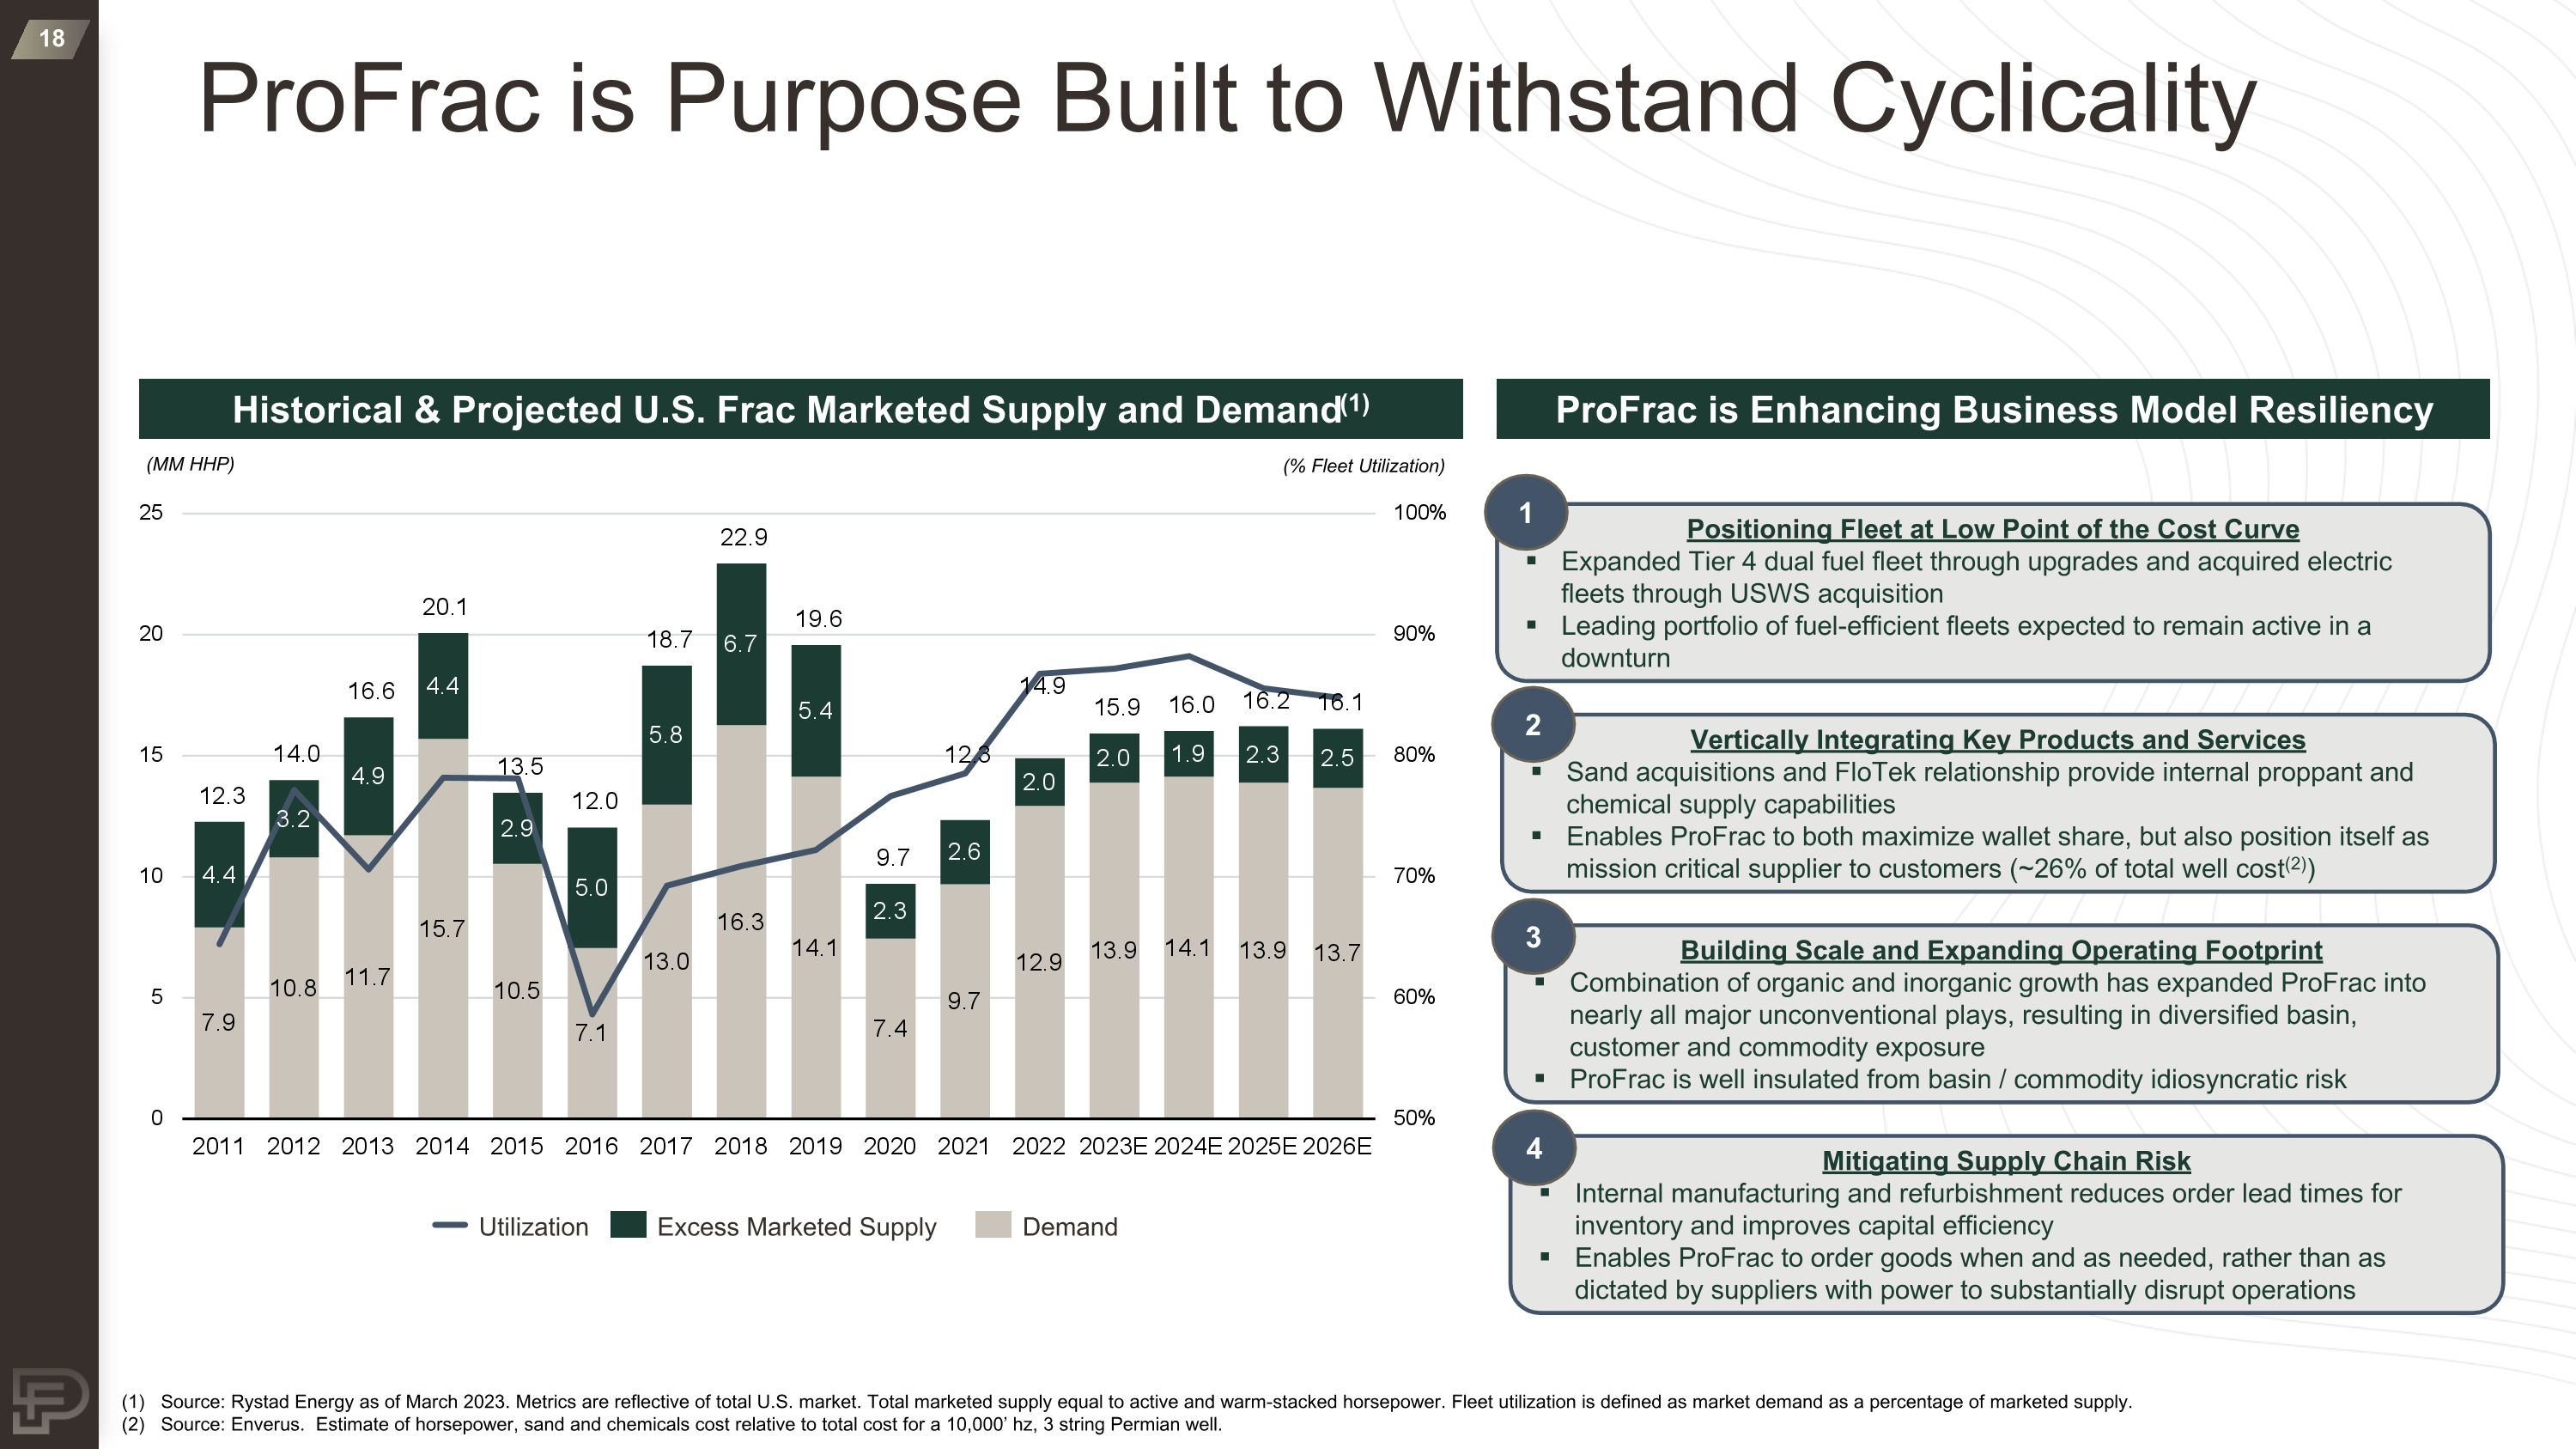
ProFrac is Purpose Built to Withstand Cyclicality Demand Utilization Excess Marketed Supply Historical & Projected U.S. Frac Marketed Supply and Demand(1) (MM HHP) (% Fleet Utilization) (1) Source: Rystad Energy as of March 2023. Metrics are reflective of total U.S. market. Total marketed supply equal to active and warm-stacked horsepower. Fleet utilization is defined as market demand as a percentage of marketed supply. (2) Source: Enverus. Estimate of horsepower, sand and chemicals cost relative to total cost for a 10,000’ hz, 3 string Permian well. ProFrac is Enhancing Business Model Resiliency Positioning Fleet at Low Point of the Cost Curve Expanded Tier 4 dual fuel fleet through upgrades and acquired electric fleets through USWS acquisition Leading portfolio of fuel-efficient fleets expected to remain active in a downturn Vertically Integrating Key Products and Services Sand acquisitions and FloTek relationship provide internal proppant and chemical supply capabilities Enables ProFrac to both maximize wallet share, but also position itself as mission critical supplier to customers (~26% of total well cost(2)) Building Scale and Expanding Operating Footprint Combination of organic and inorganic growth has expanded ProFrac into nearly all major unconventional plays, resulting in diversified basin, customer and commodity exposure ProFrac is well insulated from basin / commodity idiosyncratic risk Mitigating Supply Chain Risk Internal manufacturing and refurbishment reduces order lead times for inventory and improves capital efficiency Enables ProFrac to order goods when and as needed, rather than as dictated by suppliers with power to substantially disrupt operations 1 2 3 4
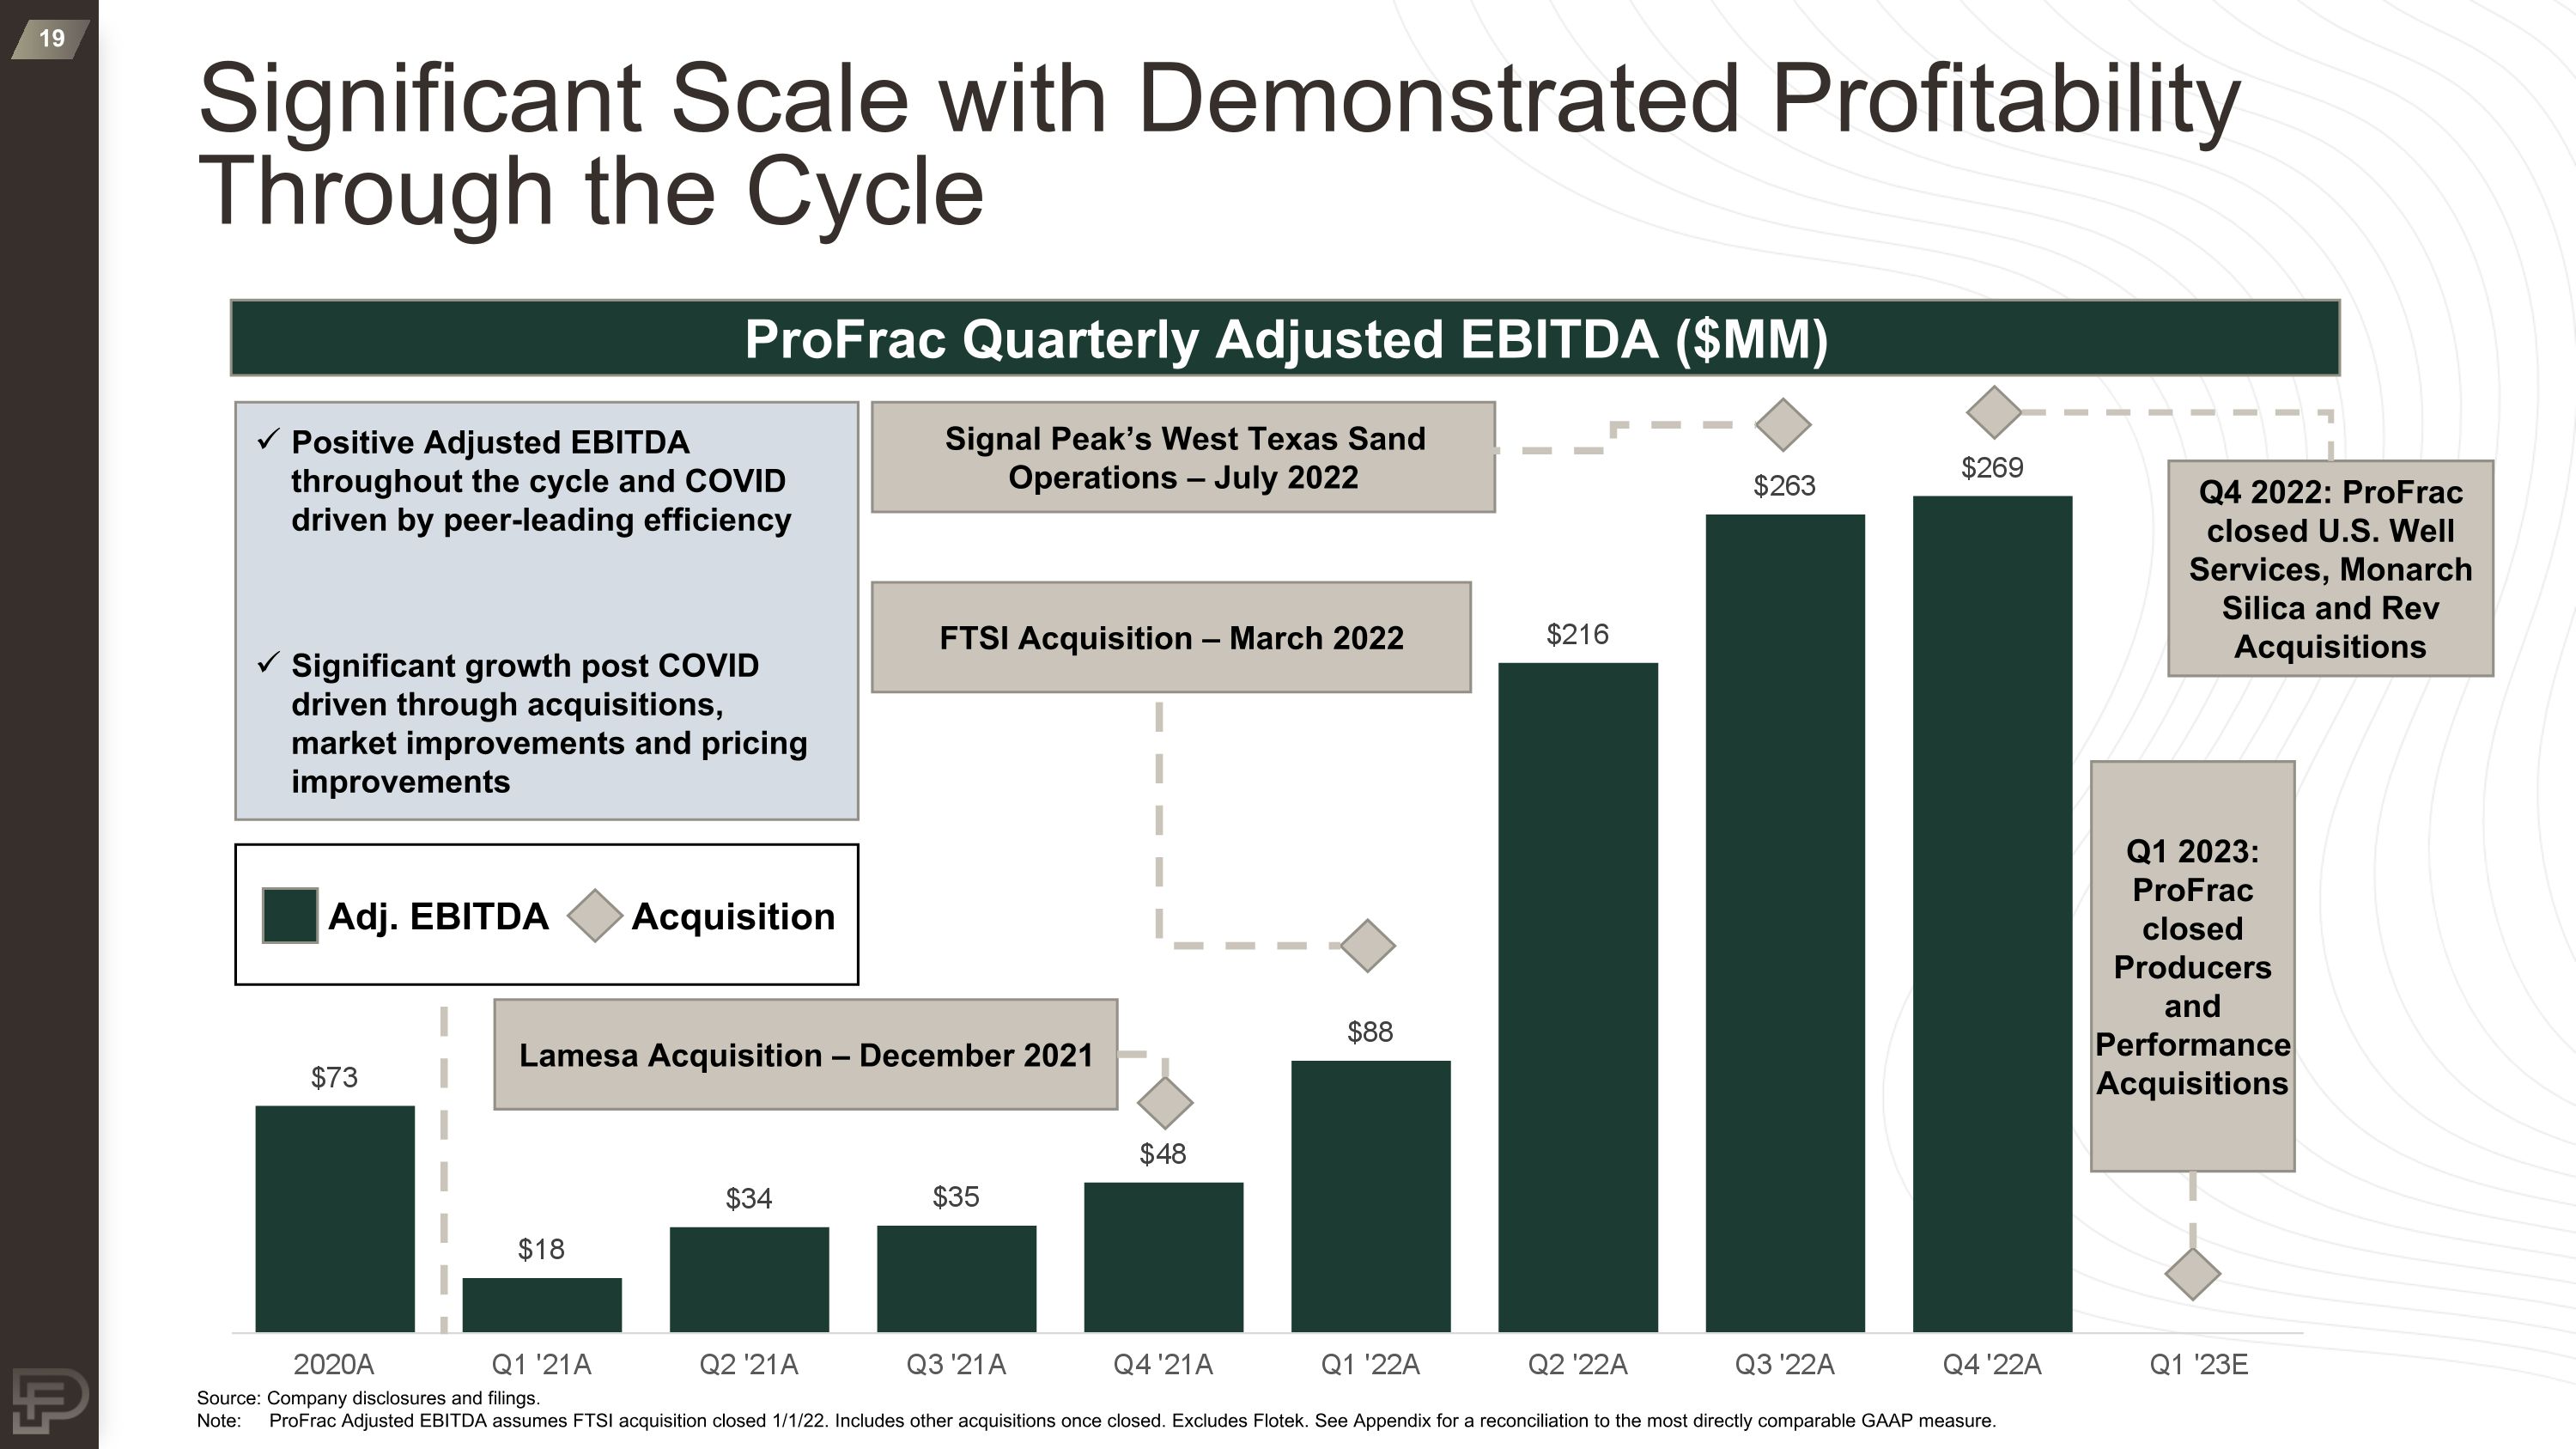
Significant Scale with Demonstrated Profitability Through the Cycle Positive Adjusted EBITDA throughout the cycle and COVID driven by peer-leading efficiency Significant growth post COVID driven through acquisitions, market improvements and pricing improvements ProFrac Quarterly Adjusted EBITDA ($MM) Source: Company disclosures and filings. Note: ProFrac Adjusted EBITDA assumes FTSI acquisition closed 1/1/22. Includes other acquisitions once closed. Excludes Flotek. See Appendix for a reconciliation to the most directly comparable GAAP measure. FTSI Acquisition – March 2022 Lamesa Acquisition – December 2021 Signal Peak’s West Texas Sand Operations – July 2022 Q1 2023: ProFrac closed Producers and Performance Acquisitions Q4 2022: ProFrac closed U.S. Well Services, Monarch Silica and Rev Acquisitions Adj. EBITDA Acquisition
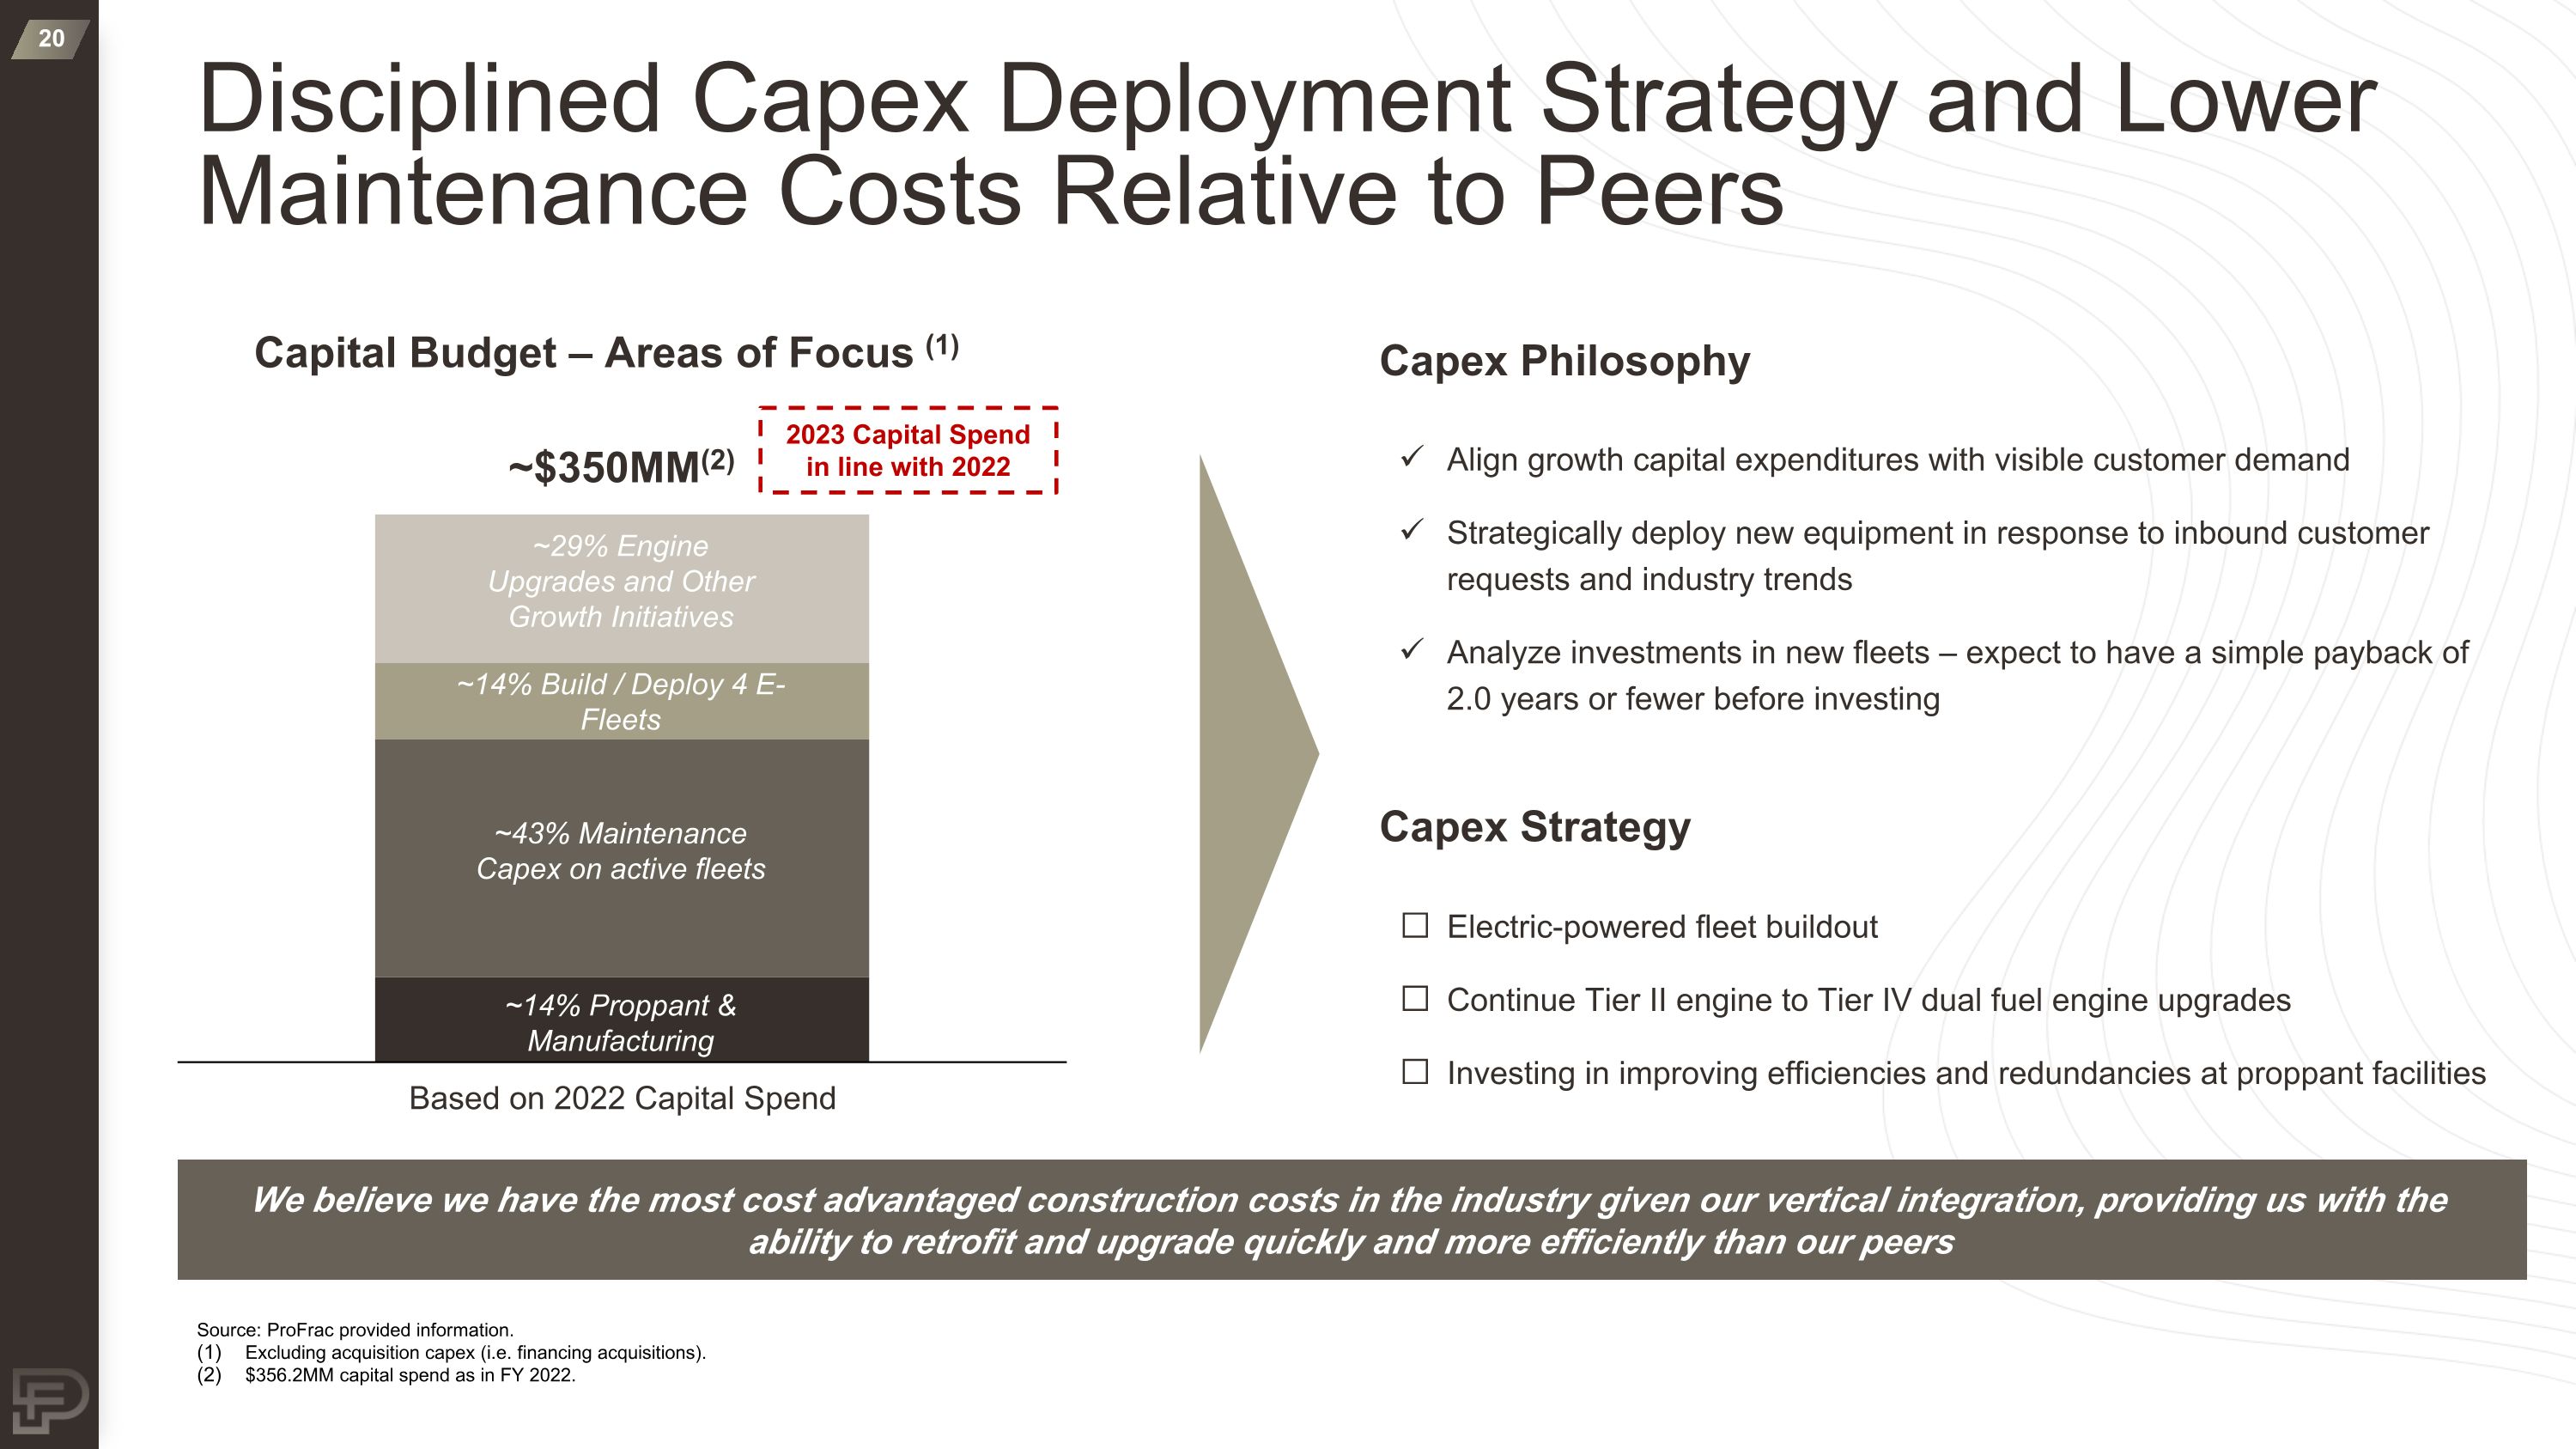
Disciplined Capex Deployment Strategy and Lower Maintenance Costs Relative to Peers Source: ProFrac provided information. Excluding acquisition capex (i.e. financing acquisitions). $356.2MM capital spend as in FY 2022. We believe we have the most cost advantaged construction costs in the industry given our vertical integration, providing us with the ability to retrofit and upgrade quickly and more efficiently than our peers Capital Budget – Areas of Focus (1) Capex Philosophy ~$350MM(2) Capex Strategy Align growth capital expenditures with visible customer demand Strategically deploy new equipment in response to inbound customer requests and industry trends Analyze investments in new fleets – expect to have a simple payback of 2.0 years or fewer before investing Electric-powered fleet buildout Continue Tier II engine to Tier IV dual fuel engine upgrades Investing in improving efficiencies and redundancies at proppant facilities Based on 2022 Capital Spend ~29% Engine Upgrades and Other Growth Initiatives ~14% Build / Deploy 4 E-Fleets ~43% Maintenance Capex on active fleets ~14% Proppant & Manufacturing 2023 Capital Spend in line with 2022
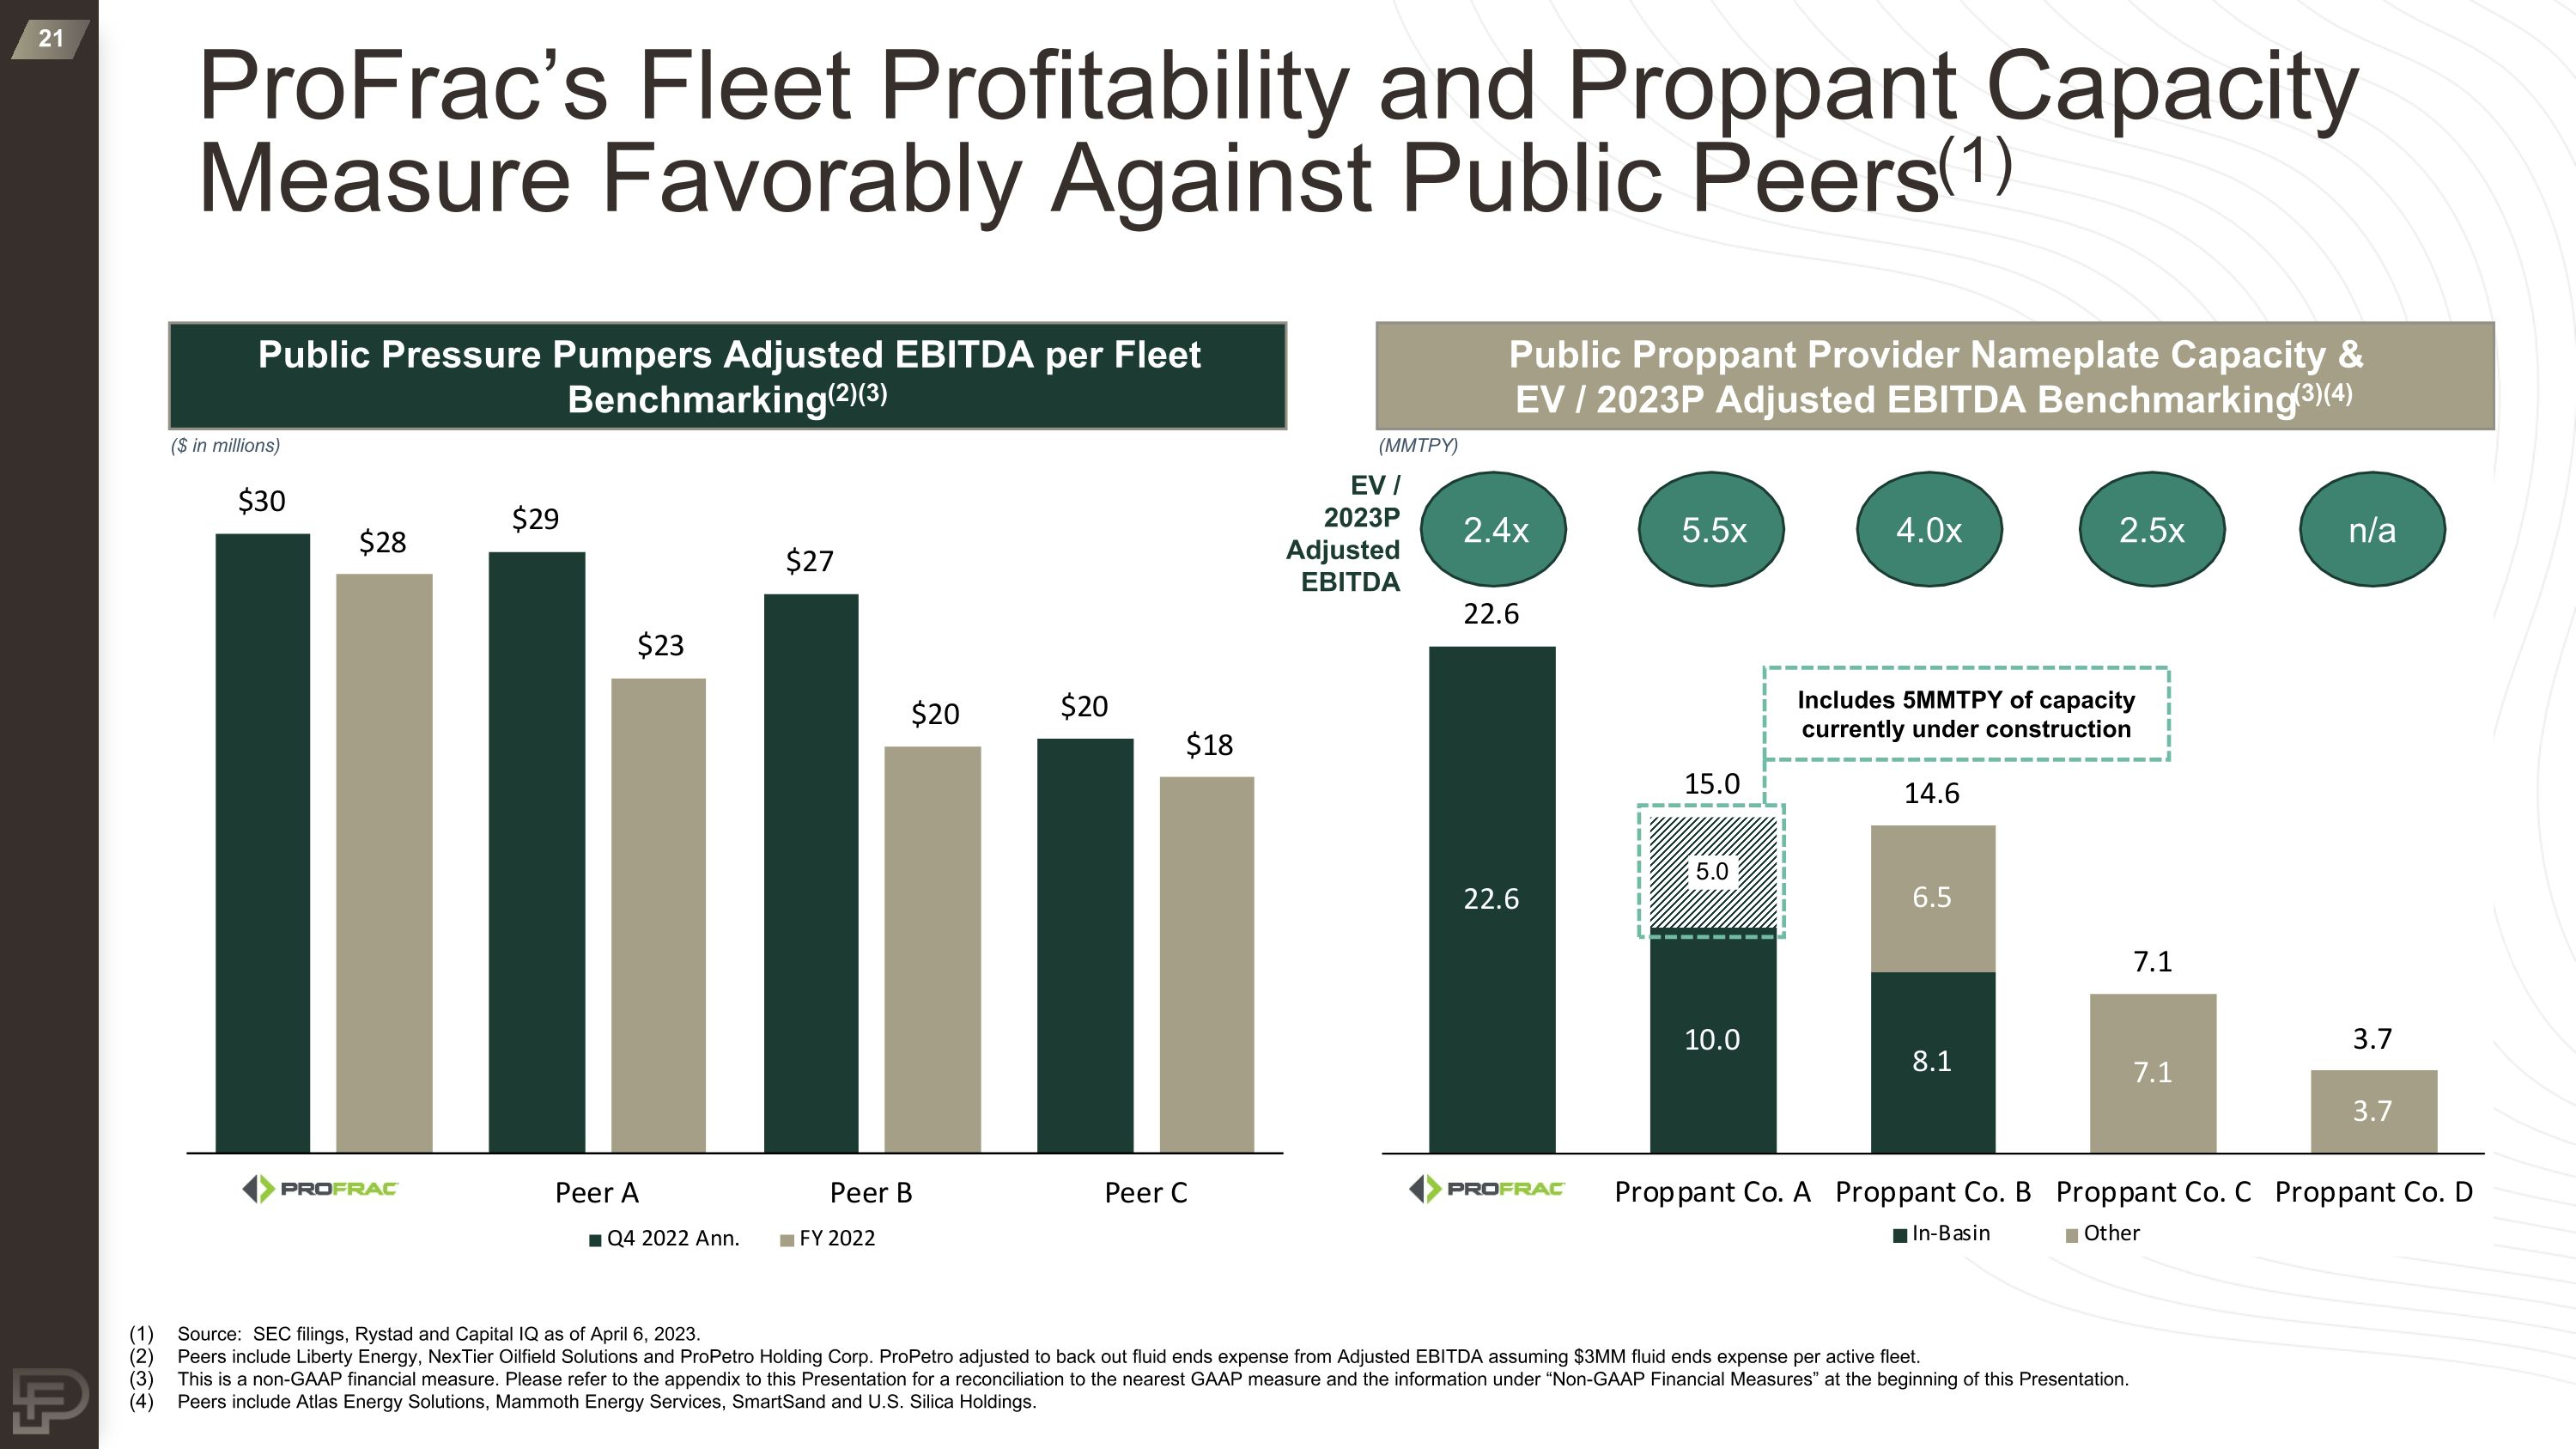
ProFrac’s Fleet Profitability and Proppant Capacity Measure Favorably Against Public Peers(1) Public Proppant Provider Nameplate Capacity & EV / 2023P Adjusted EBITDA Benchmarking(3)(4) Public Pressure Pumpers Adjusted EBITDA per Fleet Benchmarking(2)(3) ($ in millions) (MMTPY) Source: SEC filings, Rystad and Capital IQ as of April 6, 2023. Peers include Liberty Energy, NexTier Oilfield Solutions and ProPetro Holding Corp. ProPetro adjusted to back out fluid ends expense from Adjusted EBITDA assuming $3MM fluid ends expense per active fleet. This is a non-GAAP financial measure. Please refer to the appendix to this Presentation for a reconciliation to the nearest GAAP measure and the information under “Non-GAAP Financial Measures” at the beginning of this Presentation. Peers include Atlas Energy Solutions, Mammoth Energy Services, SmartSand and U.S. Silica Holdings. 5.5x EV / 2023P Adjusted EBITDA 4.0x 2.5x n/a 2.4x Includes 5MMTPY of capacity currently under construction
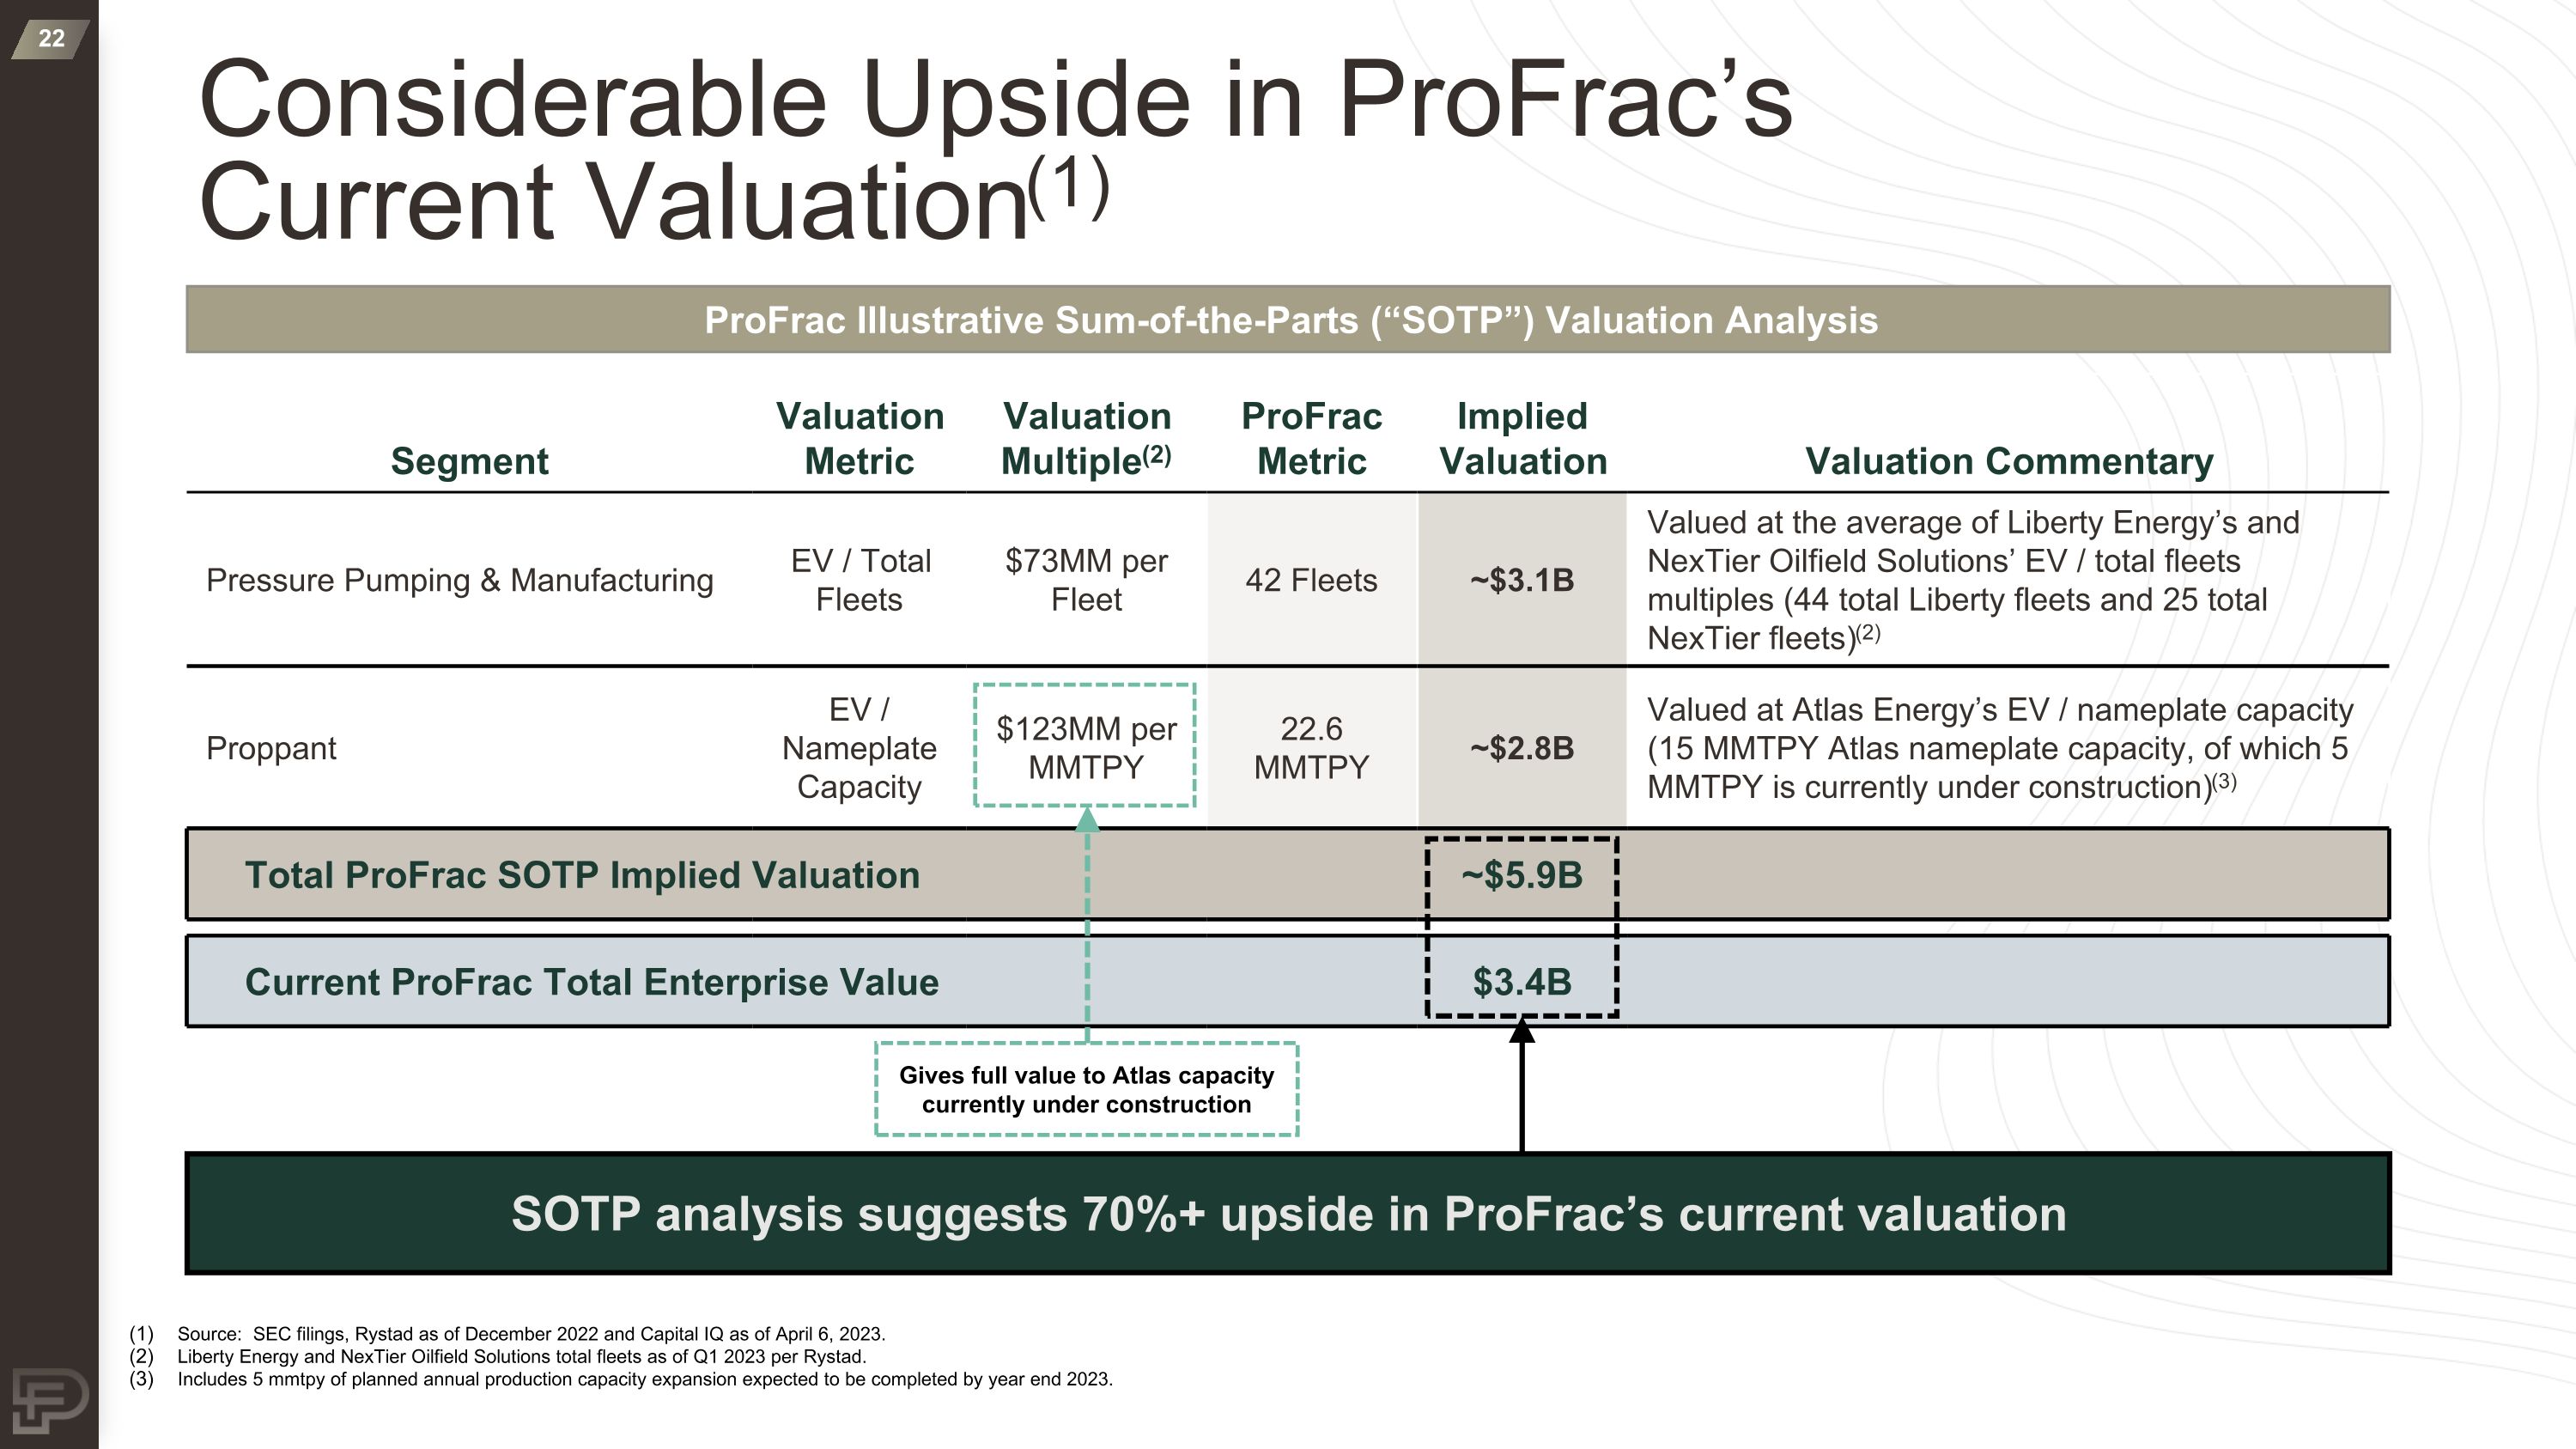
Source: SEC filings, Rystad as of December 2022 and Capital IQ as of April 6, 2023. Liberty Energy and NexTier Oilfield Solutions total fleets as of Q1 2023 per Rystad. Includes 5 mmtpy of planned annual production capacity expansion expected to be completed by year end 2023. Considerable Upside in ProFrac’s Current Valuation(1) Segment Valuation Metric Valuation Multiple(2) ProFrac Metric Implied Valuation Valuation Commentary Pressure Pumping & Manufacturing EV / Total Fleets $73MM per Fleet 42 Fleets ~$3.1B Valued at the average of Liberty Energy’s and NexTier Oilfield Solutions’ EV / total fleets multiples (44 total Liberty fleets and 25 total NexTier fleets)(2) Proppant EV / Nameplate Capacity $123MM per MMTPY 22.6 MMTPY ~$2.8B Valued at Atlas Energy’s EV / nameplate capacity (15 MMTPY Atlas nameplate capacity, of which 5 MMTPY is currently under construction)(3) Total ProFrac SOTP Implied Valuation ~$5.9B Current ProFrac Total Enterprise Value $3.4B ProFrac Illustrative Sum-of-the-Parts (“SOTP”) Valuation Analysis SOTP analysis suggests 70%+ upside in ProFrac’s current valuation Gives full value to Atlas capacity currently under construction
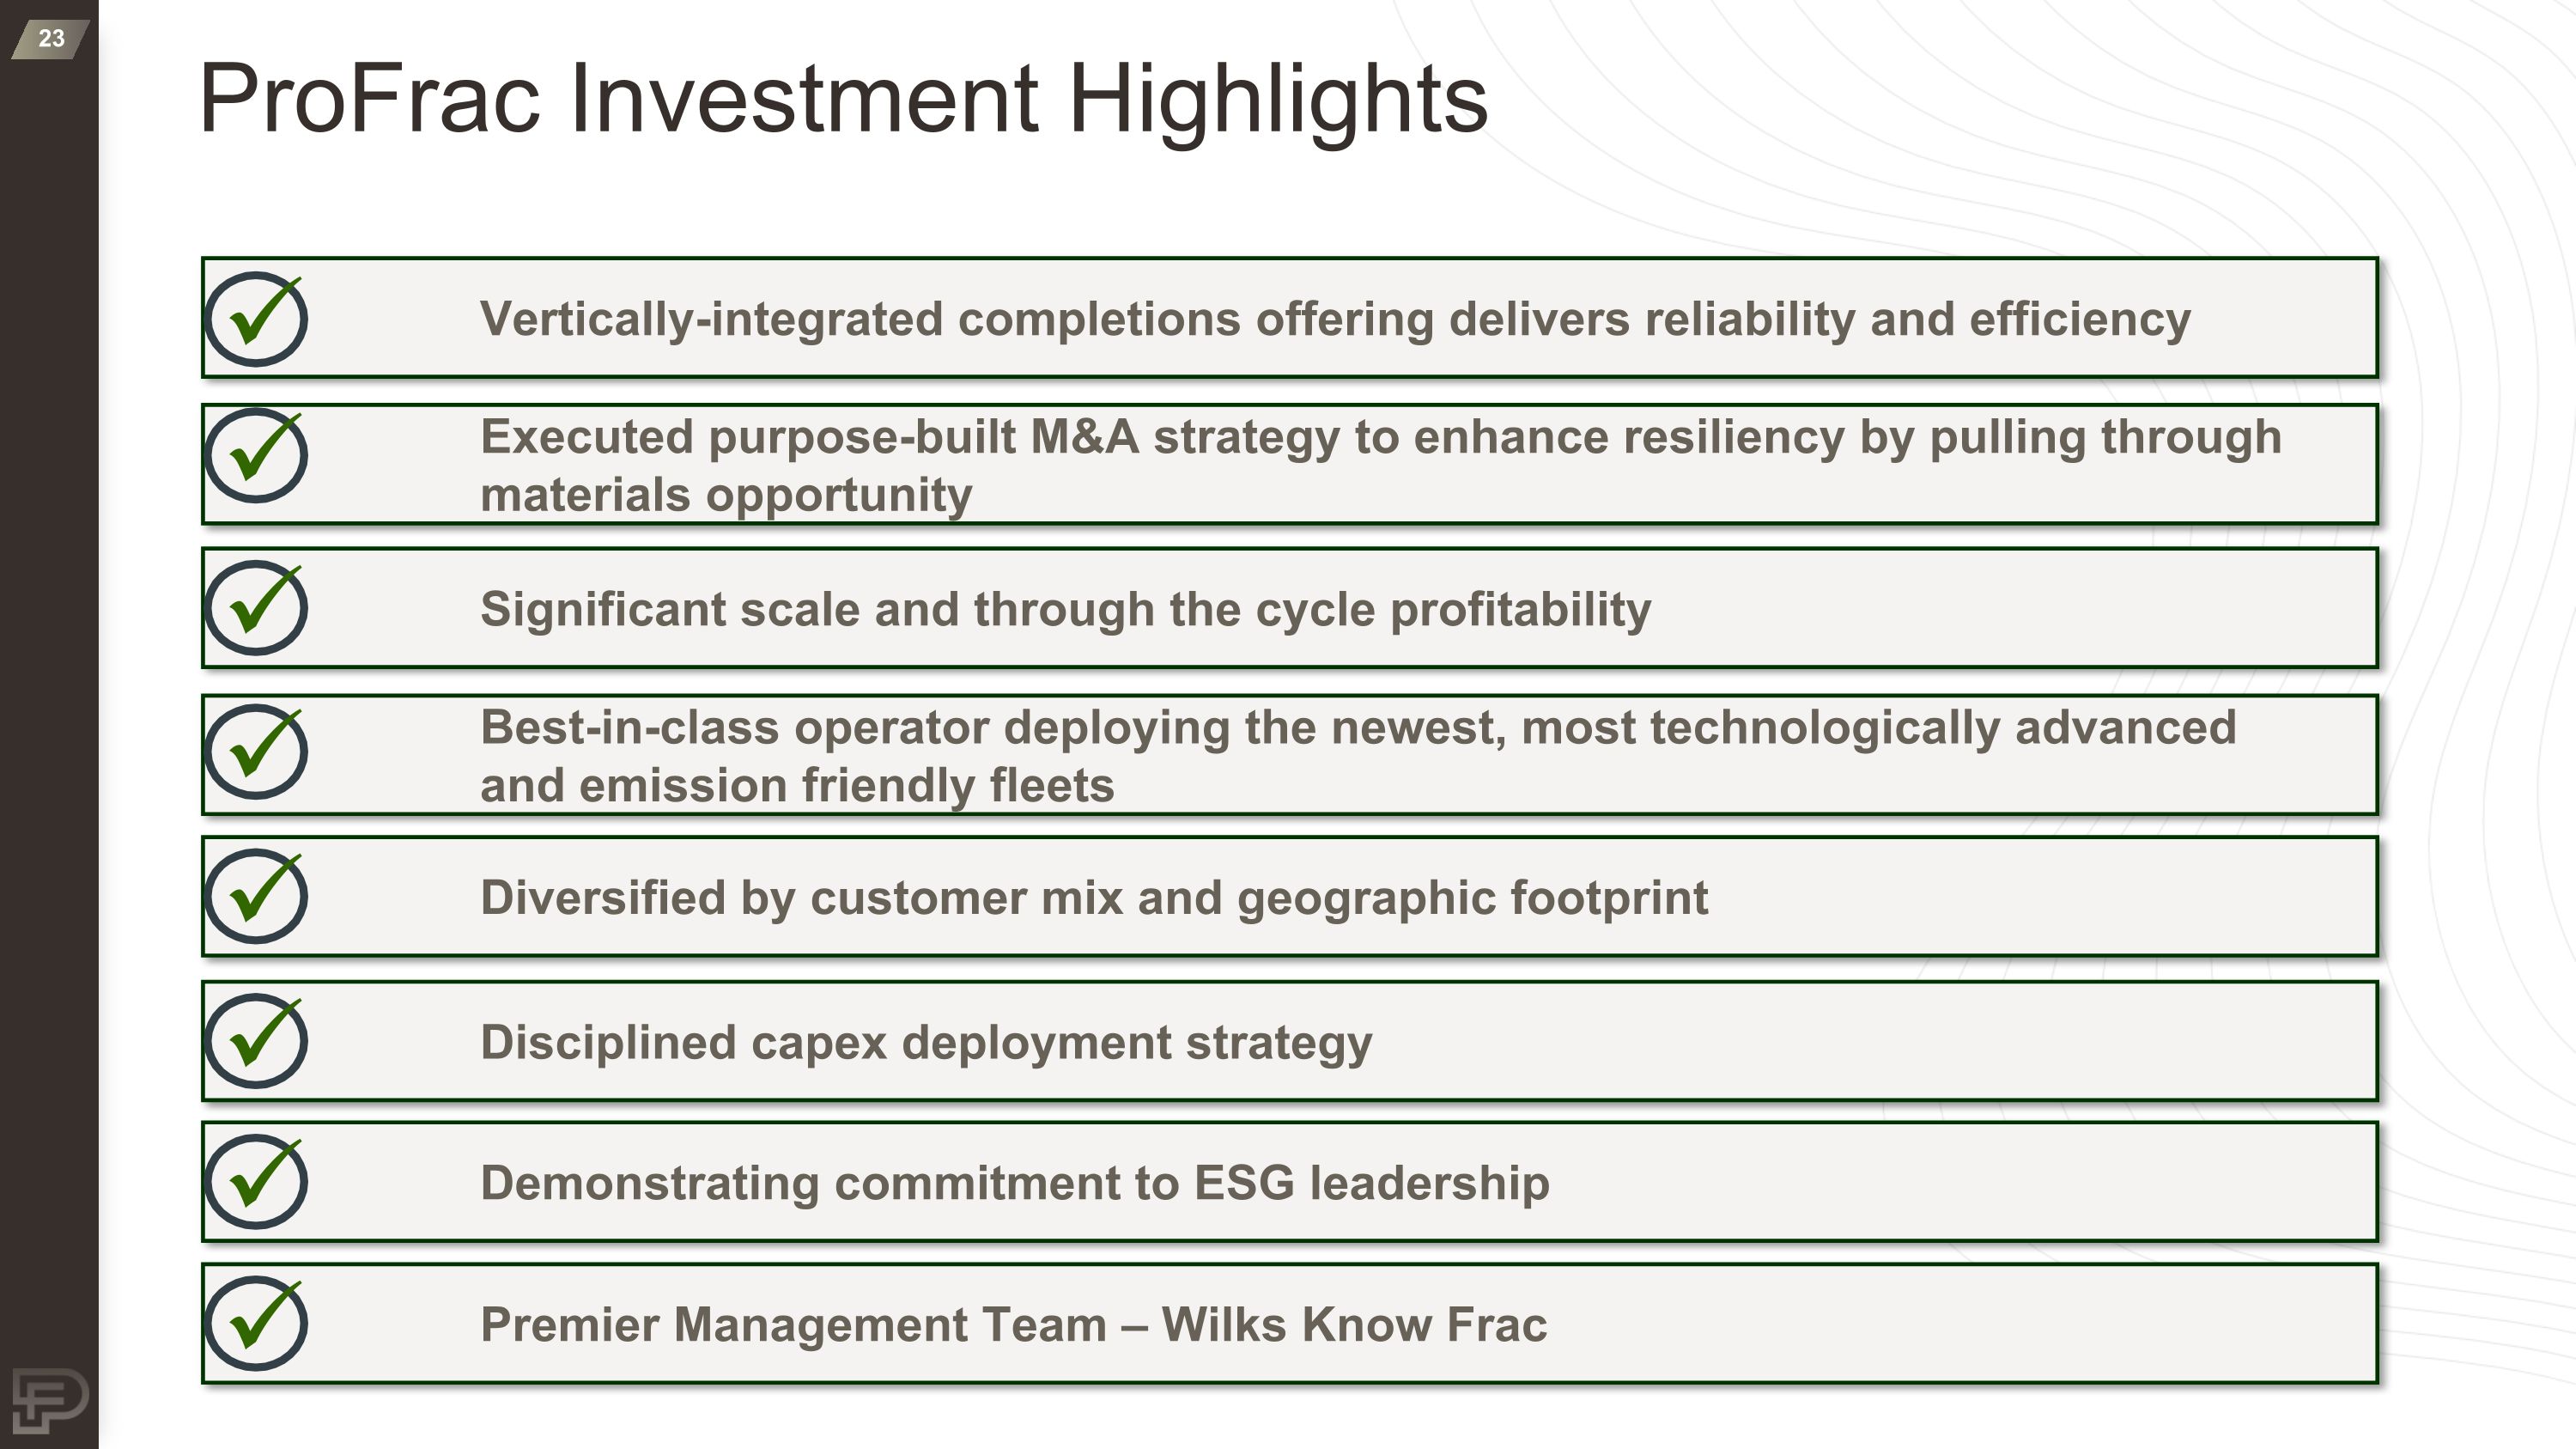
ProFrac Investment Highlights Add something about Lowest All in Cost for the Customer – put that into #5 Diversification across customers (blue chip and high growth) for #5 Lex: Need to make these 5 – 7 words on one line Lex says maybe no boxes if it looks beter Significant scale and through the cycle profitability Executed purpose-built M&A strategy to enhance resiliency by pulling through materials opportunity Disciplined capex deployment strategy Premier Management Team – Wilks Know Frac Vertically-integrated completions offering delivers reliability and efficiency Best-in-class operator deploying the newest, most technologically advanced and emission friendly fleets Diversified by customer mix and geographic footprint Demonstrating commitment to ESG leadership

Appendix
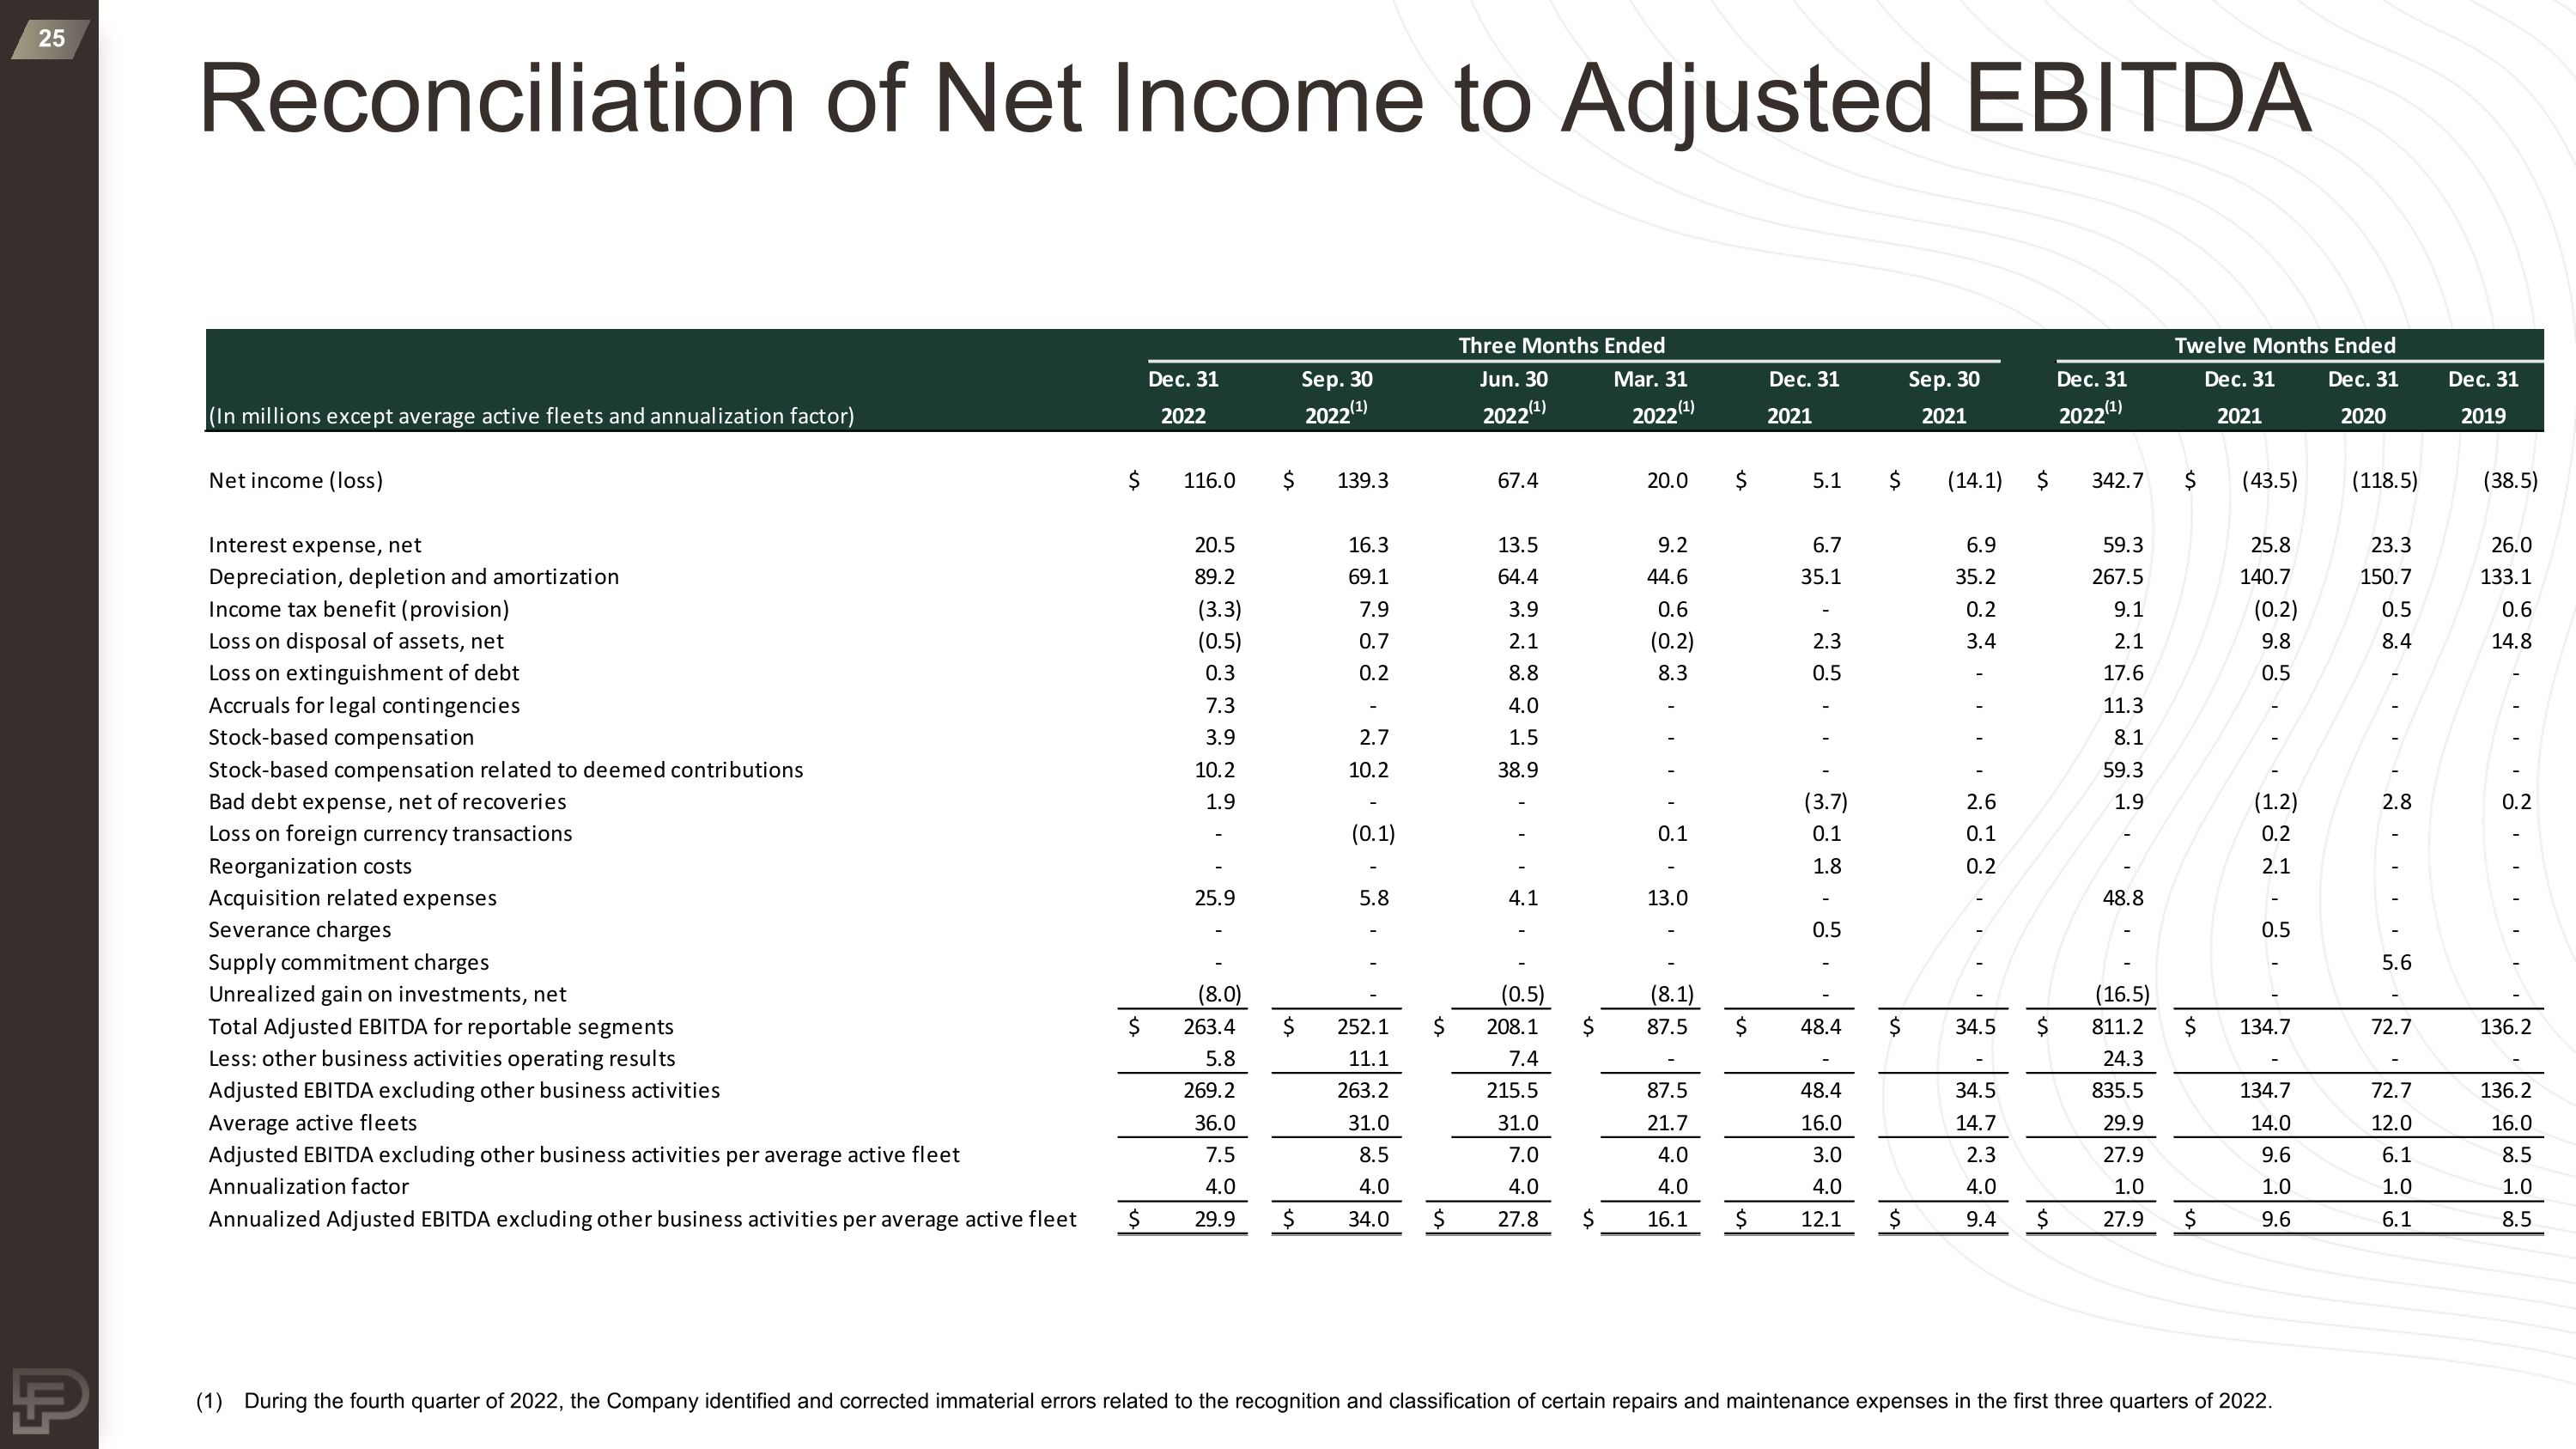
Reconciliation of Net Income to Adjusted EBITDA (1) During the fourth quarter of 2022, the Company identified and corrected immaterial errors related to the recognition and classification of certain repairs and maintenance expenses in the first three quarters of 2022.
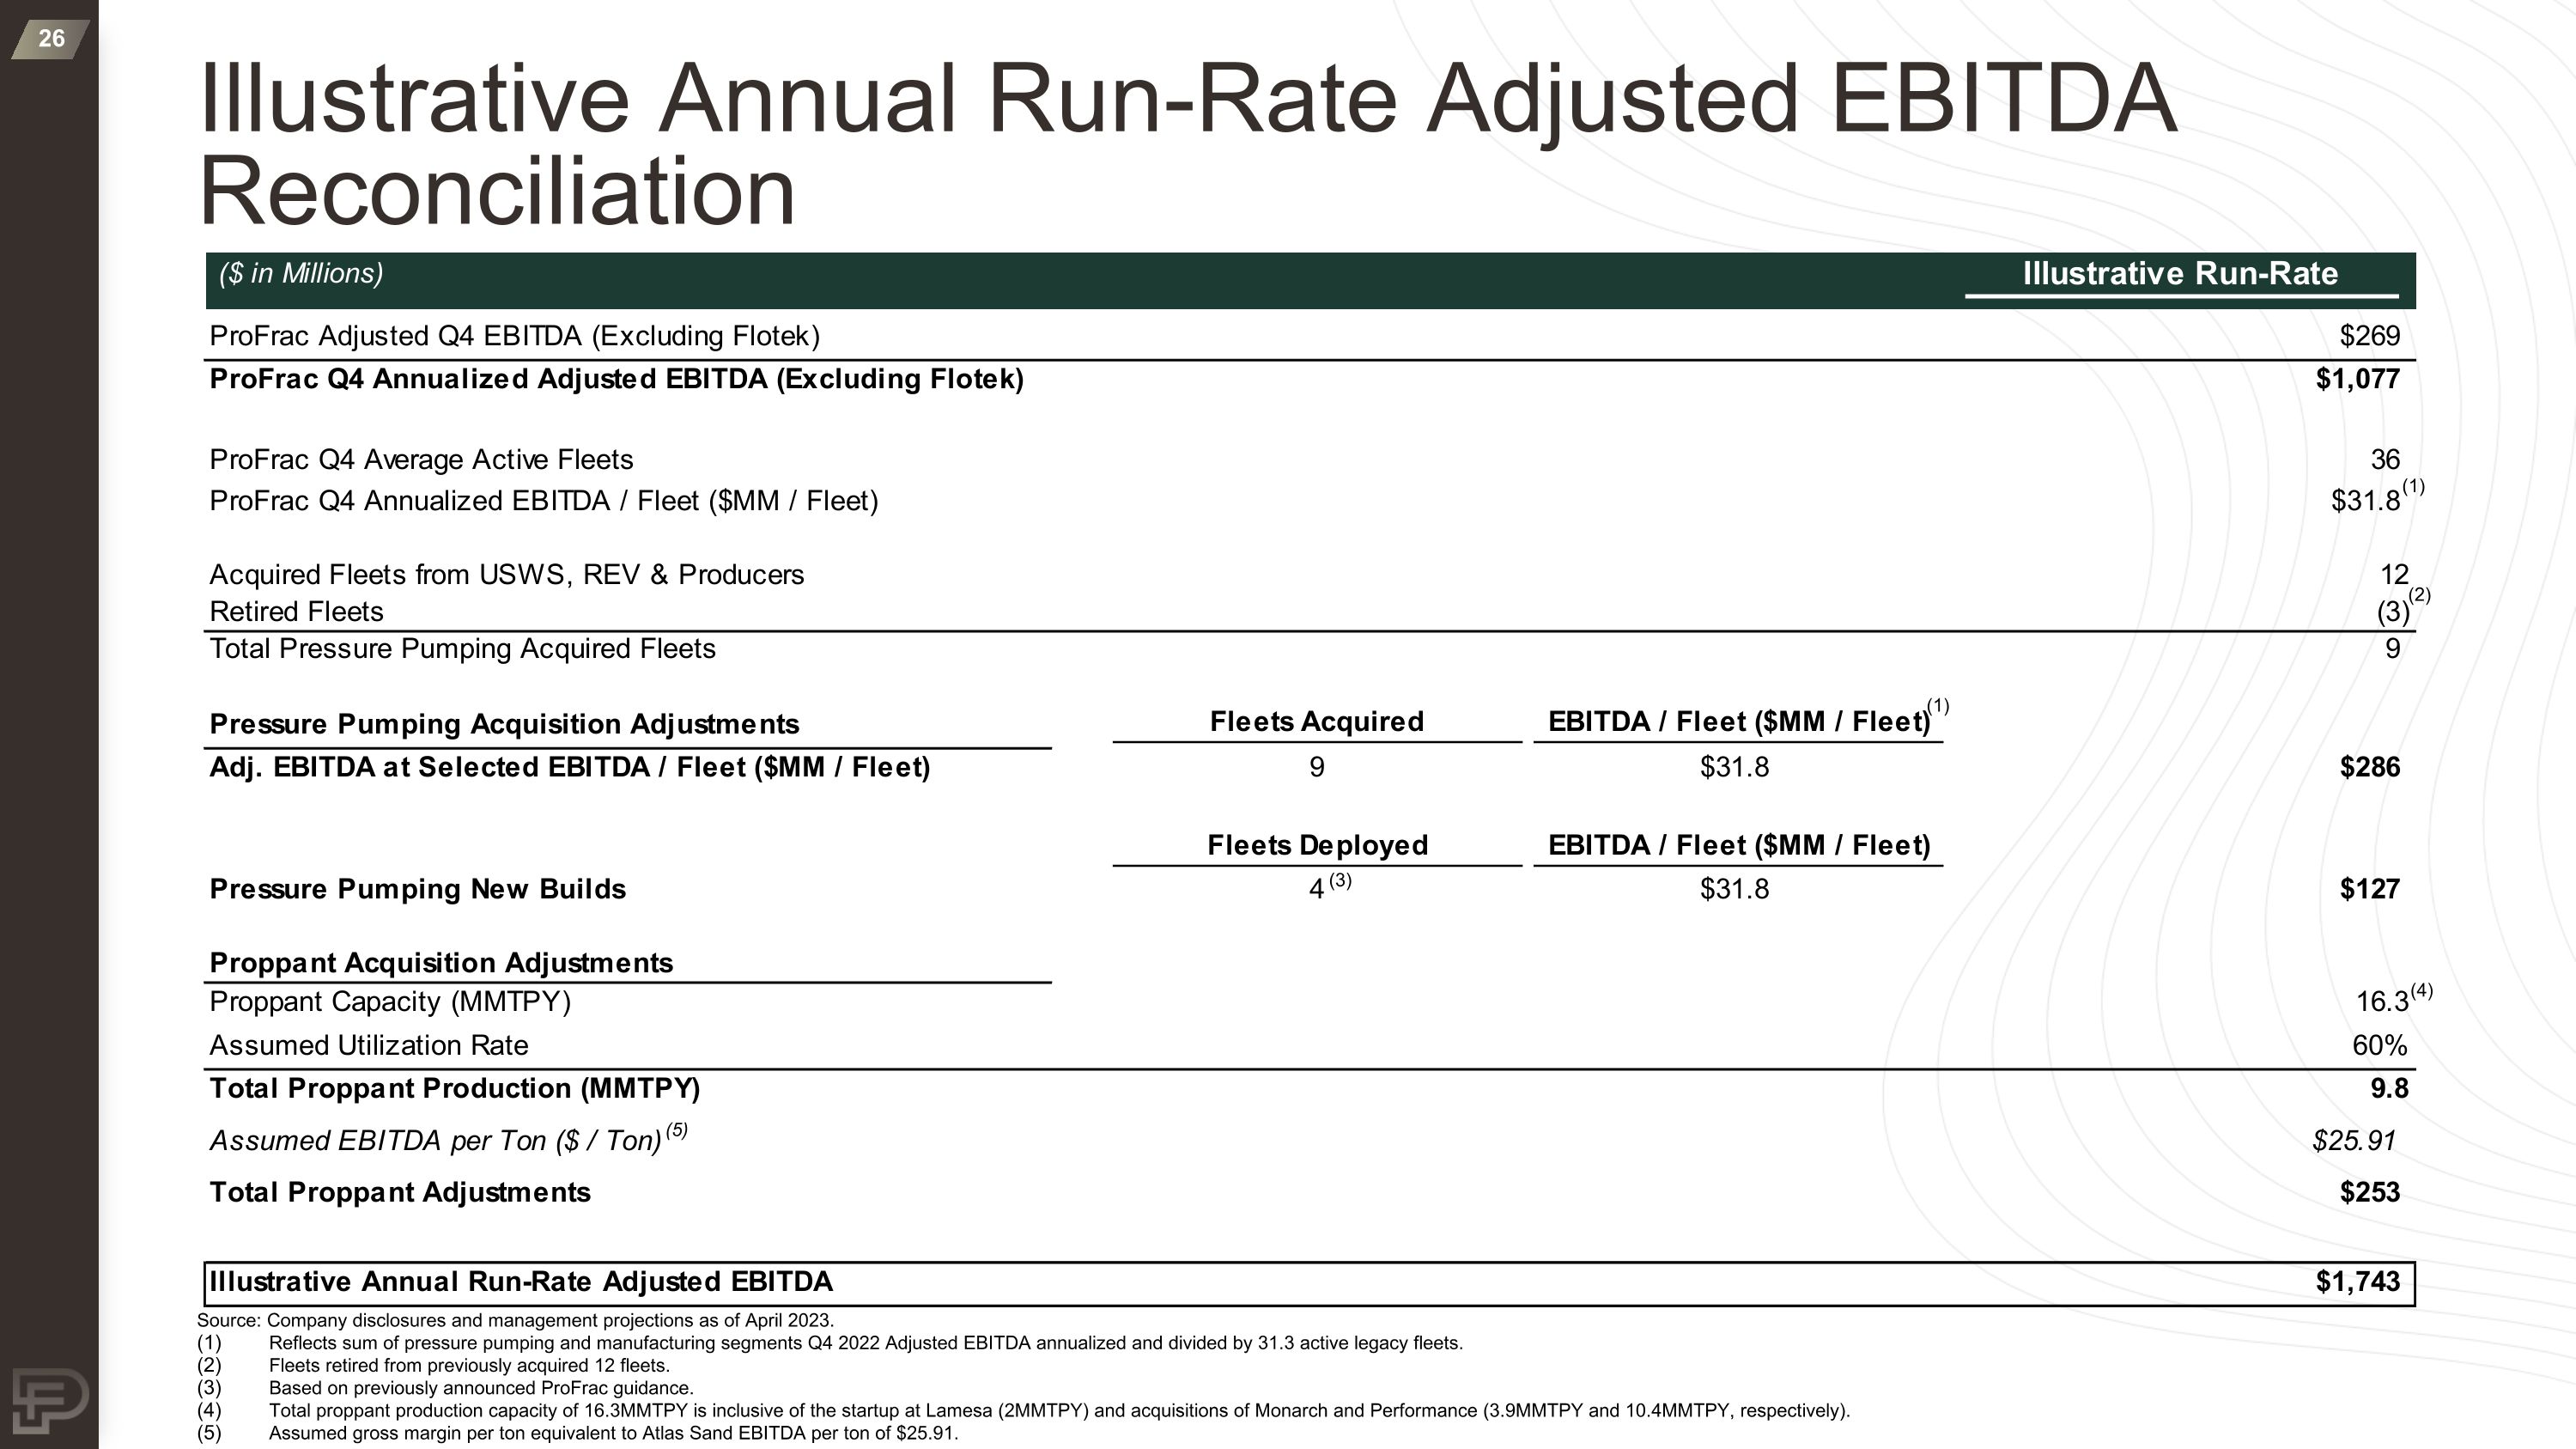
Illustrative Annual Run-Rate Adjusted EBITDA Reconciliation Source: Company disclosures and management projections as of April 2023. Reflects sum of pressure pumping and manufacturing segments Q4 2022 Adjusted EBITDA annualized and divided by 31.3 active legacy fleets. Fleets retired from previously acquired 12 fleets. Based on previously announced ProFrac guidance. Total proppant production capacity of 16.3MMTPY is inclusive of the startup at Lamesa (2MMTPY) and acquisitions of Monarch and Performance (3.9MMTPY and 10.4MMTPY, respectively). Assumed gross margin per ton equivalent to Atlas Sand EBITDA per ton of $25.91. (5) (4) (1) (3) (1) (2)
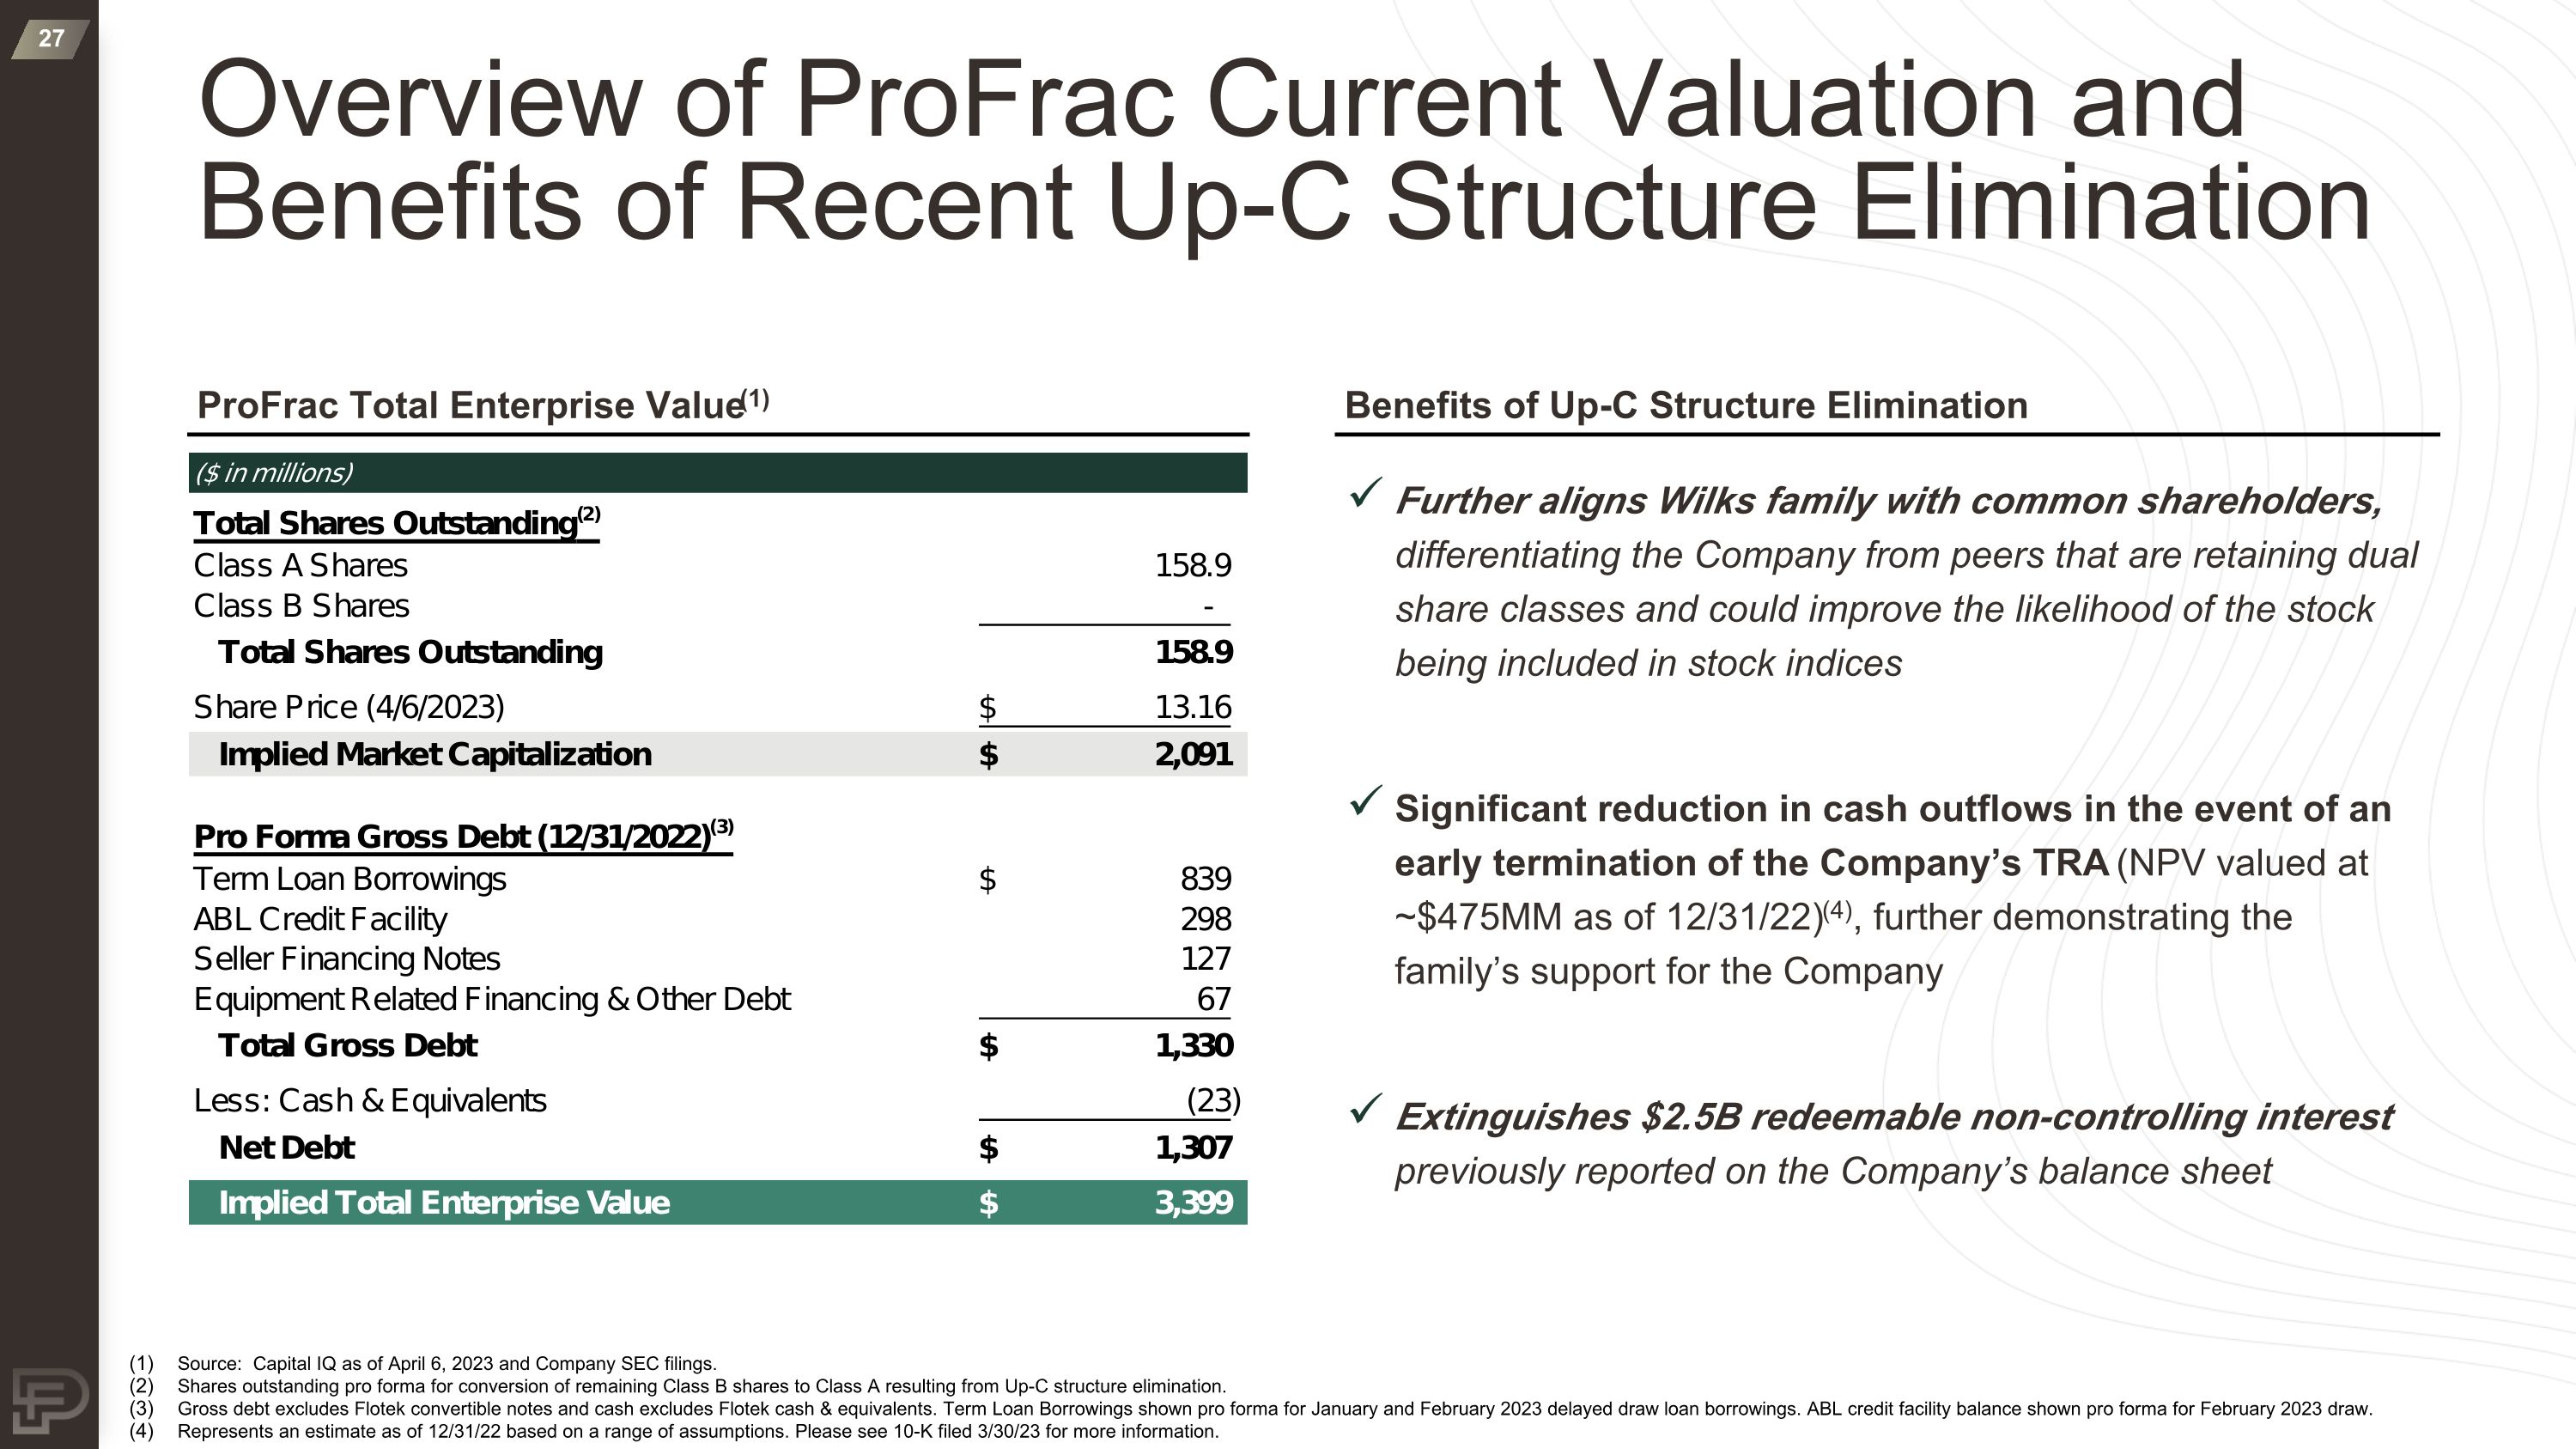
Overview of ProFrac Current Valuation and Benefits of Recent Up-C Structure Elimination ProFrac Total Enterprise Value(1) Benefits of Up-C Structure Elimination Further aligns Wilks family with common shareholders, differentiating the Company from peers that are retaining dual share classes and could improve the likelihood of the stock being included in stock indices Significant reduction in cash outflows in the event of an early termination of the Company’s TRA (NPV valued at ~$475MM as of 12/31/22)(4), further demonstrating the family’s support for the Company Extinguishes $2.5B redeemable non-controlling interest previously reported on the Company’s balance sheet Source: Capital IQ as of April 6, 2023 and Company SEC filings. Shares outstanding pro forma for conversion of remaining Class B shares to Class A resulting from Up-C structure elimination. Gross debt excludes Flotek convertible notes and cash excludes Flotek cash & equivalents. Term Loan Borrowings shown pro forma for January and February 2023 delayed draw loan borrowings. ABL credit facility balance shown pro forma for February 2023 draw. Represents an estimate as of 12/31/22 based on a range of assumptions. Please see 10-K filed 3/30/23 for more information.
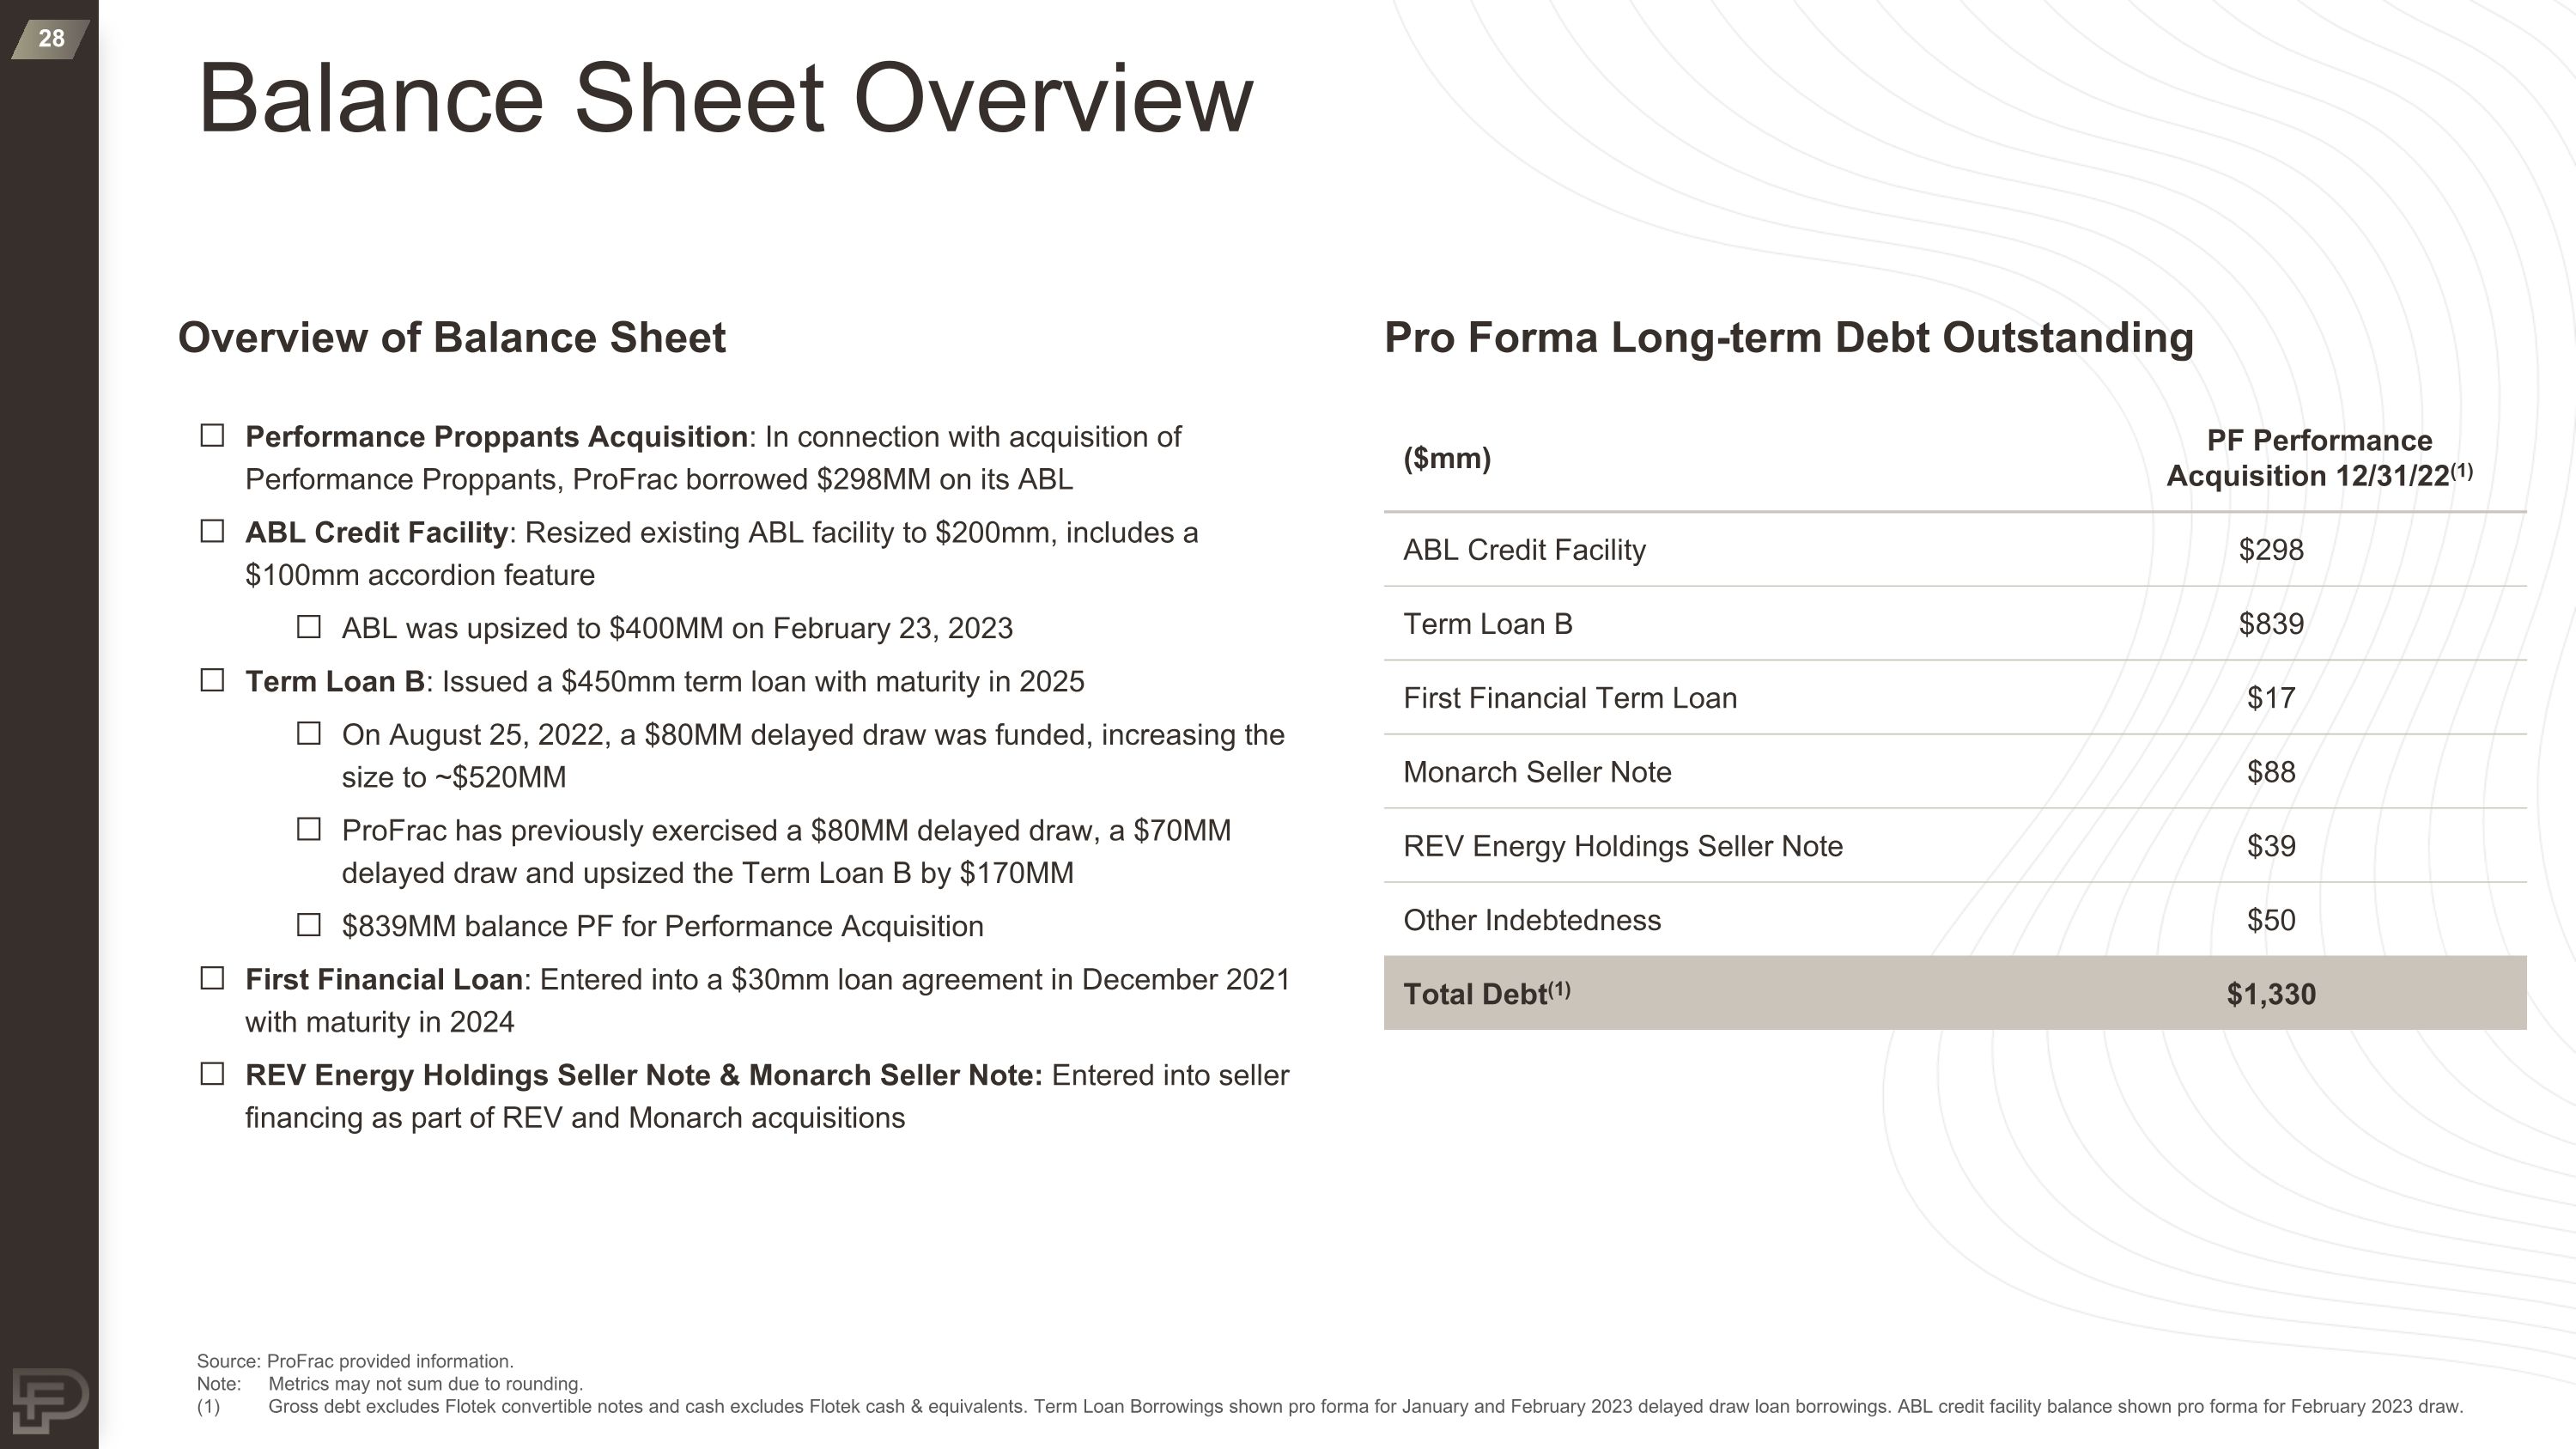
Source: ProFrac provided information. Note: Metrics may not sum due to rounding. (1) Gross debt excludes Flotek convertible notes and cash excludes Flotek cash & equivalents. Term Loan Borrowings shown pro forma for January and February 2023 delayed draw loan borrowings. ABL credit facility balance shown pro forma for February 2023 draw. Overview of Balance Sheet Pro Forma Long-term Debt Outstanding Performance Proppants Acquisition: In connection with acquisition of Performance Proppants, ProFrac borrowed $298MM on its ABL ABL Credit Facility: Resized existing ABL facility to $200mm, includes a $100mm accordion feature ABL was upsized to $400MM on February 23, 2023 Term Loan B: Issued a $450mm term loan with maturity in 2025 On August 25, 2022, a $80MM delayed draw was funded, increasing the size to ~$520MM ProFrac has previously exercised a $80MM delayed draw, a $70MM delayed draw and upsized the Term Loan B by $170MM $839MM balance PF for Performance Acquisition First Financial Loan: Entered into a $30mm loan agreement in December 2021 with maturity in 2024 REV Energy Holdings Seller Note & Monarch Seller Note: Entered into seller financing as part of REV and Monarch acquisitions ($mm) PF Performance Acquisition 12/31/22(1) ABL Credit Facility $298 Term Loan B $839 First Financial Term Loan $17 Monarch Seller Note $88 REV Energy Holdings Seller Note $39 Other Indebtedness $50 Total Debt(1) $1,330 Balance Sheet Overview
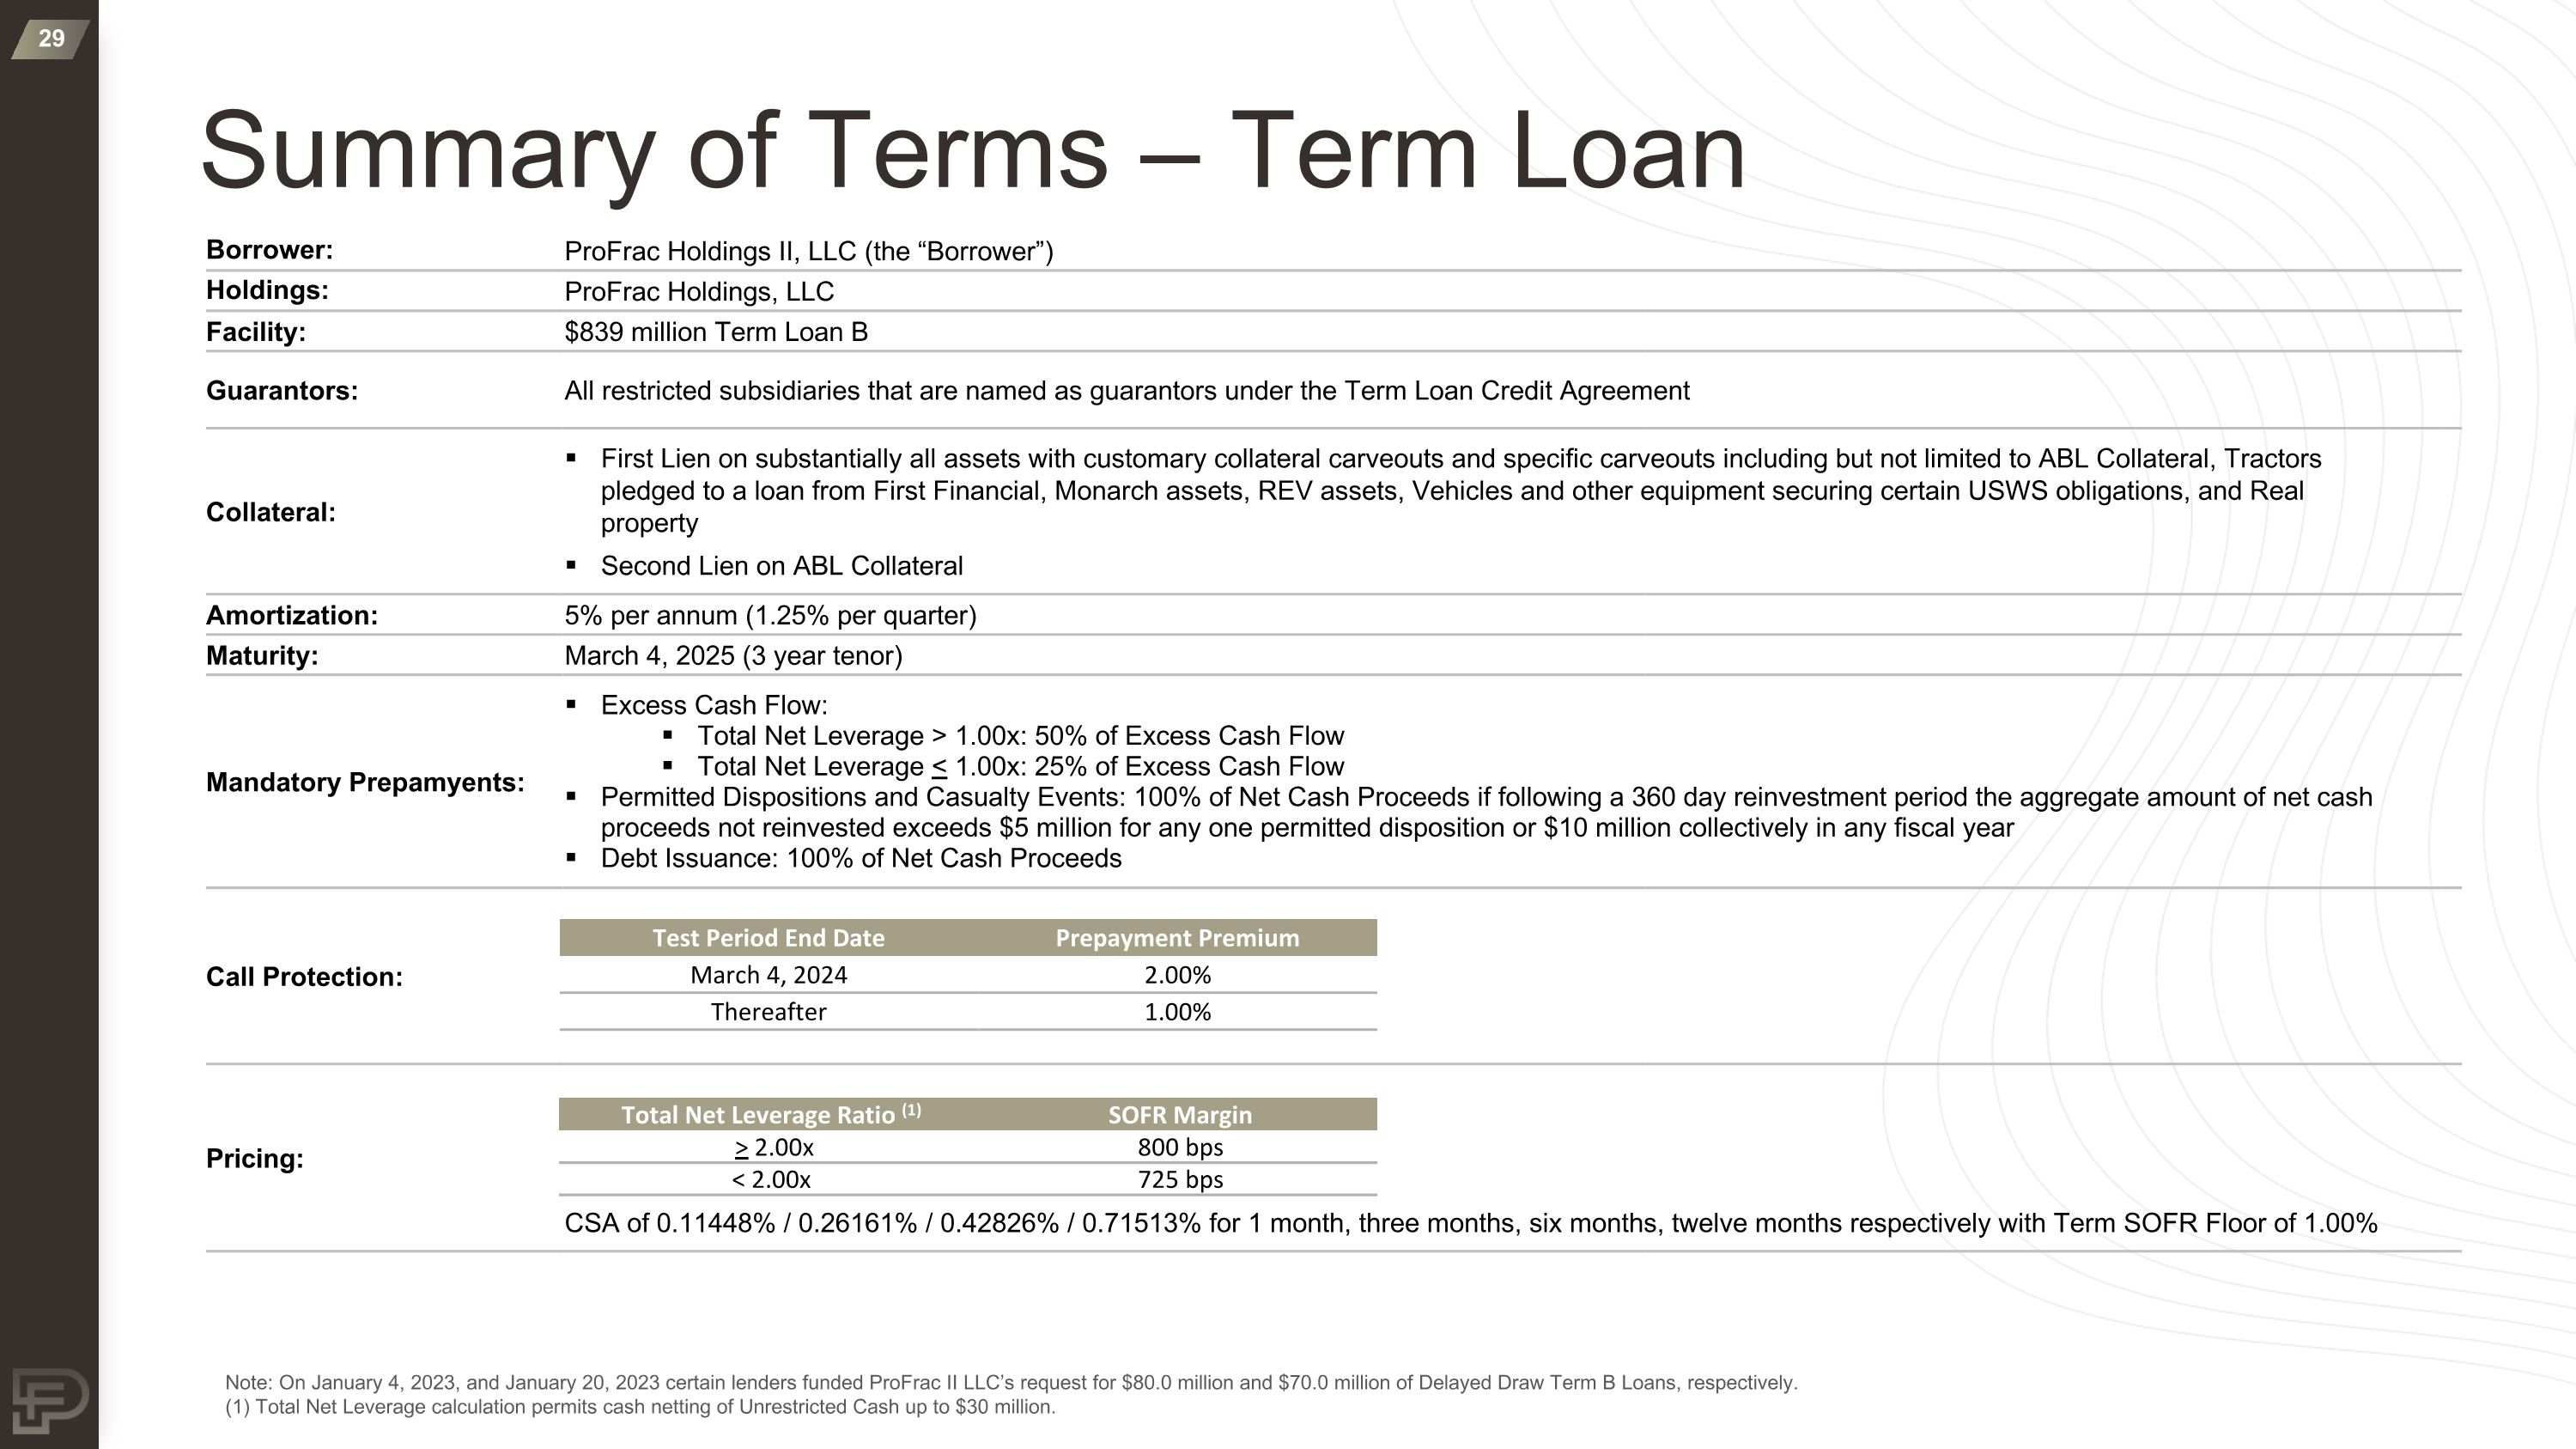
Summary of Terms – Term Loan Borrower: ProFrac Holdings II, LLC (the “Borrower”) Holdings: ProFrac Holdings, LLC Facility: $839 million Term Loan B Guarantors: All restricted subsidiaries that are named as guarantors under the Term Loan Credit Agreement Collateral: First Lien on substantially all assets with customary collateral carveouts and specific carveouts including but not limited to ABL Collateral, Tractors pledged to a loan from First Financial, Monarch assets, REV assets, Vehicles and other equipment securing certain USWS obligations, and Real property Second Lien on ABL Collateral Amortization: 5% per annum (1.25% per quarter) Maturity: March 4, 2025 (3 year tenor) Mandatory Prepamyents: Excess Cash Flow: Total Net Leverage > 1.00x: 50% of Excess Cash Flow Total Net Leverage < 1.00x: 25% of Excess Cash Flow Permitted Dispositions and Casualty Events: 100% of Net Cash Proceeds if following a 360 day reinvestment period the aggregate amount of net cash proceeds not reinvested exceeds $5 million for any one permitted disposition or $10 million collectively in any fiscal year Debt Issuance: 100% of Net Cash Proceeds Call Protection: Pricing: CSA of 0.11448% / 0.26161% / 0.42826% / 0.71513% for 1 month, three months, six months, twelve months respectively with Term SOFR Floor of 1.00% Note: On January 4, 2023, and January 20, 2023 certain lenders funded ProFrac II LLC’s request for $80.0 million and $70.0 million of Delayed Draw Term B Loans, respectively. (1) Total Net Leverage calculation permits cash netting of Unrestricted Cash up to $30 million. Test Period End Date Prepayment Premium March 4, 2024 2.00% Thereafter 1.00% Total Net Leverage Ratio (1) SOFR Margin > 2.00x 800 bps < 2.00x 725 bps
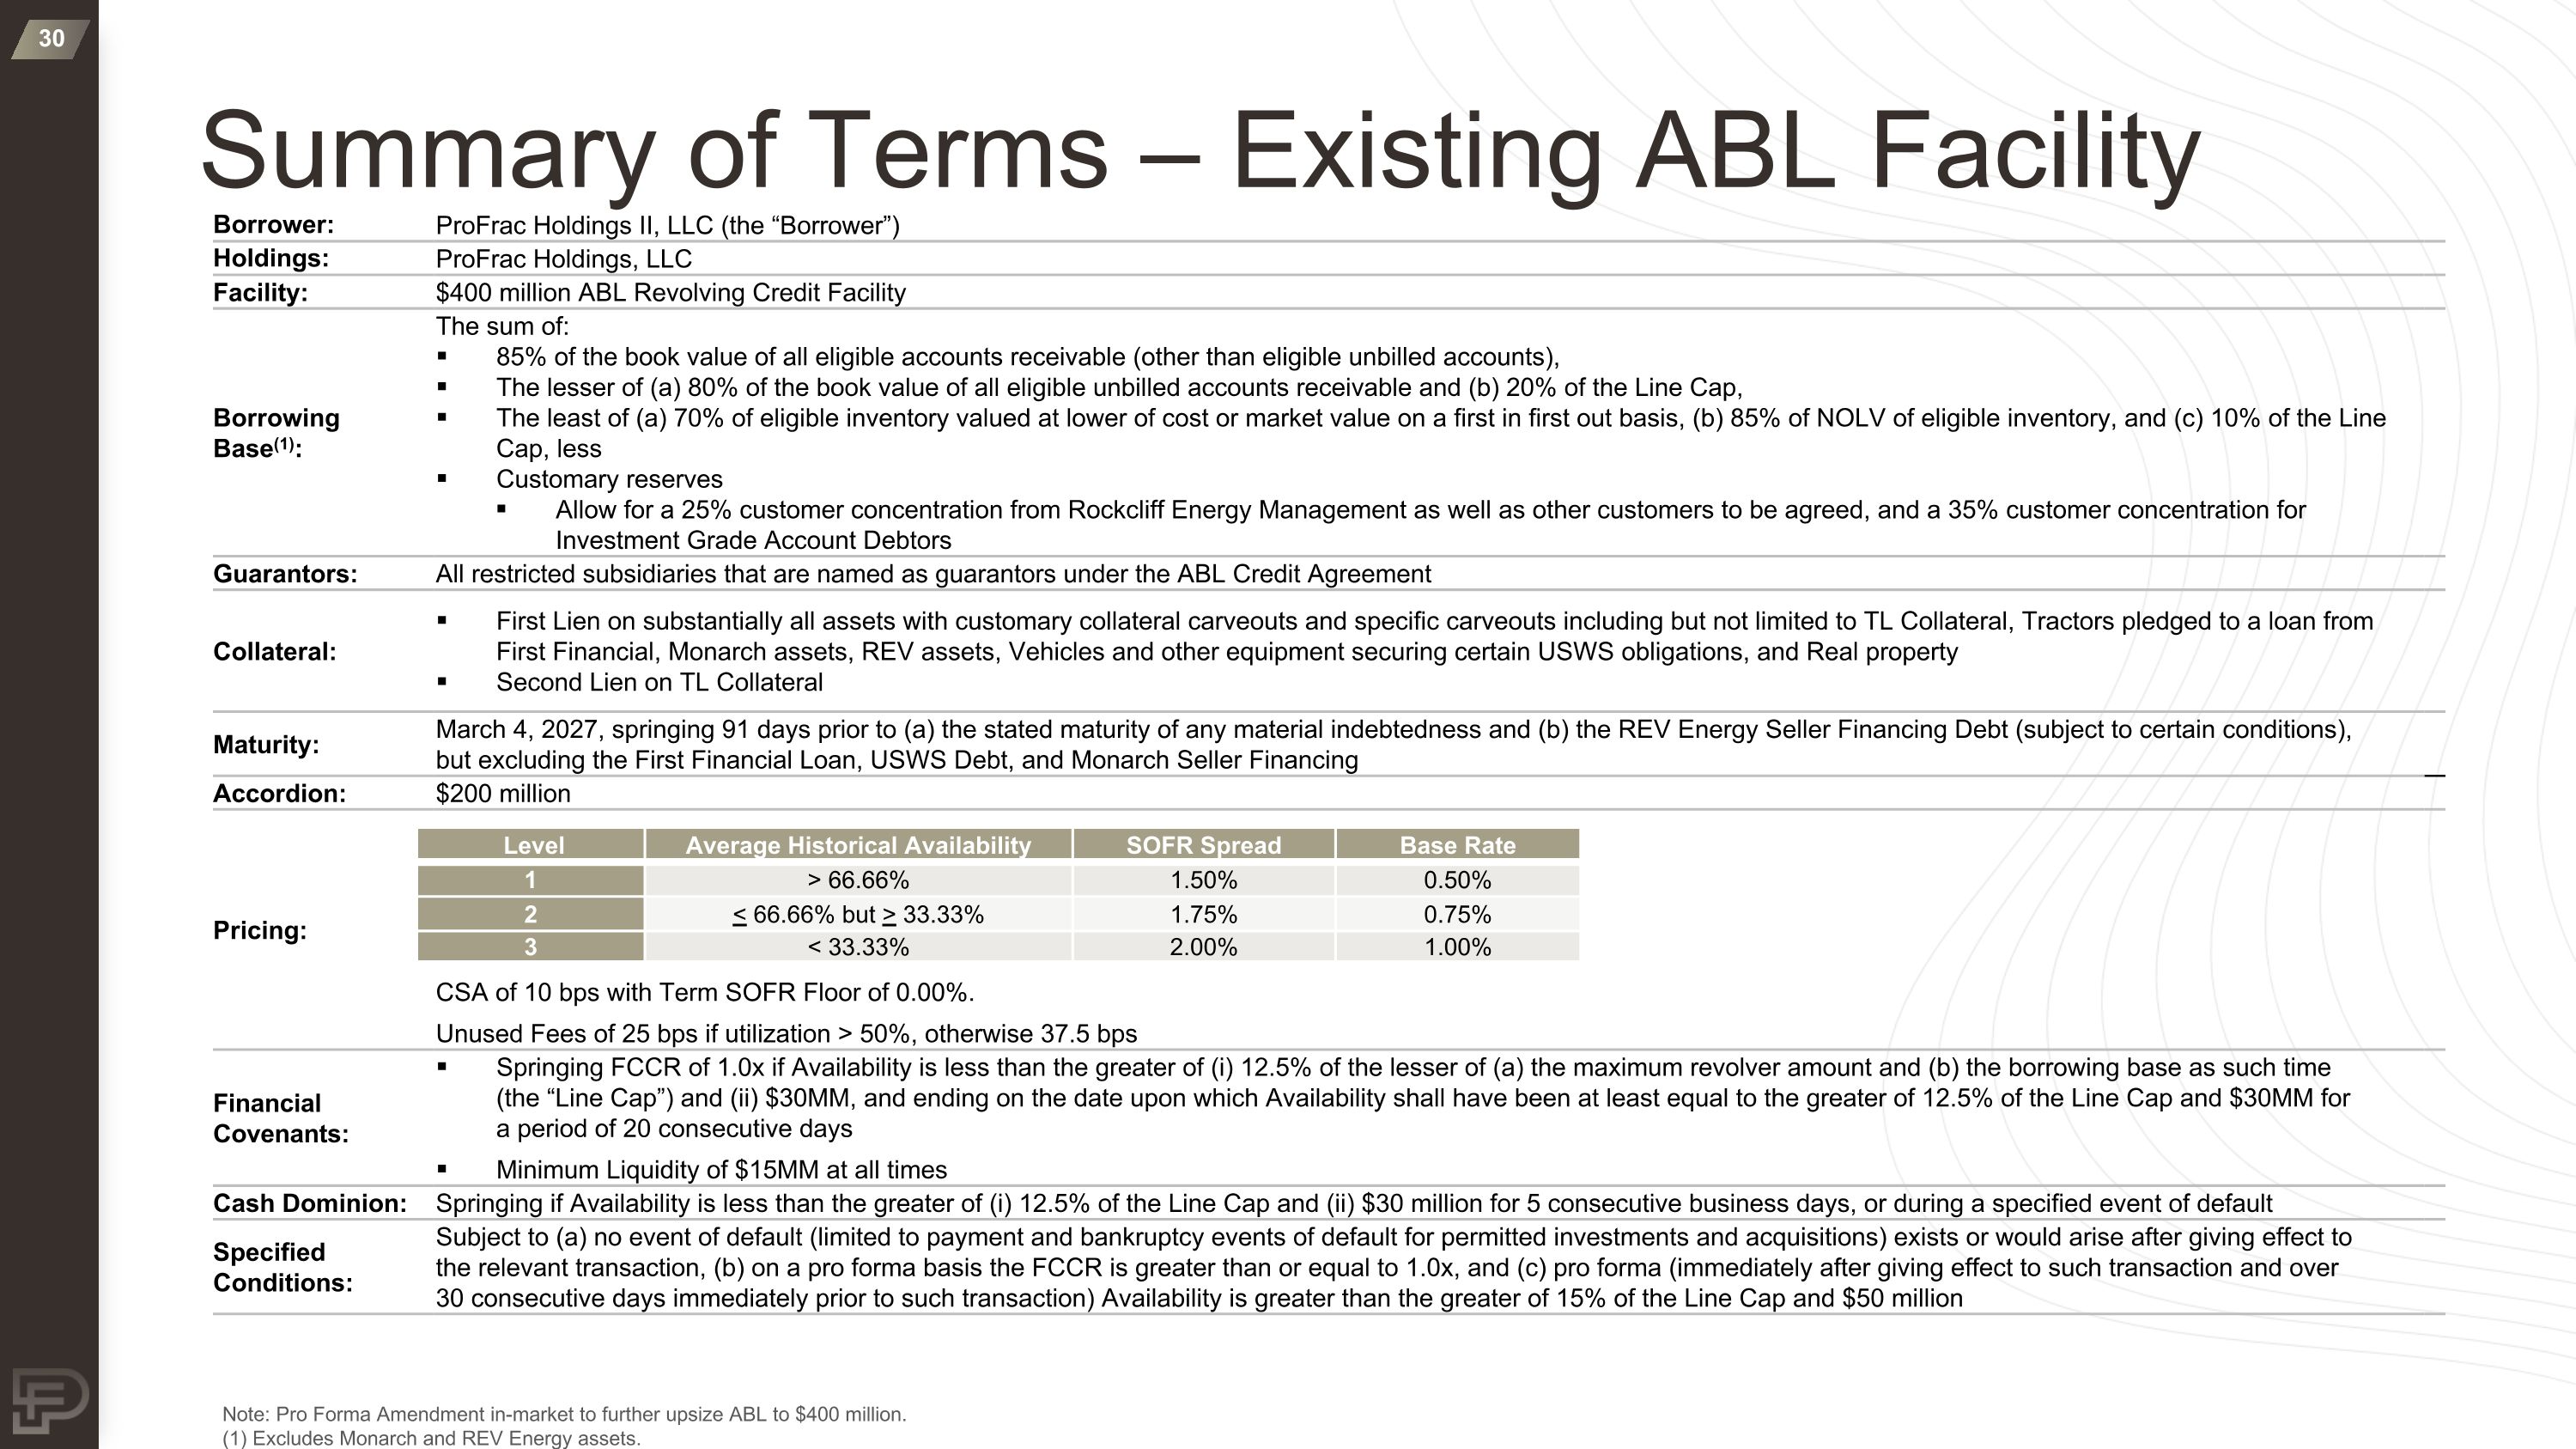
Summary of Terms – Existing ABL Facility Borrower: ProFrac Holdings II, LLC (the “Borrower”) Holdings: ProFrac Holdings, LLC Facility: $400 million ABL Revolving Credit Facility Borrowing Base(1): The sum of: 85% of the book value of all eligible accounts receivable (other than eligible unbilled accounts), The lesser of (a) 80% of the book value of all eligible unbilled accounts receivable and (b) 20% of the Line Cap, The least of (a) 70% of eligible inventory valued at lower of cost or market value on a first in first out basis, (b) 85% of NOLV of eligible inventory, and (c) 10% of the Line Cap, less Customary reserves Allow for a 25% customer concentration from Rockcliff Energy Management as well as other customers to be agreed, and a 35% customer concentration for Investment Grade Account Debtors Guarantors: All restricted subsidiaries that are named as guarantors under the ABL Credit Agreement Collateral: First Lien on substantially all assets with customary collateral carveouts and specific carveouts including but not limited to TL Collateral, Tractors pledged to a loan from First Financial, Monarch assets, REV assets, Vehicles and other equipment securing certain USWS obligations, and Real property Second Lien on TL Collateral Maturity: March 4, 2027, springing 91 days prior to (a) the stated maturity of any material indebtedness and (b) the REV Energy Seller Financing Debt (subject to certain conditions), but excluding the First Financial Loan, USWS Debt, and Monarch Seller Financing Accordion: $200 million Pricing: CSA of 10 bps with Term SOFR Floor of 0.00%. Unused Fees of 25 bps if utilization > 50%, otherwise 37.5 bps Financial Covenants: Springing FCCR of 1.0x if Availability is less than the greater of (i) 12.5% of the lesser of (a) the maximum revolver amount and (b) the borrowing base as such time (the “Line Cap”) and (ii) $30MM, and ending on the date upon which Availability shall have been at least equal to the greater of 12.5% of the Line Cap and $30MM for a period of 20 consecutive days Minimum Liquidity of $15MM at all times Cash Dominion: Springing if Availability is less than the greater of (i) 12.5% of the Line Cap and (ii) $30 million for 5 consecutive business days, or during a specified event of default Specified Conditions: Subject to (a) no event of default (limited to payment and bankruptcy events of default for permitted investments and acquisitions) exists or would arise after giving effect to the relevant transaction, (b) on a pro forma basis the FCCR is greater than or equal to 1.0x, and (c) pro forma (immediately after giving effect to such transaction and over 30 consecutive days immediately prior to such transaction) Availability is greater than the greater of 15% of the Line Cap and $50 million Note: Pro Forma Amendment in-market to further upsize ABL to $400 million. (1) Excludes Monarch and REV Energy assets. Level Average Historical Availability SOFR Spread Base Rate 1 > 66.66% 1.50% 0.50% 2 < 66.66% but > 33.33% 1.75% 0.75% 3 < 33.33% 2.00% 1.00%
