

Fourth Quarter and Full Year 2022 Earnings Presentation March 2023 Exhibit 99.2

Safe Harbor Cautionary Statement Regarding Forward-Looking Statements Certain statements in this presentation may be considered “forward-looking statements” within the meaning of the “safe harbor” provisions of the Private Securities Litigation Reform Act of 1995. In some cases, the reader can identify forward-looking statements by words such as “may,” “should,” “expect,” “intend,” “will,” “estimate,” “anticipate,” “believe,” “predict,” or similar words. Forward-looking statements relate to future events or future financial or operating performance of ProFrac Holding Corp. (the “Company” or “ProFrac”). These forward-looking statements include, among other things, statements regarding: the Company’s strategies and plans for growth; the Company’s positioning, resources, capabilities, and expectations for future performance; market and industry expectations; the anticipated benefits of the Company’s acquisitions of FTS International, U.S. Well Services, REV Energy Holdings, Producers Service Holdings, Performance Proppants and the SP Companies; the anticipated benefits and production capacities of the Company’s sand mines; estimates with respect to the profitability and utilization of the Company’s electric, conventional and dual fleets; the Company’s currently expected guidance regarding its first quarter 2023 results of operations; the Company’s currently expected guidance regarding certain valuation and credit statistics through and including 2024, including price to earnings ratio, total enterprise value, Adjusted EBITDA and Adjusted EBIDTA per fleet, free cash flow yield and net debt; the amount of capital available to the Company in future periods; any financial or other information based upon or otherwise incorporating judgments or estimates relating to future performance, events or expectations; any estimates and forecasts of financial and other performance metrics; and the Company’s outlook and financial and other guidance. Such forward-looking statements are based upon assumptions made by the Company as of the date hereof and are subject to risks, uncertainties, and other factors that could cause actual results to differ materially from those expressed or implied by such forward-looking statements. Factors that may cause actual results to differ materially from current expectations include, but are not limited to the inability to achieve the anticipated benefits of the Company's acquisitions of FTS International, U.S. Well Services, REV Energy Holdings, Producers Service Holdings, Performance Proppants and the SP Companies, including risks relating to integrating acquired assets and personnel; the failure to operationalize the Company’s new electric fleets and acquired sand mines in a timely manner or at all; the Company's ability to deploy capital in a manner that furthers the Company's growth strategy, as well as the Company's general ability to execute its business plans; industry conditions, including fluctuations in supply, demand and prices for the Company’s products and services; global and regional economic and financial conditions; the effectiveness of the Company’s risk management strategies; the transition to becoming a public company; and other risks and uncertainties set forth in the sections entitled “Risk Factors” and “Cautionary Note Regarding Forward-Looking Statements” in the Company’s filings with the Securities and Exchange Commission (“SEC”), which are available on the SEC’s website at www.sec.gov. Forward-looking statements are also subject to the risks and other issues described below under “Non-GAAP Financial Measures,” which could cause actual results to differ materially from current expectations included in the Company’s forward-looking statements included in this presentation. Nothing in this press release should be regarded as a representation by any person that the forward-looking statements set forth herein will be achieved or that any of the contemplated results of such forward looking statements will be achieved, including without limitation any expectations about the Company’s operational and financial performance or achievements through and including 2024. There may be additional risks about which the Company is presently unaware or that the Company currently believes are immaterial that could also cause actual results to differ from those contained in the forward-looking statements. The reader should not place undue reliance on forward-looking statements, which speak only as of the date they are made. The Company anticipates that subsequent events and developments will cause its assessments to change. However, while the Company may elect to update these forward-looking statements at some point in the future, it expressly disclaims any duty to update these forward-looking statements, except as otherwise required by law. Non-GAAP Financial Measures We view Adjusted EBITDA and Adjusted EBITDA per fleet as important indicators of performance. We define Adjusted EBITDA as our net income (loss), before (i) interest expense, net, (ii) income tax provision, (iii) depreciation, depletion and amortization, (iv) loss on disposal of assets, (v) stock-based compensation, and (vi) other unusual or non-recurring charges, such as costs and stock compensation expense related to our initial public offering, non-recurring supply commitment charges, certain credit losses, loss on extinguishment of debt and gain on investments. We define Adjusted EBITDA per fleet for a particular period as Adjusted EBITDA calculated as a daily average of active fleets during period. We believe that our presentation of Adjusted EBITDA and Adjusted EBITDA per fleet will provide useful information to investors in assessing our financial condition and results of operations. In particular, we believe Adjusted EBITDA per fleet allows investors to compare the performance of our fleets across comparable periods and against the fleets of our competitors who may have different capital structures, which may make a fleet-for-fleet comparison more difficult. Net income (loss) is the GAAP measure most directly comparable to Adjusted EBITDA, and net income (loss) per fleet is the GAAP measure most directly comparable to Adjusted EBITDA per fleet. Adjusted EBITDA should not be considered as an alternative to net income (loss), and Adjusted EBITDA per fleet should not be considered as an alternative to net income (loss) per fleet. Adjusted EBITDA and Adjusted EBITDA per fleet have important limitations as analytical tools because they exclude some but not all items that affect the most directly comparable GAAP financial measure. Because Adjusted EBITDA and Adjusted EBITDA per fleet may be defined differently by other companies in our industry, our definition of these non-GAAP financial measures may not be comparable to similarly titled measures of other companies, thereby diminishing their utility. The presentation of non-GAAP financial measures is not intended to be a substitute for, and should not be considered in isolation from, the financial measures reported in accordance with GAAP. The tables at the end of this presentation present a reconciliation of the non-GAAP financial measures of Adjusted EBITDA and Adjusted EBITDA per fleet to the most directly comparable GAAP financial measure for the periods indicated.
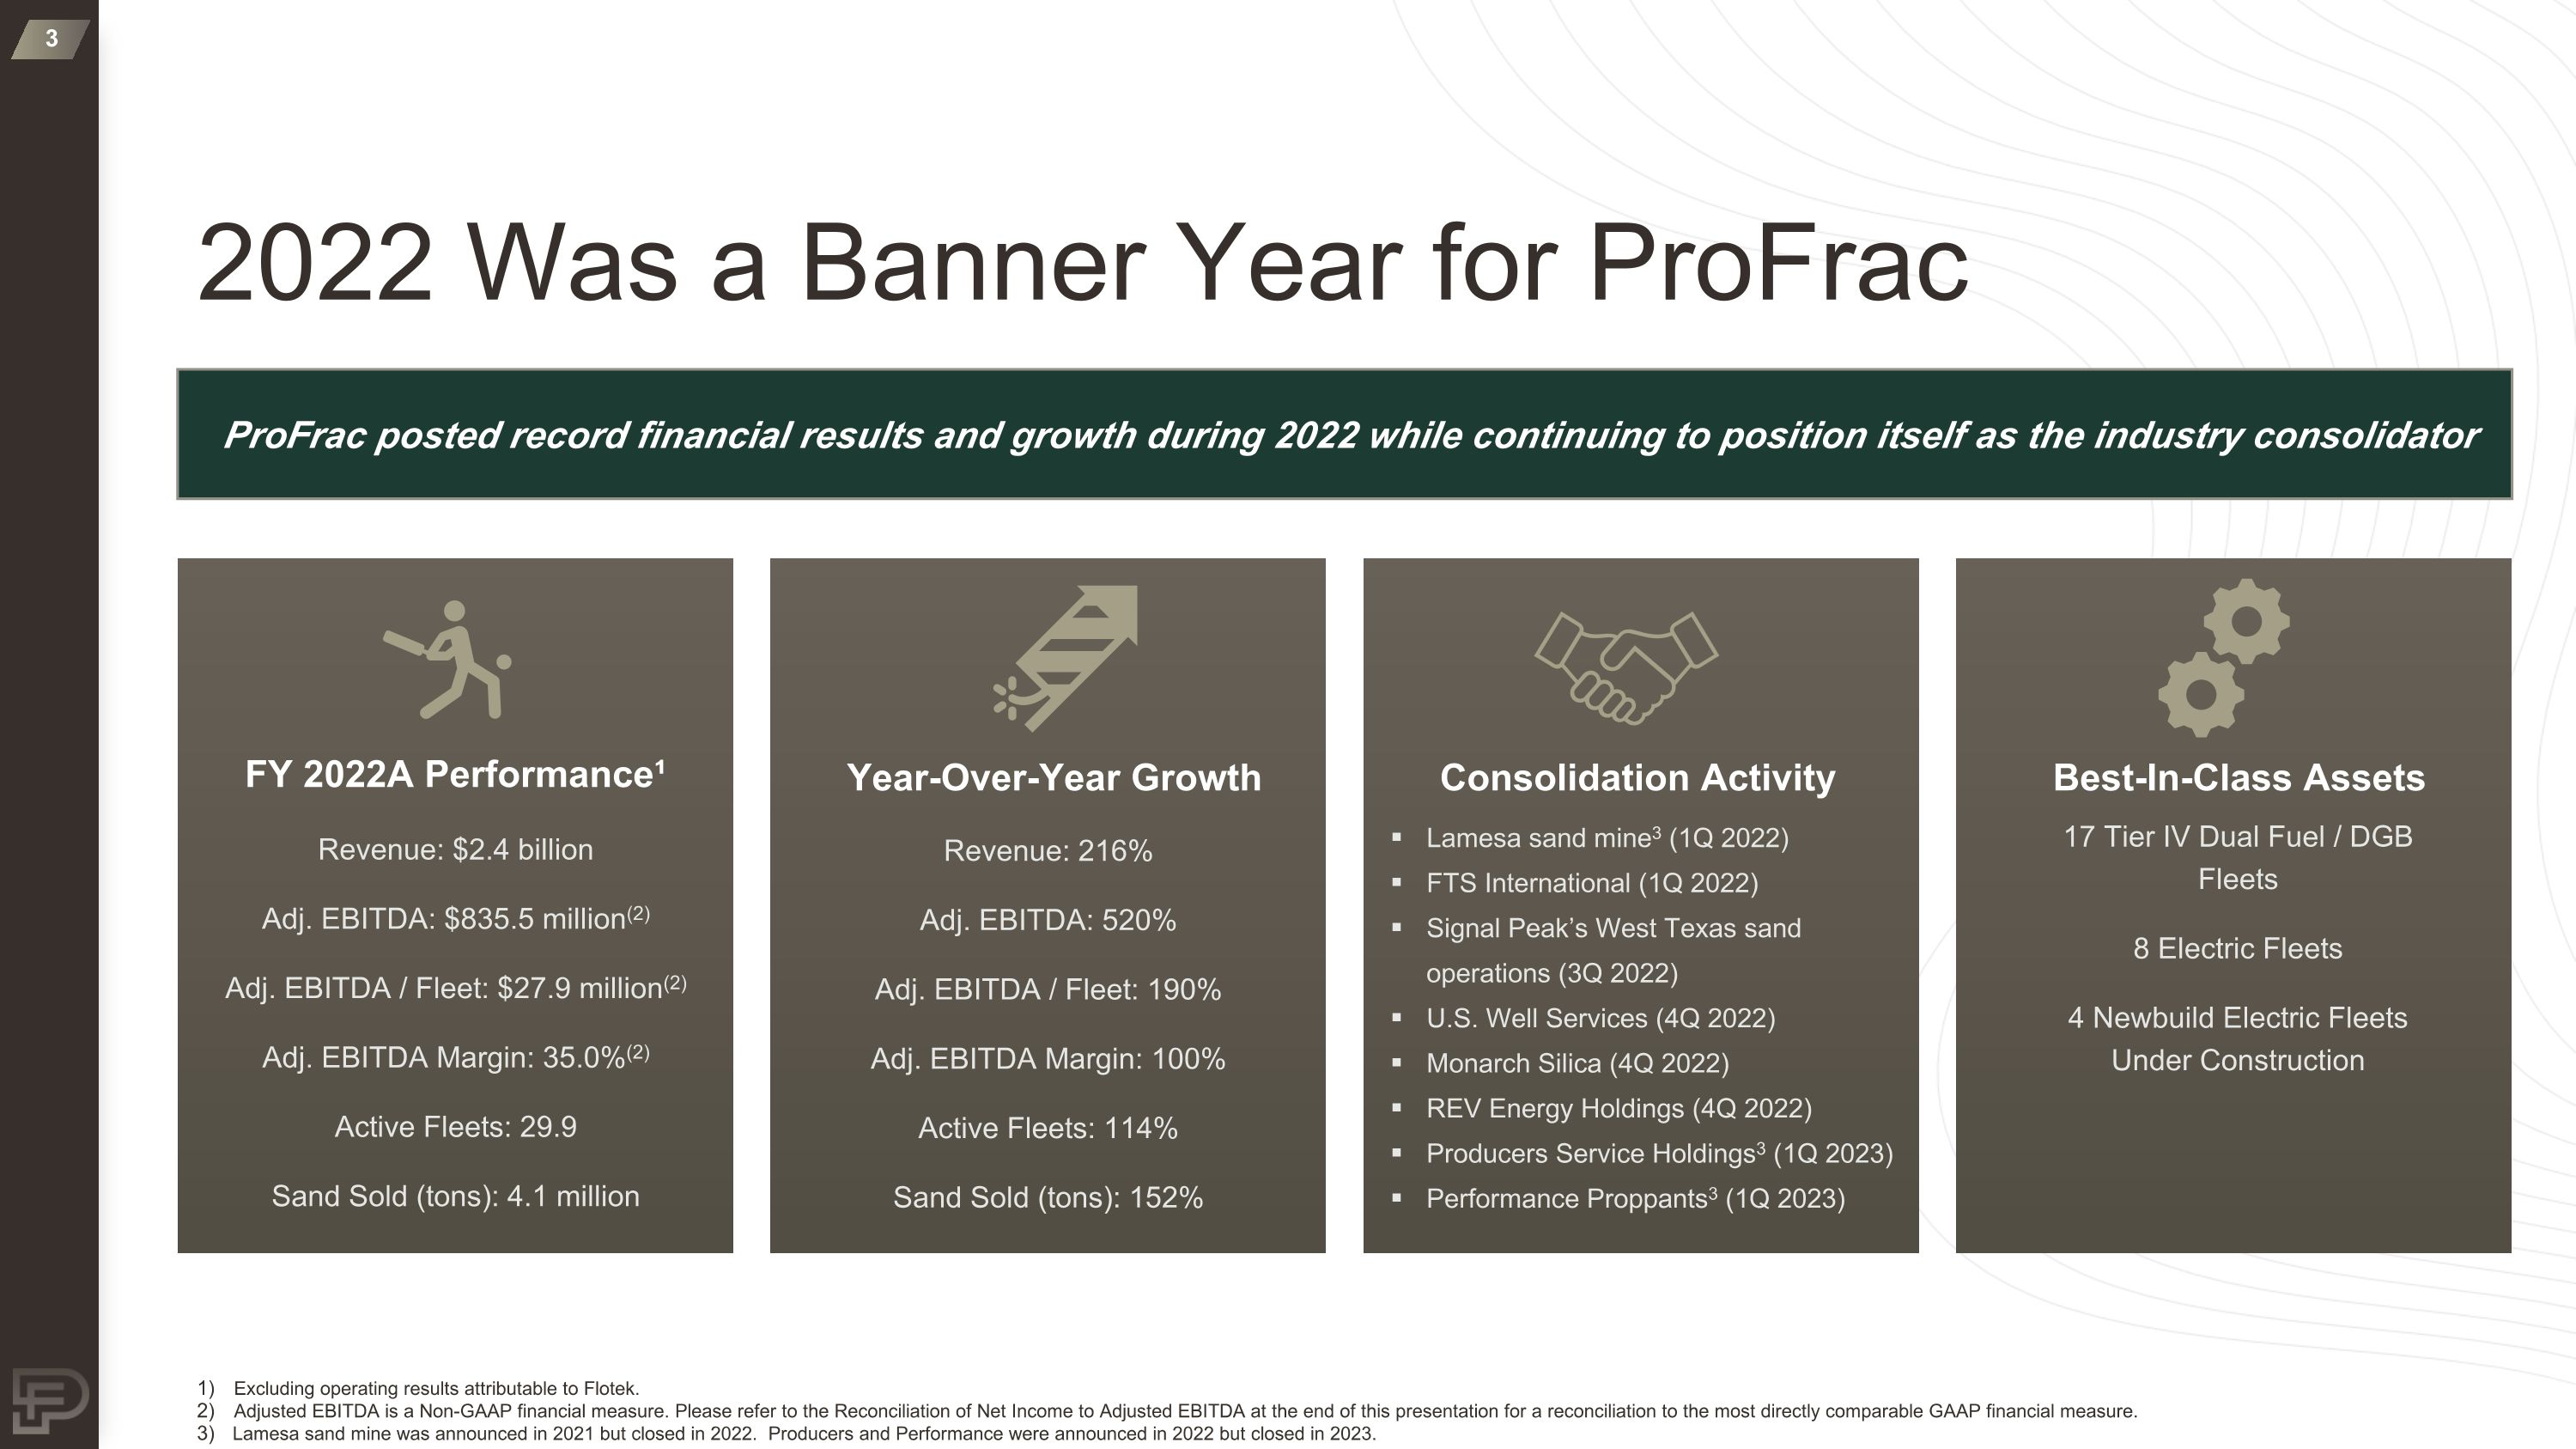
2022 Was a Banner Year for ProFrac Revenue: $2.4 billion Adj. EBITDA: $835.5 million(2) Adj. EBITDA / Fleet: $27.9 million(2) Adj. EBITDA Margin: 35.0%(2) Active Fleets: 29.9 Sand Sold (tons): 4.1 million FY 2022A Performance¹ Revenue: 216% Adj. EBITDA: 520% Adj. EBITDA / Fleet: 190% Adj. EBITDA Margin: 100% Active Fleets: 114% Sand Sold (tons): 152% Year-Over-Year Growth Lamesa sand mine3 (1Q 2022) FTS International (1Q 2022) Signal Peak’s West Texas sand operations (3Q 2022) U.S. Well Services (4Q 2022) Monarch Silica (4Q 2022) REV Energy Holdings (4Q 2022) Producers Service Holdings3 (1Q 2023) Performance Proppants3 (1Q 2023) Consolidation Activity 17 Tier IV Dual Fuel / DGB Fleets 8 Electric Fleets 4 Newbuild Electric Fleets Under Construction Best-In-Class Assets Excluding operating results attributable to Flotek. Adjusted EBITDA is a Non-GAAP financial measure. Please refer to the Reconciliation of Net Income to Adjusted EBITDA at the end of this presentation for a reconciliation to the most directly comparable GAAP financial measure. Lamesa sand mine was announced in 2021 but closed in 2022. Producers and Performance were announced in 2022 but closed in 2023. ProFrac posted record financial results and growth during 2022 while continuing to position itself as the industry consolidator
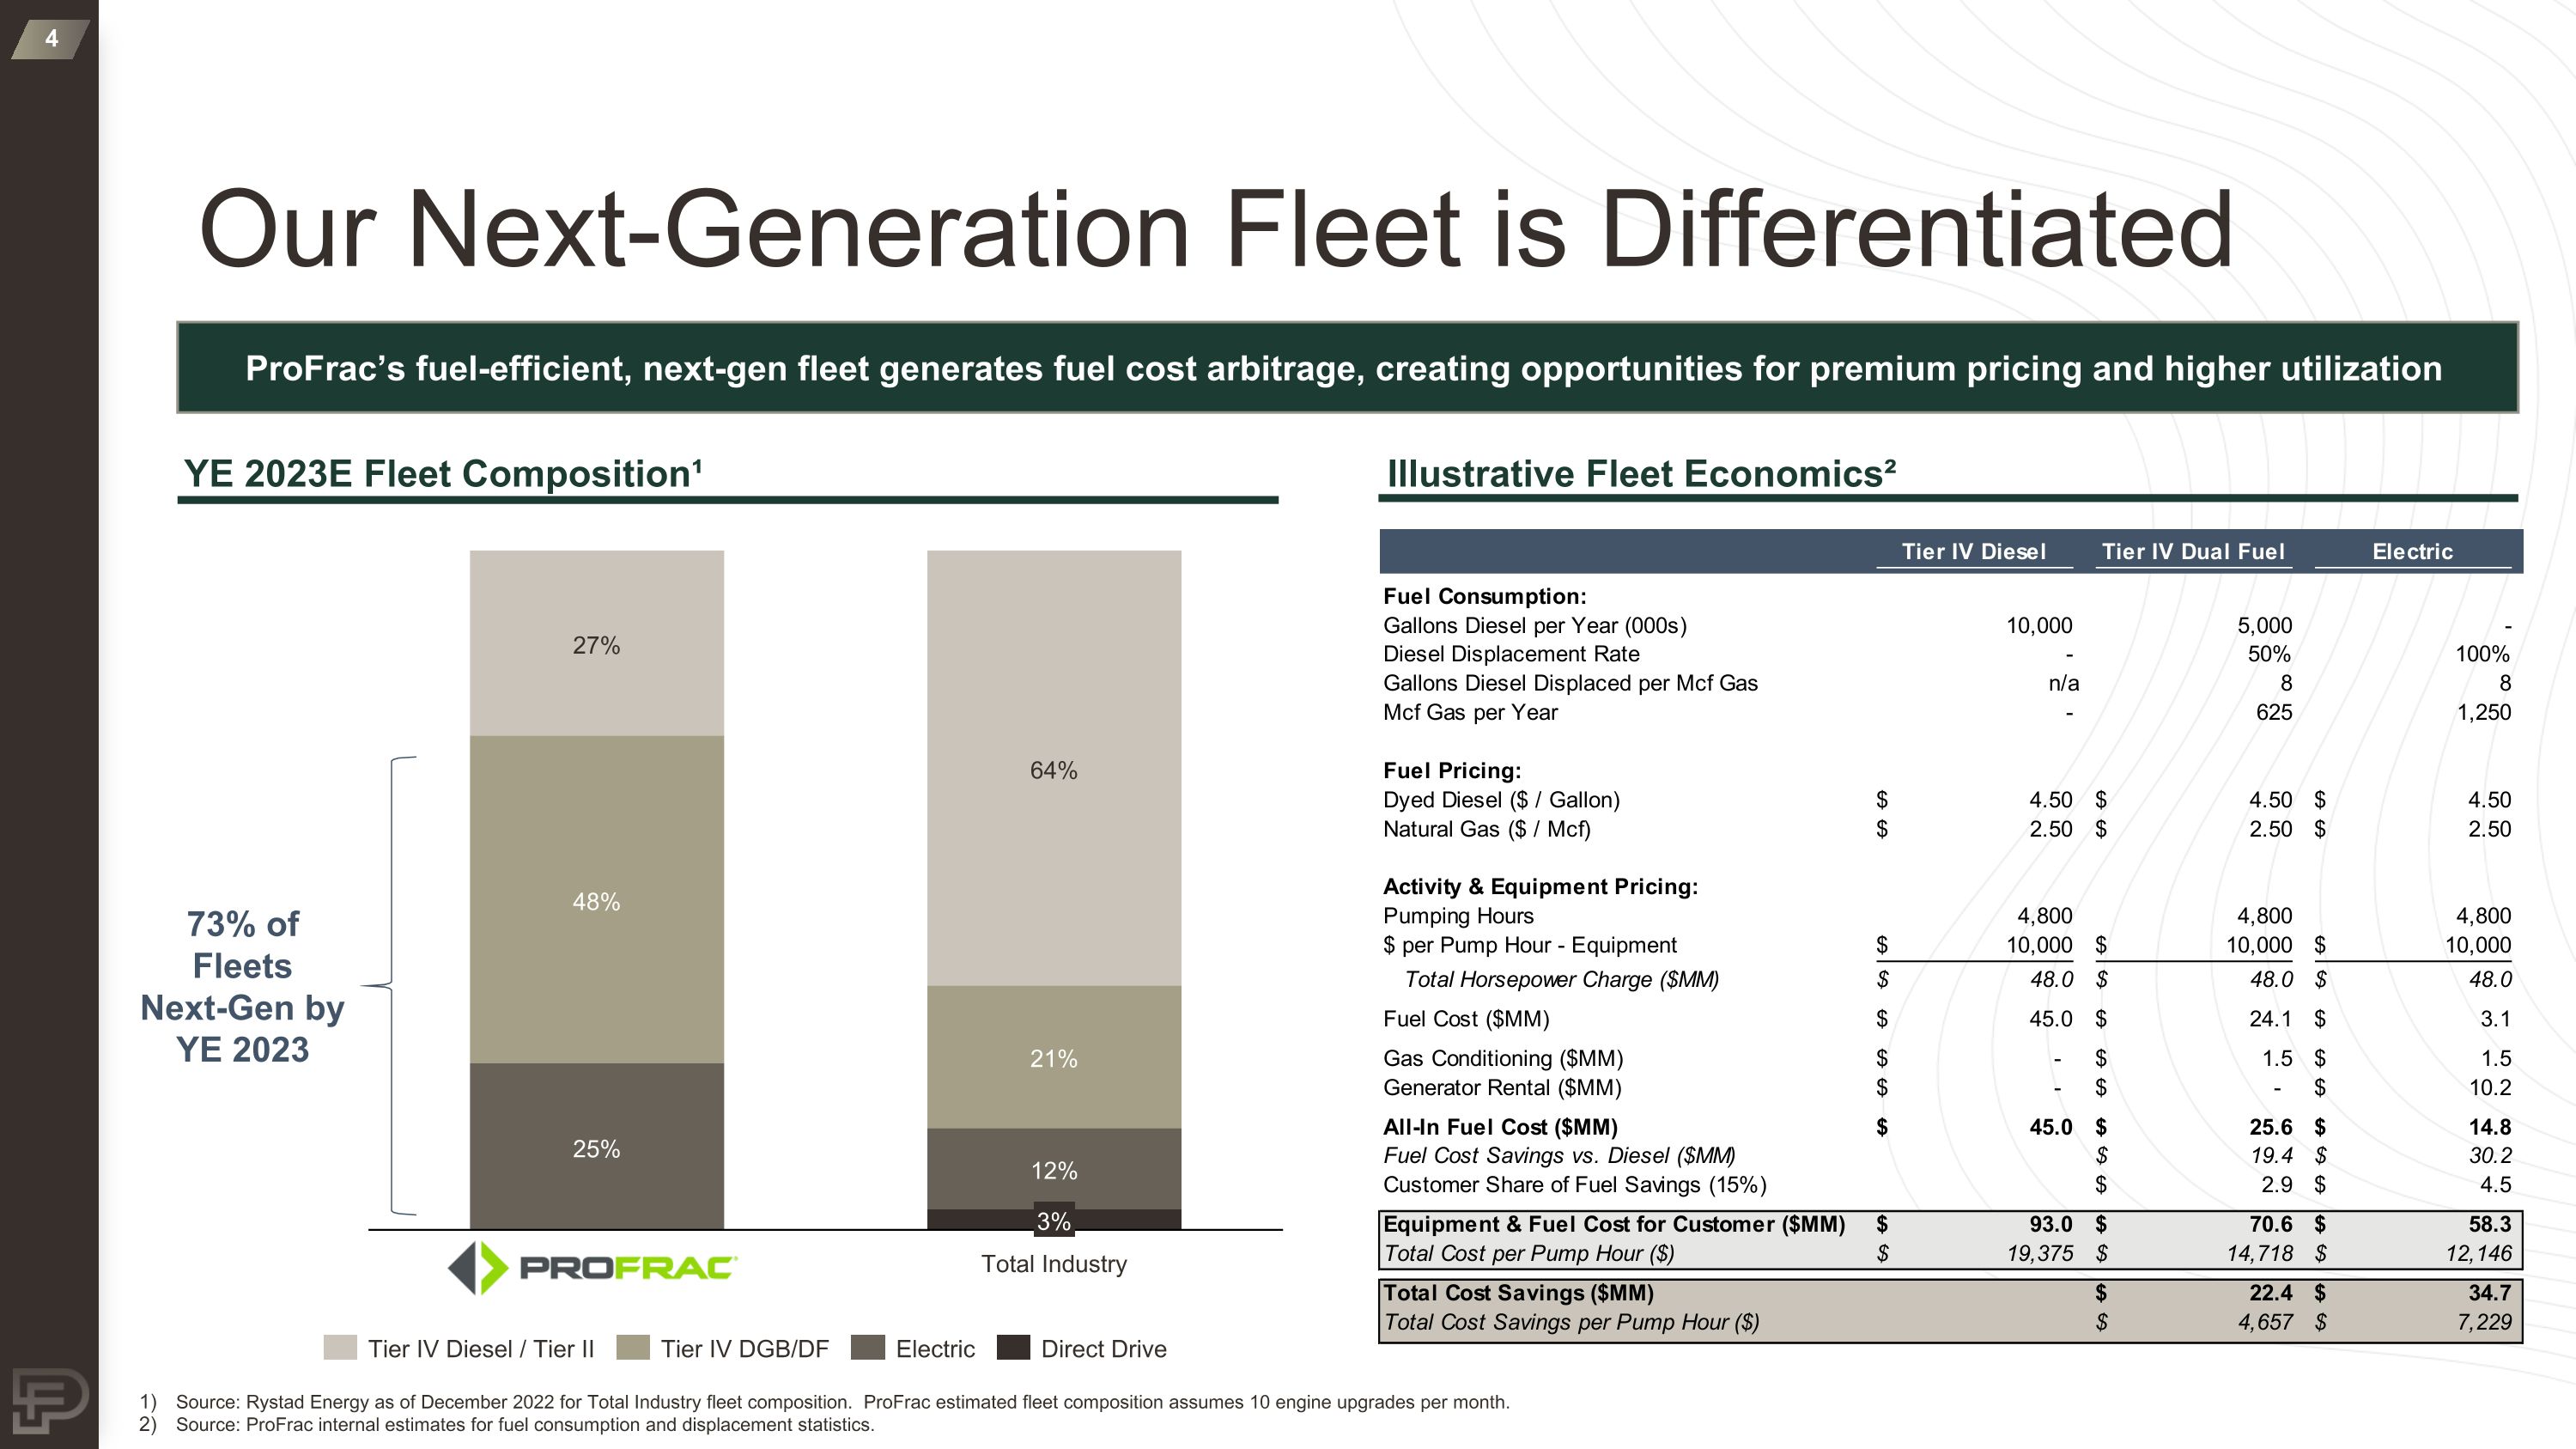
Our Next-Generation Fleet is Differentiated Total Industry 3% Direct Drive Electric Tier IV Diesel / Tier II Tier IV DGB/DF YE 2023E Fleet Composition¹ Illustrative Fleet Economics² Source: Rystad Energy as of December 2022 for Total Industry fleet composition. ProFrac estimated fleet composition assumes 10 engine upgrades per month. Source: ProFrac internal estimates for fuel consumption and displacement statistics. ProFrac’s fuel-efficient, next-gen fleet generates fuel cost arbitrage, creating opportunities for premium pricing and higher utilization 73% of Fleets Next-Gen by YE 2023
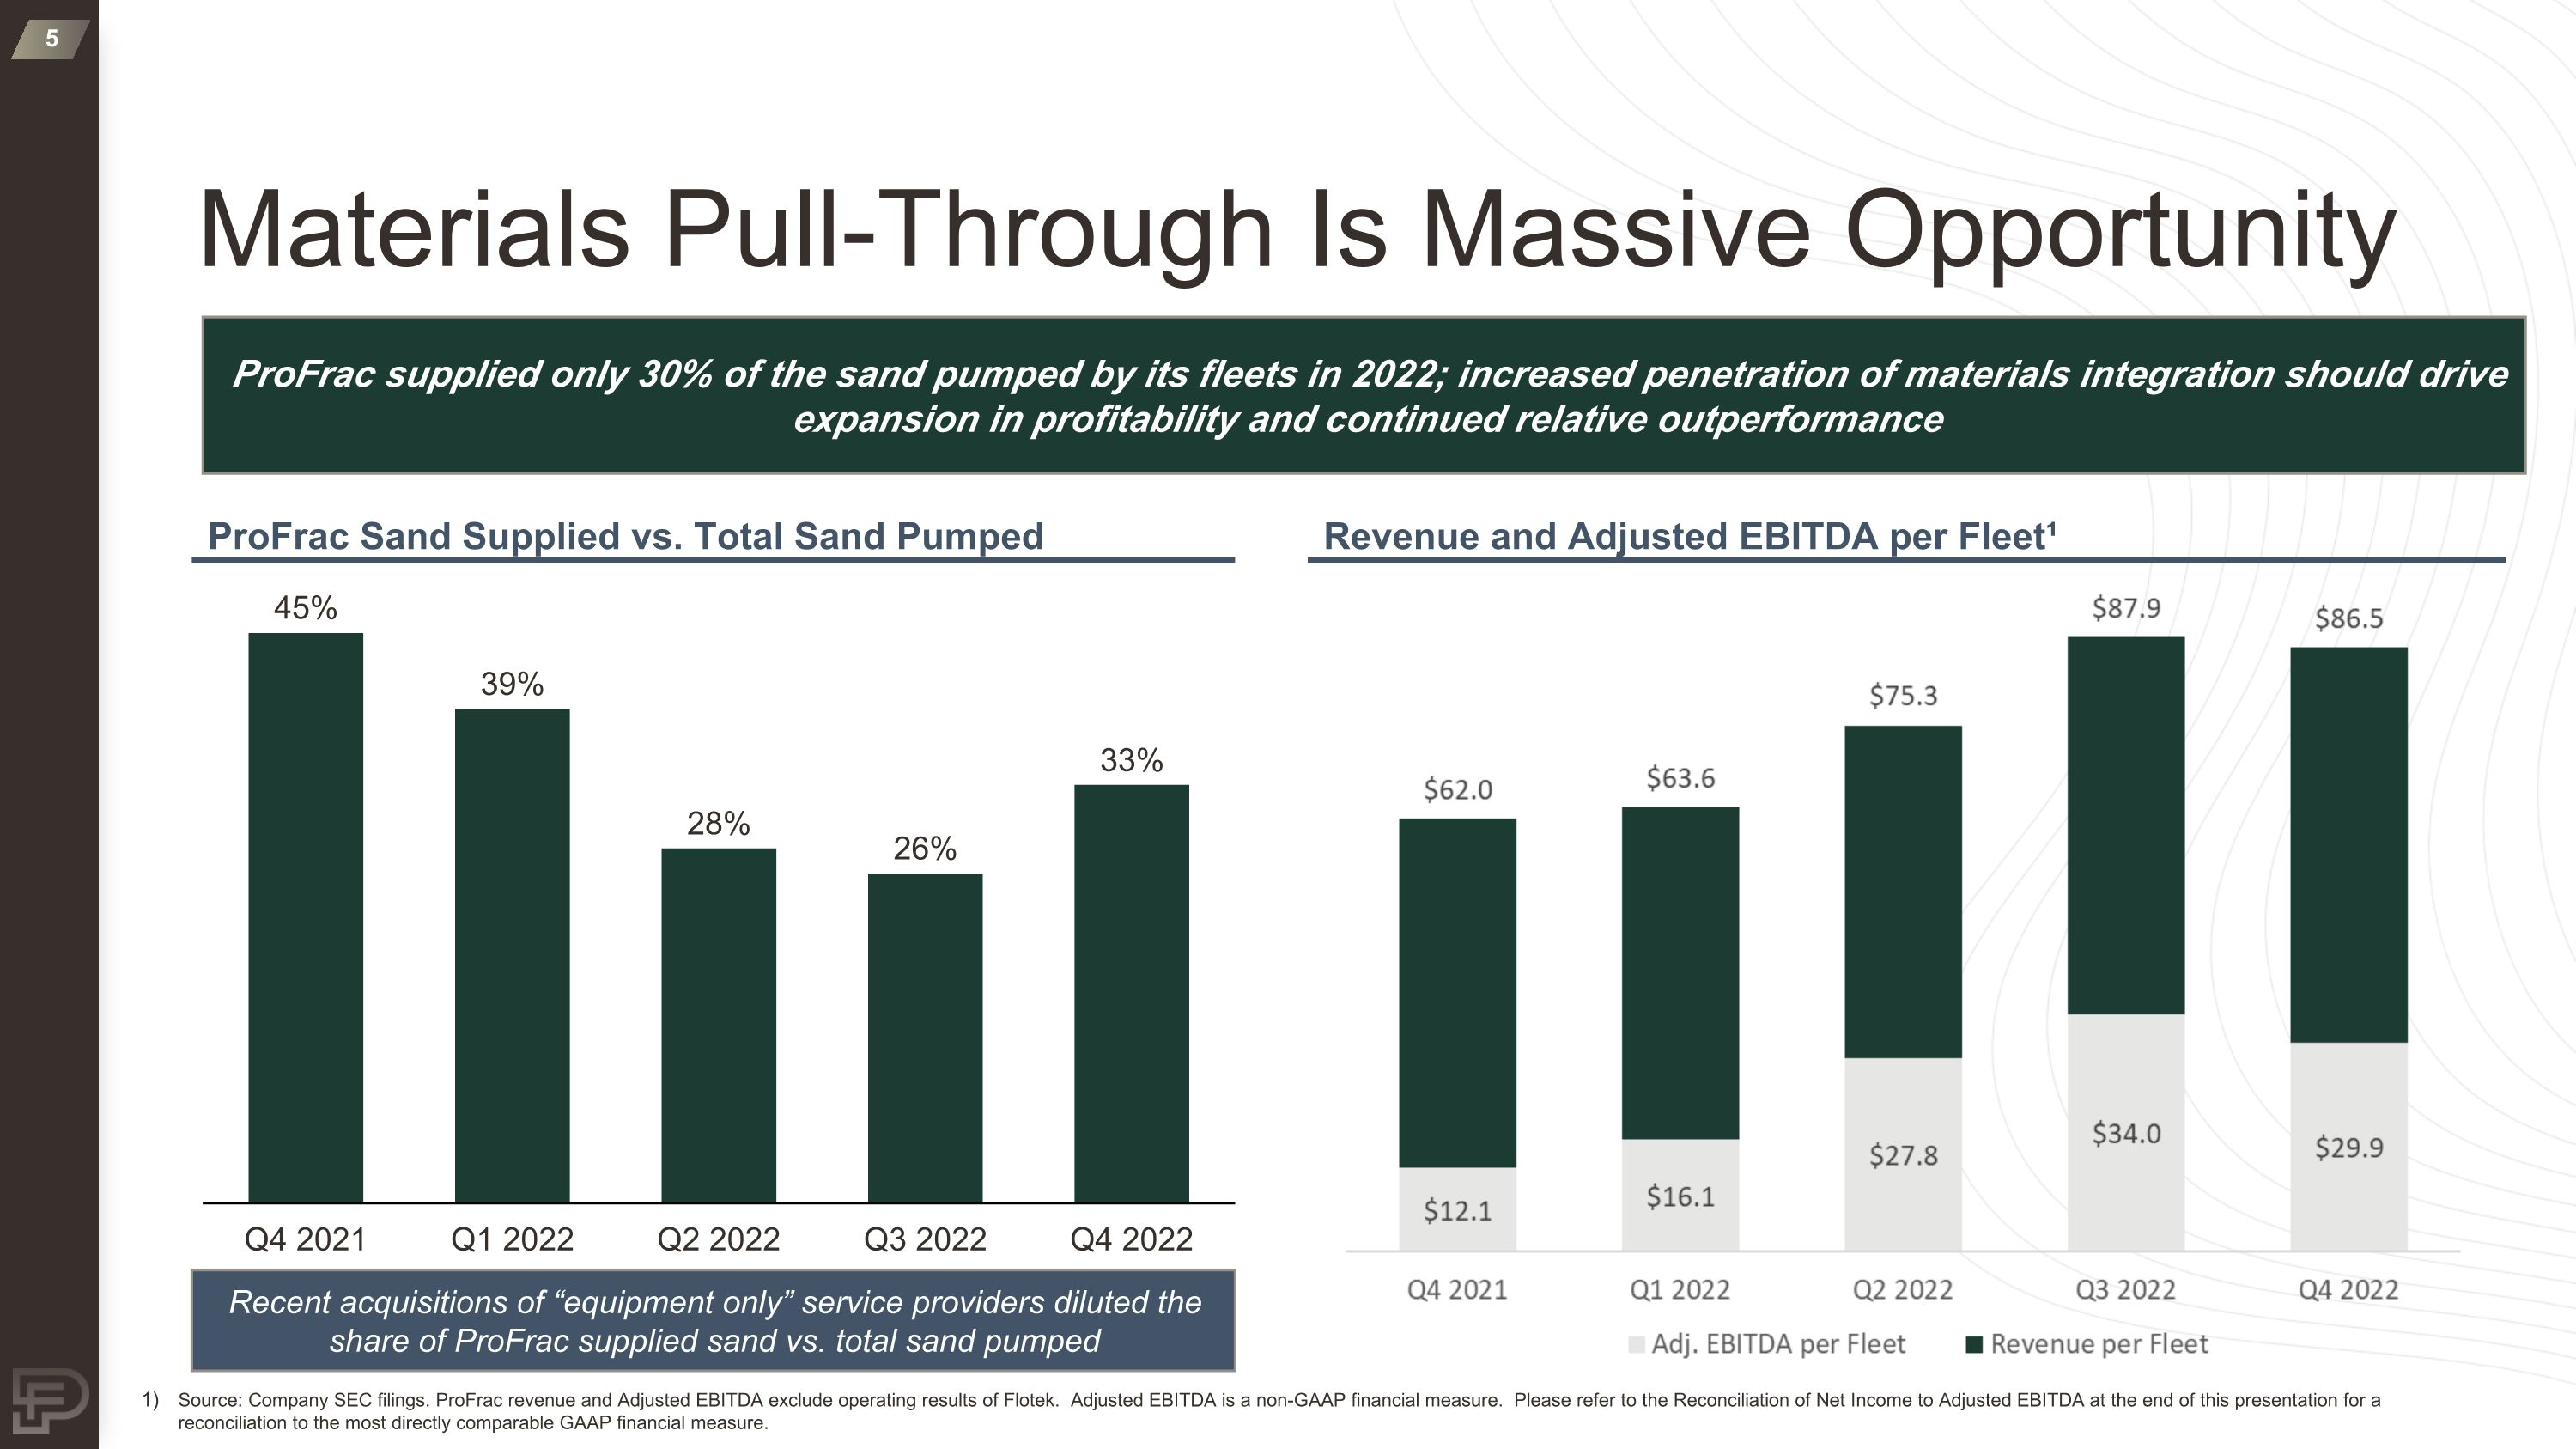
Materials Pull-Through Is Massive Opportunity ProFrac supplied only 30% of the sand pumped by its fleets in 2022; increased penetration of materials integration should drive expansion in profitability and continued relative outperformance ProFrac Sand Supplied vs. Total Sand Pumped Revenue and Adjusted EBITDA per Fleet¹ Q4 2021 Q1 2022 Q2 2022 Q3 2022 Q4 2022 Recent acquisitions of “equipment only” service providers diluted the share of ProFrac supplied sand vs. total sand pumped Source: Company SEC filings. ProFrac revenue and Adjusted EBITDA exclude operating results of Flotek. Adjusted EBITDA is a non-GAAP financial measure. Please refer to the Reconciliation of Net Income to Adjusted EBITDA at the end of this presentation for a reconciliation to the most directly comparable GAAP financial measure.
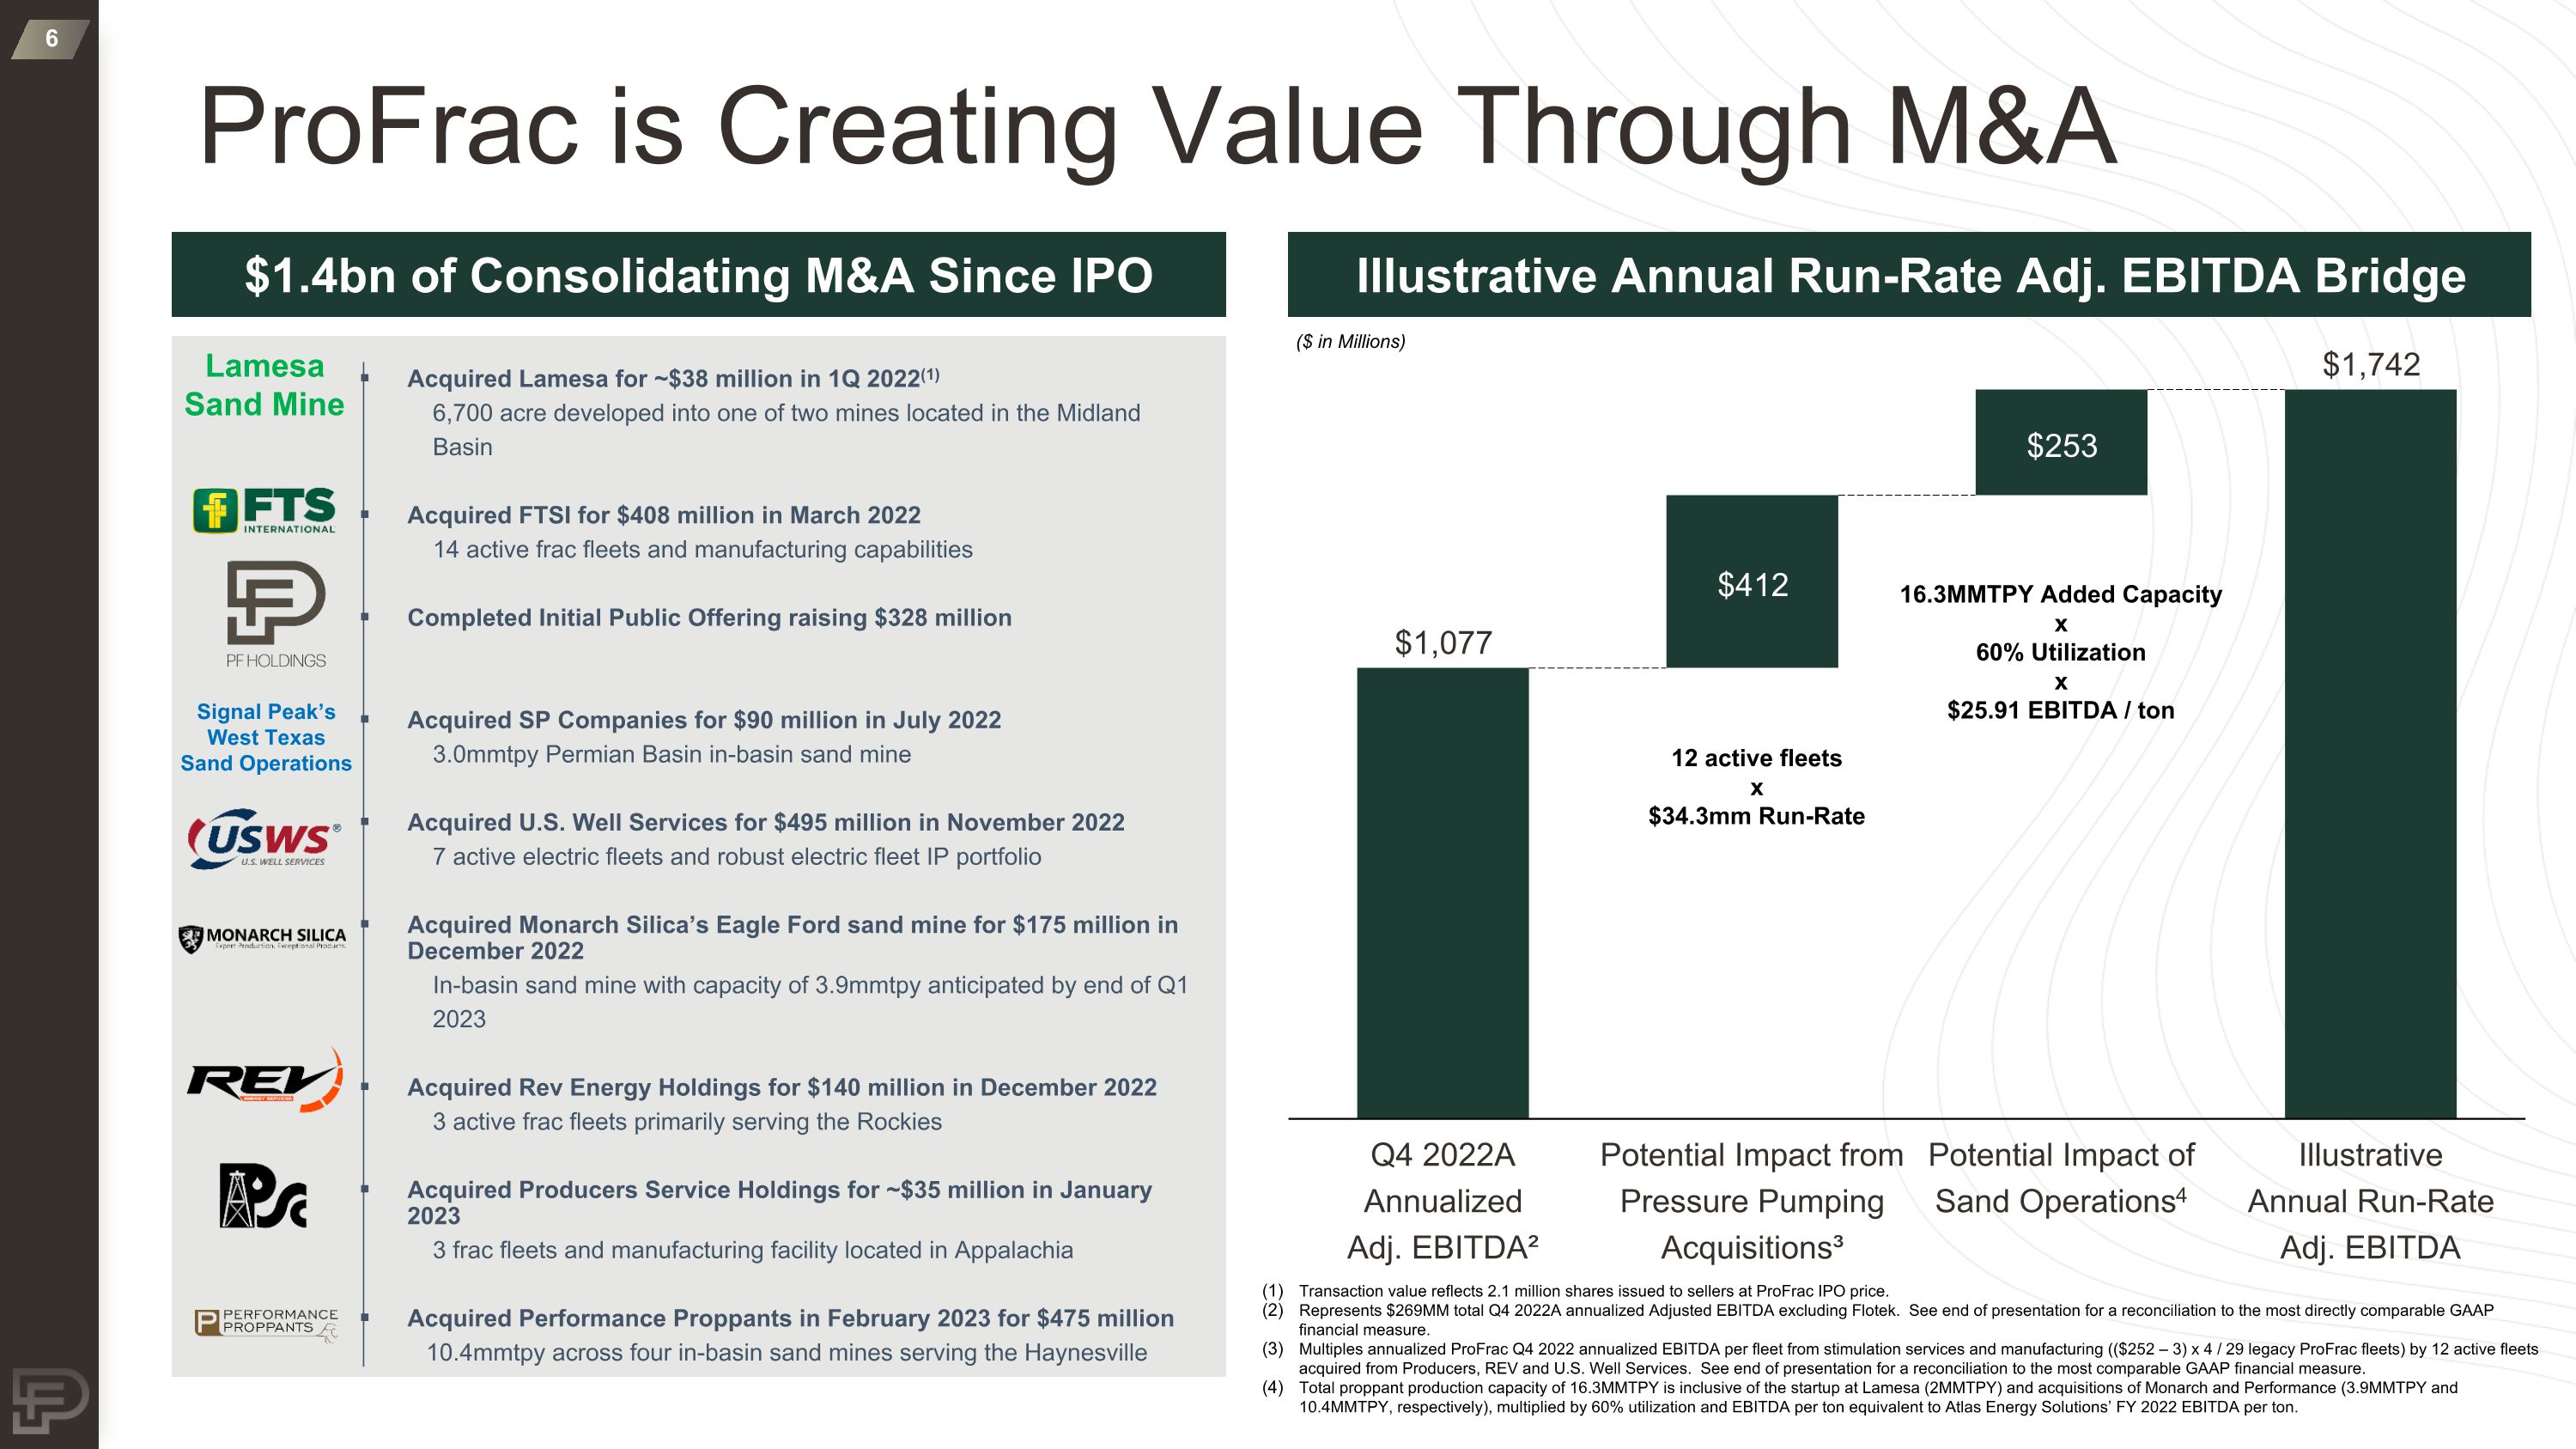
ProFrac is Creating Value Through M&A Acquired Lamesa for ~$38 million in 1Q 2022(1) 6,700 acre developed into one of two mines located in the Midland Basin Acquired FTSI for $408 million in March 2022 14 active frac fleets and manufacturing capabilities Completed Initial Public Offering raising $328 million Acquired SP Companies for $90 million in July 2022 3.0mmtpy Permian Basin in-basin sand mine Acquired U.S. Well Services for $495 million in November 2022 7 active electric fleets and robust electric fleet IP portfolio Acquired Monarch Silica’s Eagle Ford sand mine for $175 million in December 2022 In-basin sand mine with capacity of 3.9mmtpy anticipated by end of Q1 2023 Acquired Rev Energy Holdings for $140 million in December 2022 3 active frac fleets primarily serving the Rockies Acquired Producers Service Holdings for ~$35 million in January 2023 3 frac fleets and manufacturing facility located in Appalachia Acquired Performance Proppants in February 2023 for $475 million 10.4mmtpy across four in-basin sand mines serving the Haynesville Lamesa Sand Mine Signal Peak’s West Texas Sand Operations Transaction value reflects 2.1 million shares issued to sellers at ProFrac IPO price. Represents $269MM total Q4 2022A annualized Adjusted EBITDA excluding Flotek. See end of presentation for a reconciliation to the most directly comparable GAAP financial measure. Multiples annualized ProFrac Q4 2022 annualized EBITDA per fleet from stimulation services and manufacturing (($252 – 3) x 4 / 29 legacy ProFrac fleets) by 12 active fleets acquired from Producers, REV and U.S. Well Services. See end of presentation for a reconciliation to the most comparable GAAP financial measure. Total proppant production capacity of 16.3MMTPY is inclusive of the startup at Lamesa (2MMTPY) and acquisitions of Monarch and Performance (3.9MMTPY and 10.4MMTPY, respectively), multiplied by 60% utilization and EBITDA per ton equivalent to Atlas Energy Solutions’ FY 2022 EBITDA per ton. Illustrative Annual Run-Rate Adj. EBITDA Bridge $1.4bn of Consolidating M&A Since IPO ($ in Millions) Potential Impact from Pressure Pumping Acquisitions³ Potential Impact of Sand Operations4 Q4 2022A Annualized Adj. EBITDA² Illustrative Annual Run-Rate Adj. EBITDA 12 active fleets x $34.3mm Run-Rate 16.3MMTPY Added Capacity x 60% Utilization x $25.91 EBITDA / ton
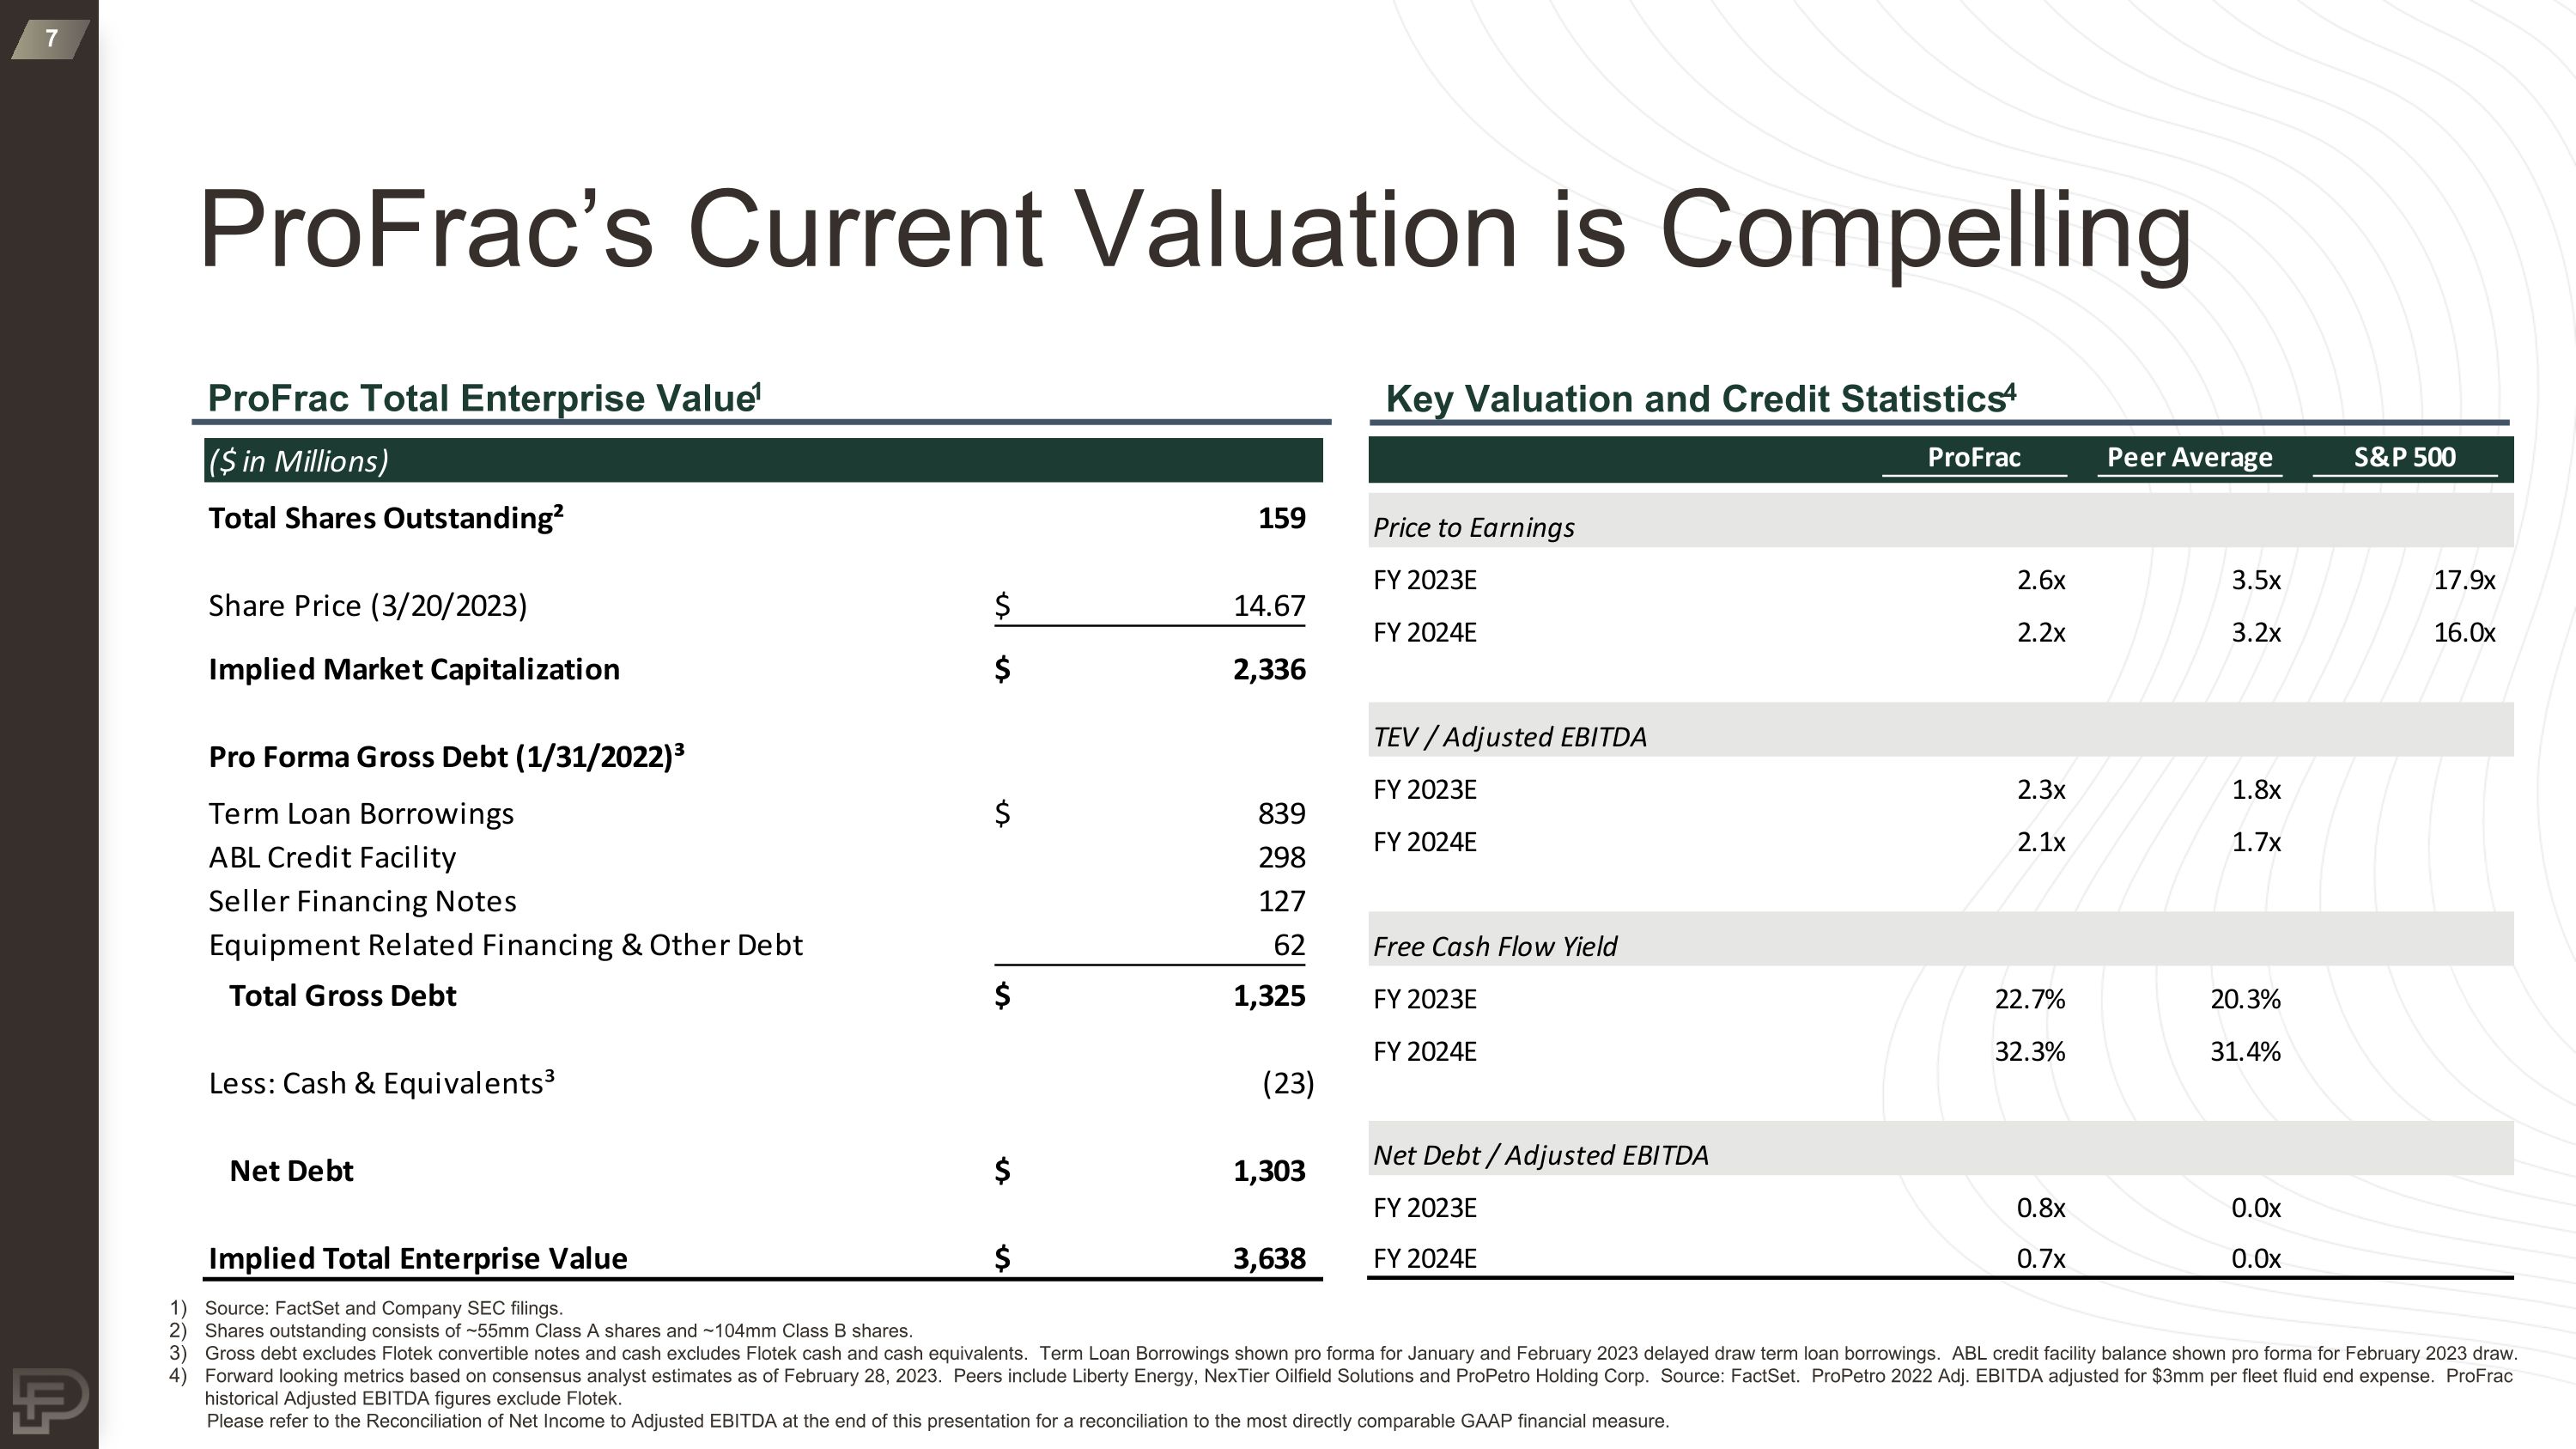
ProFrac’s Current Valuation is Compelling ProFrac Total Enterprise Value1 Key Valuation and Credit Statistics4 Source: FactSet and Company SEC filings. Shares outstanding consists of ~55mm Class A shares and ~104mm Class B shares. Gross debt excludes Flotek convertible notes and cash excludes Flotek cash and cash equivalents. Term Loan Borrowings shown pro forma for January and February 2023 delayed draw term loan borrowings. ABL credit facility balance shown pro forma for February 2023 draw. Forward looking metrics based on consensus analyst estimates as of February 28, 2023. Peers include Liberty Energy, NexTier Oilfield Solutions and ProPetro Holding Corp. Source: FactSet. ProPetro 2022 Adj. EBITDA adjusted for $3mm per fleet fluid end expense. ProFrac historical Adjusted EBITDA figures exclude Flotek. Please refer to the Reconciliation of Net Income to Adjusted EBITDA at the end of this presentation for a reconciliation to the most directly comparable GAAP financial measure.
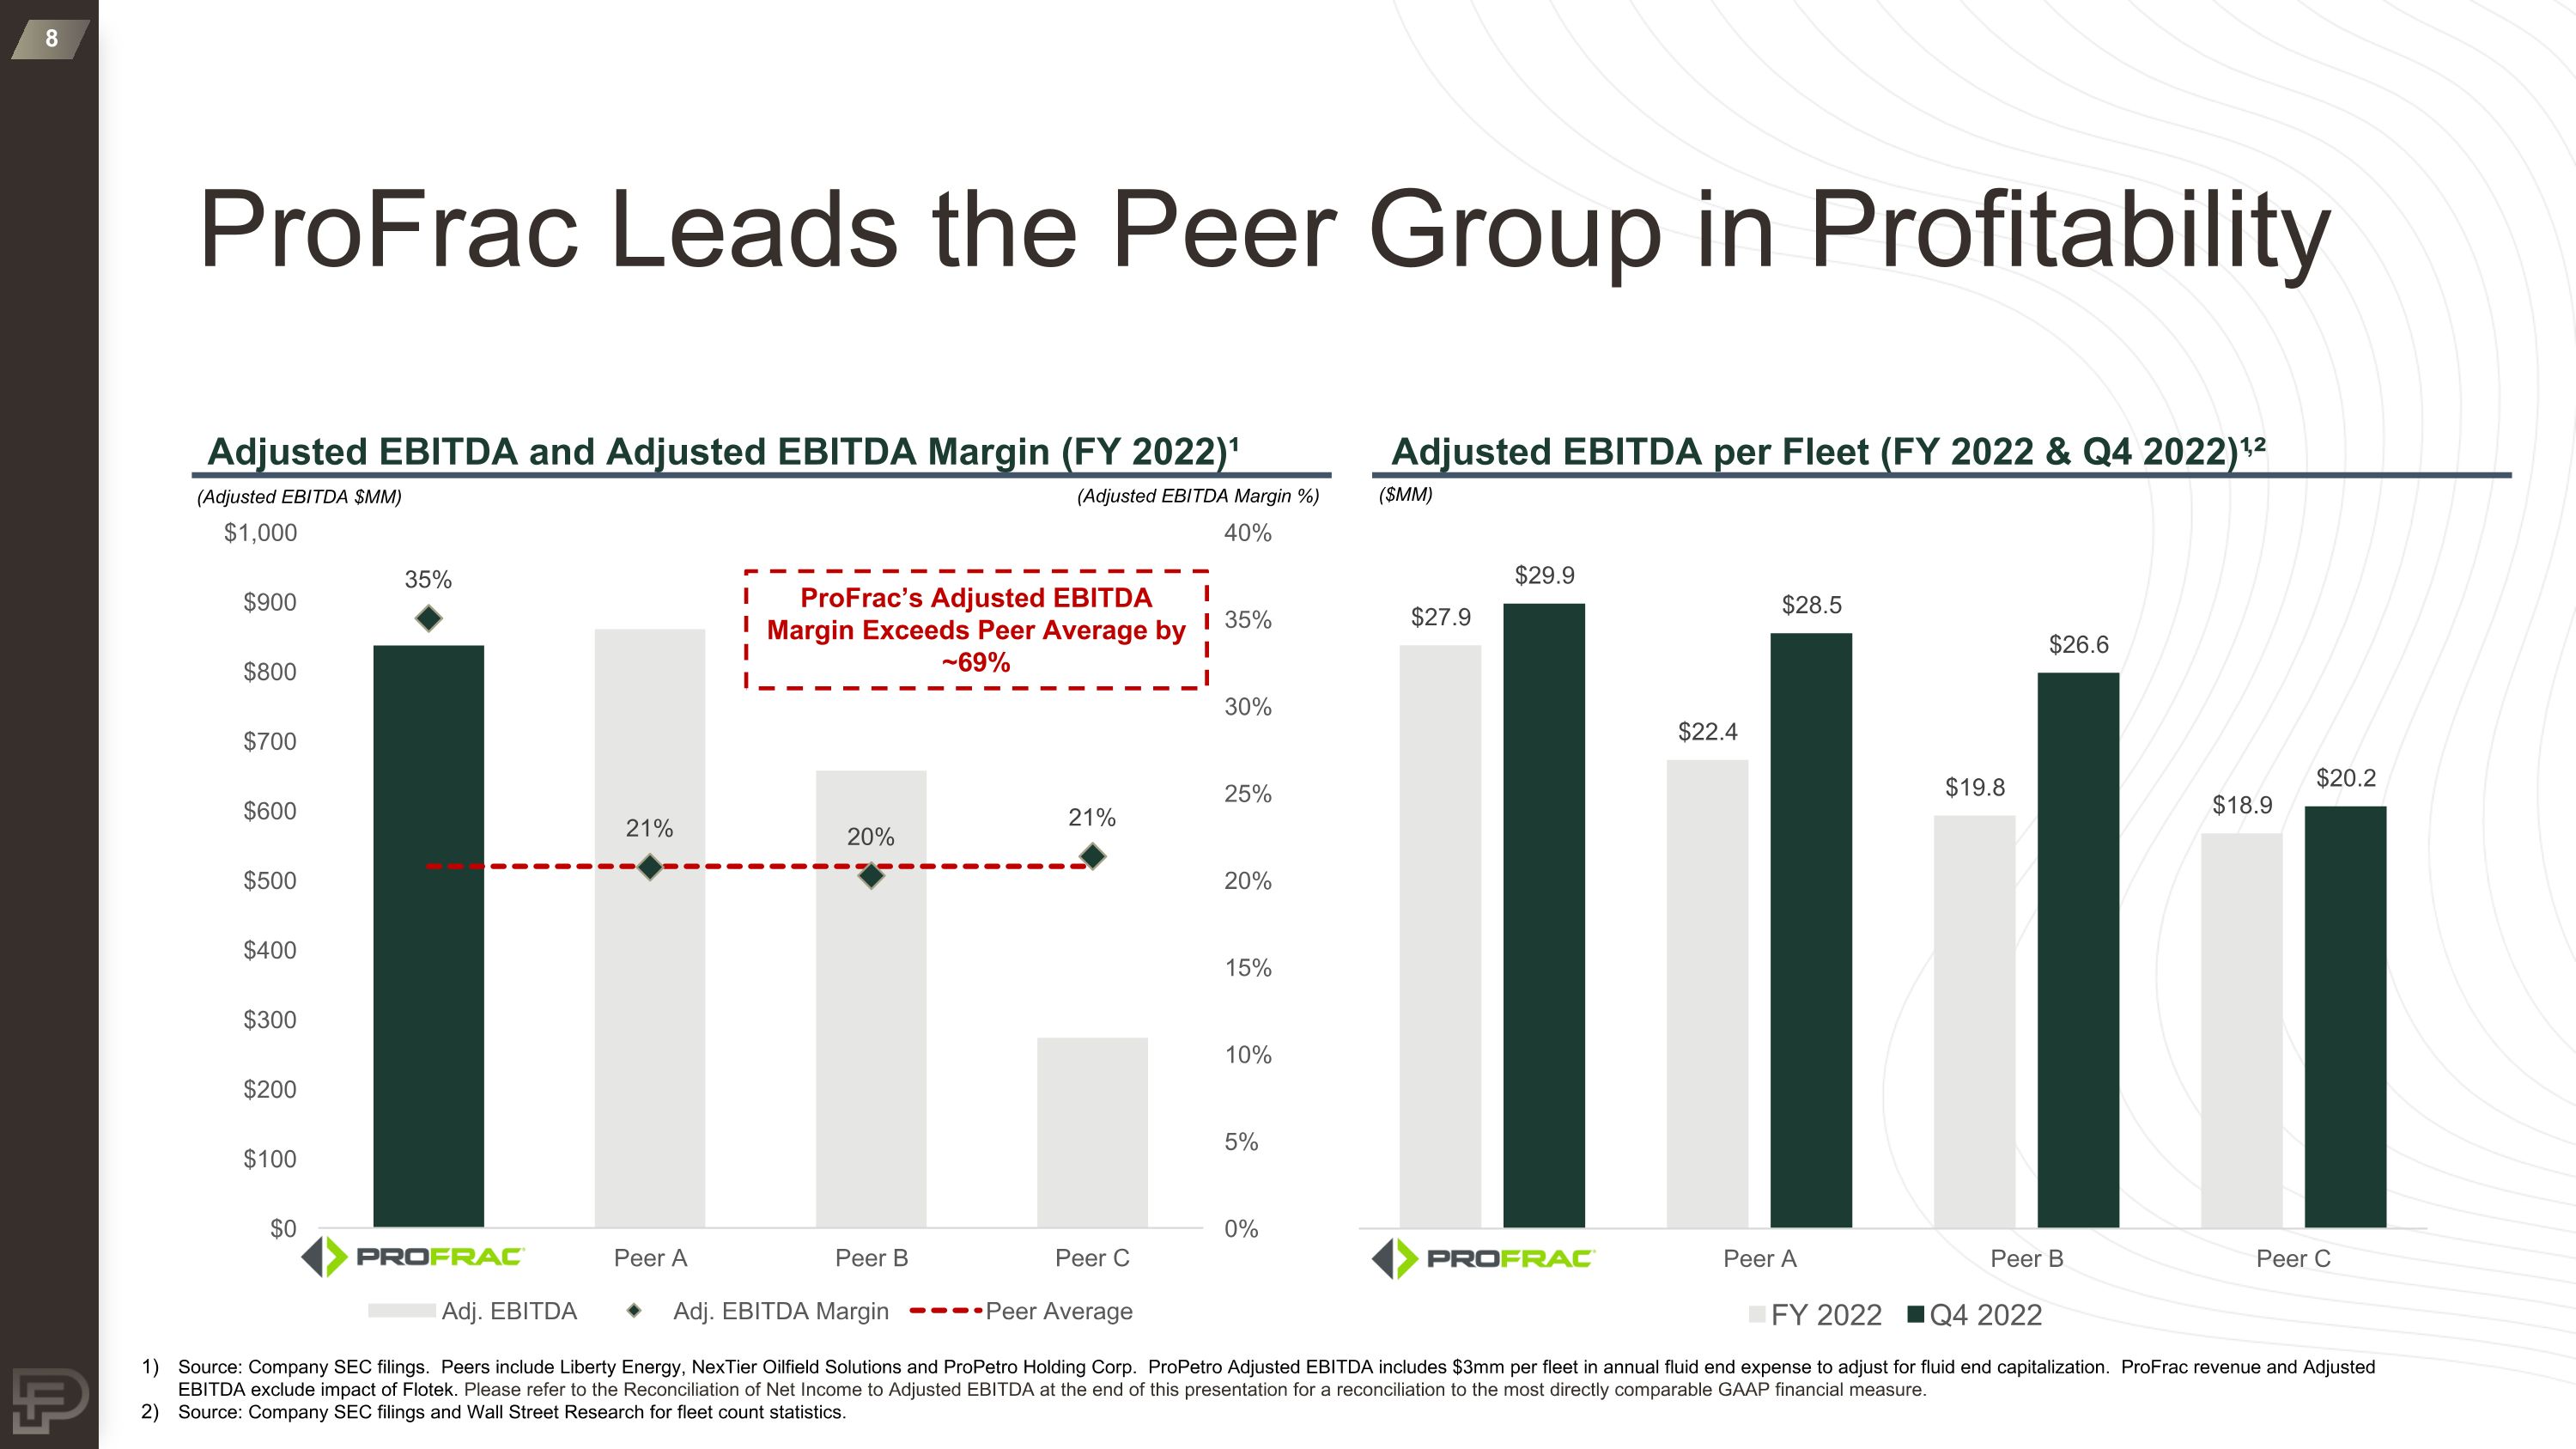
Adjusted EBITDA per Fleet (FY 2022 & Q4 2022)¹,² Adjusted EBITDA and Adjusted EBITDA Margin (FY 2022)¹ ProFrac Leads the Peer Group in Profitability (Adjusted EBITDA $MM) (Adjusted EBITDA Margin %) ($MM) Source: Company SEC filings. Peers include Liberty Energy, NexTier Oilfield Solutions and ProPetro Holding Corp. ProPetro Adjusted EBITDA includes $3mm per fleet in annual fluid end expense to adjust for fluid end capitalization. ProFrac revenue and Adjusted EBITDA exclude impact of Flotek. Please refer to the Reconciliation of Net Income to Adjusted EBITDA at the end of this presentation for a reconciliation to the most directly comparable GAAP financial measure. Source: Company SEC filings and Wall Street Research for fleet count statistics. ProFrac’s Adjusted EBITDA Margin Exceeds Peer Average by ~69%
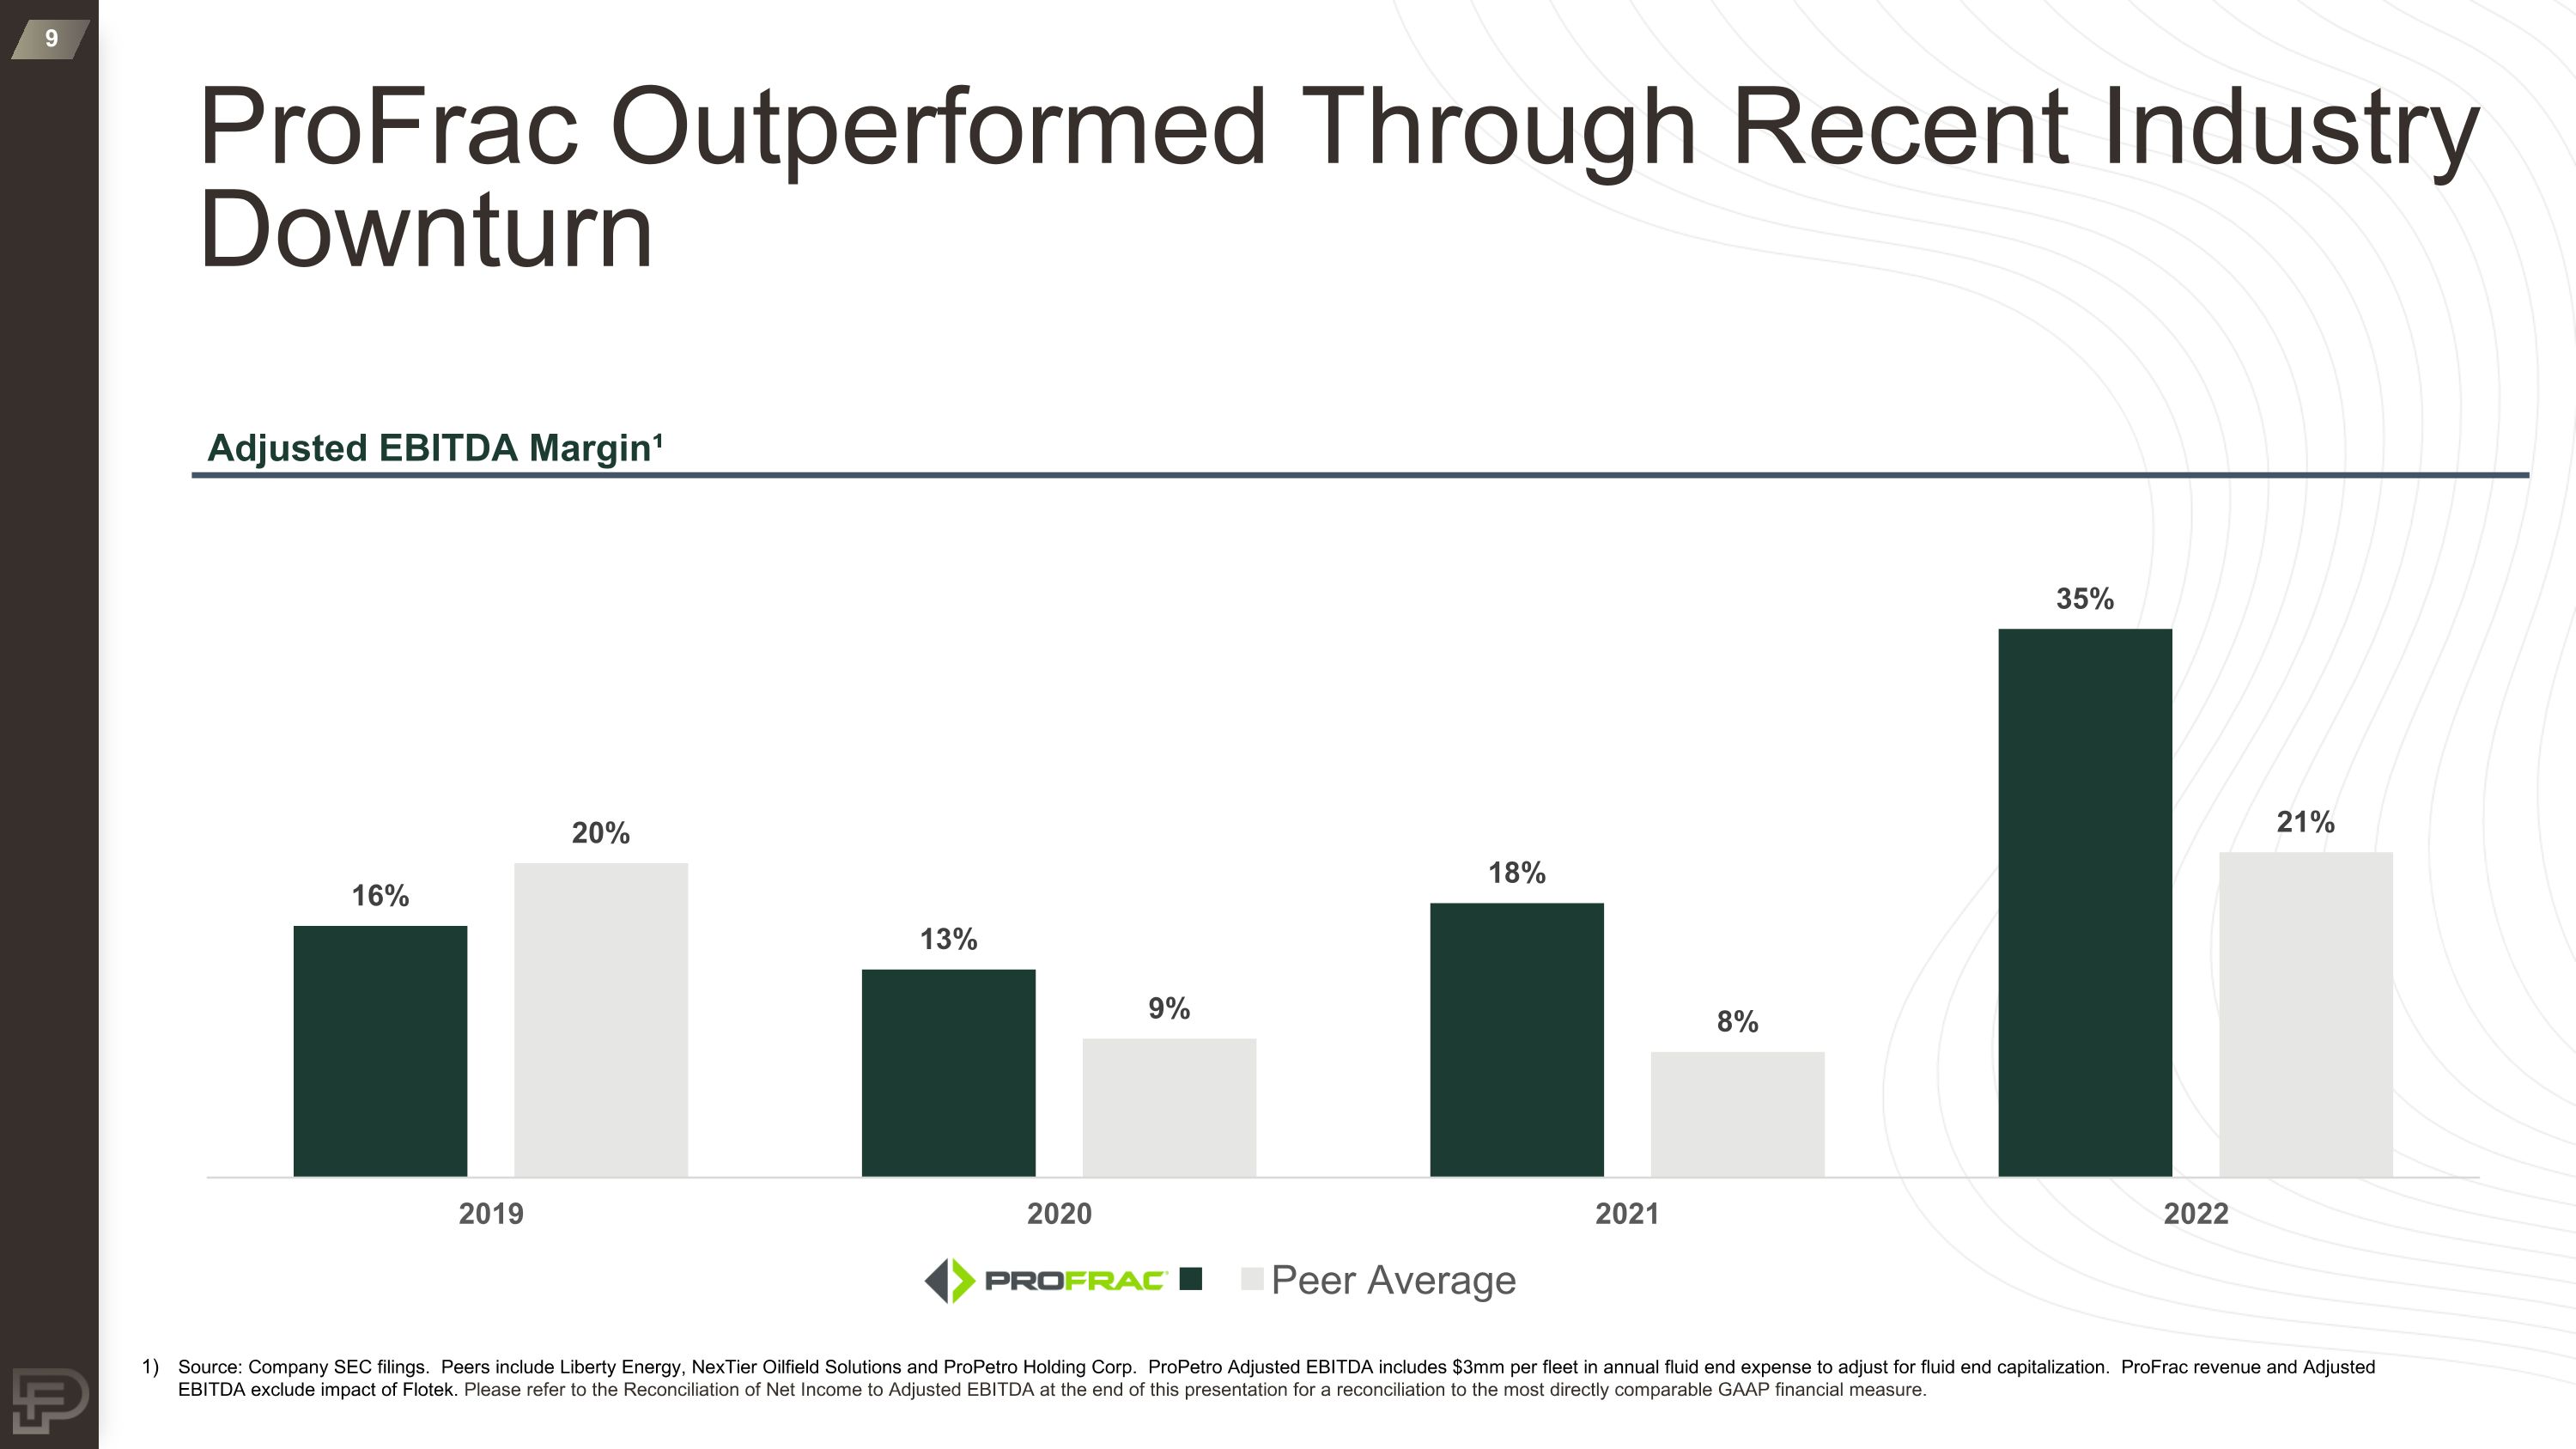
ProFrac Outperformed Through Recent Industry Downturn Adjusted EBITDA Margin¹ Source: Company SEC filings. Peers include Liberty Energy, NexTier Oilfield Solutions and ProPetro Holding Corp. ProPetro Adjusted EBITDA includes $3mm per fleet in annual fluid end expense to adjust for fluid end capitalization. ProFrac revenue and Adjusted EBITDA exclude impact of Flotek. Please refer to the Reconciliation of Net Income to Adjusted EBITDA at the end of this presentation for a reconciliation to the most directly comparable GAAP financial measure.
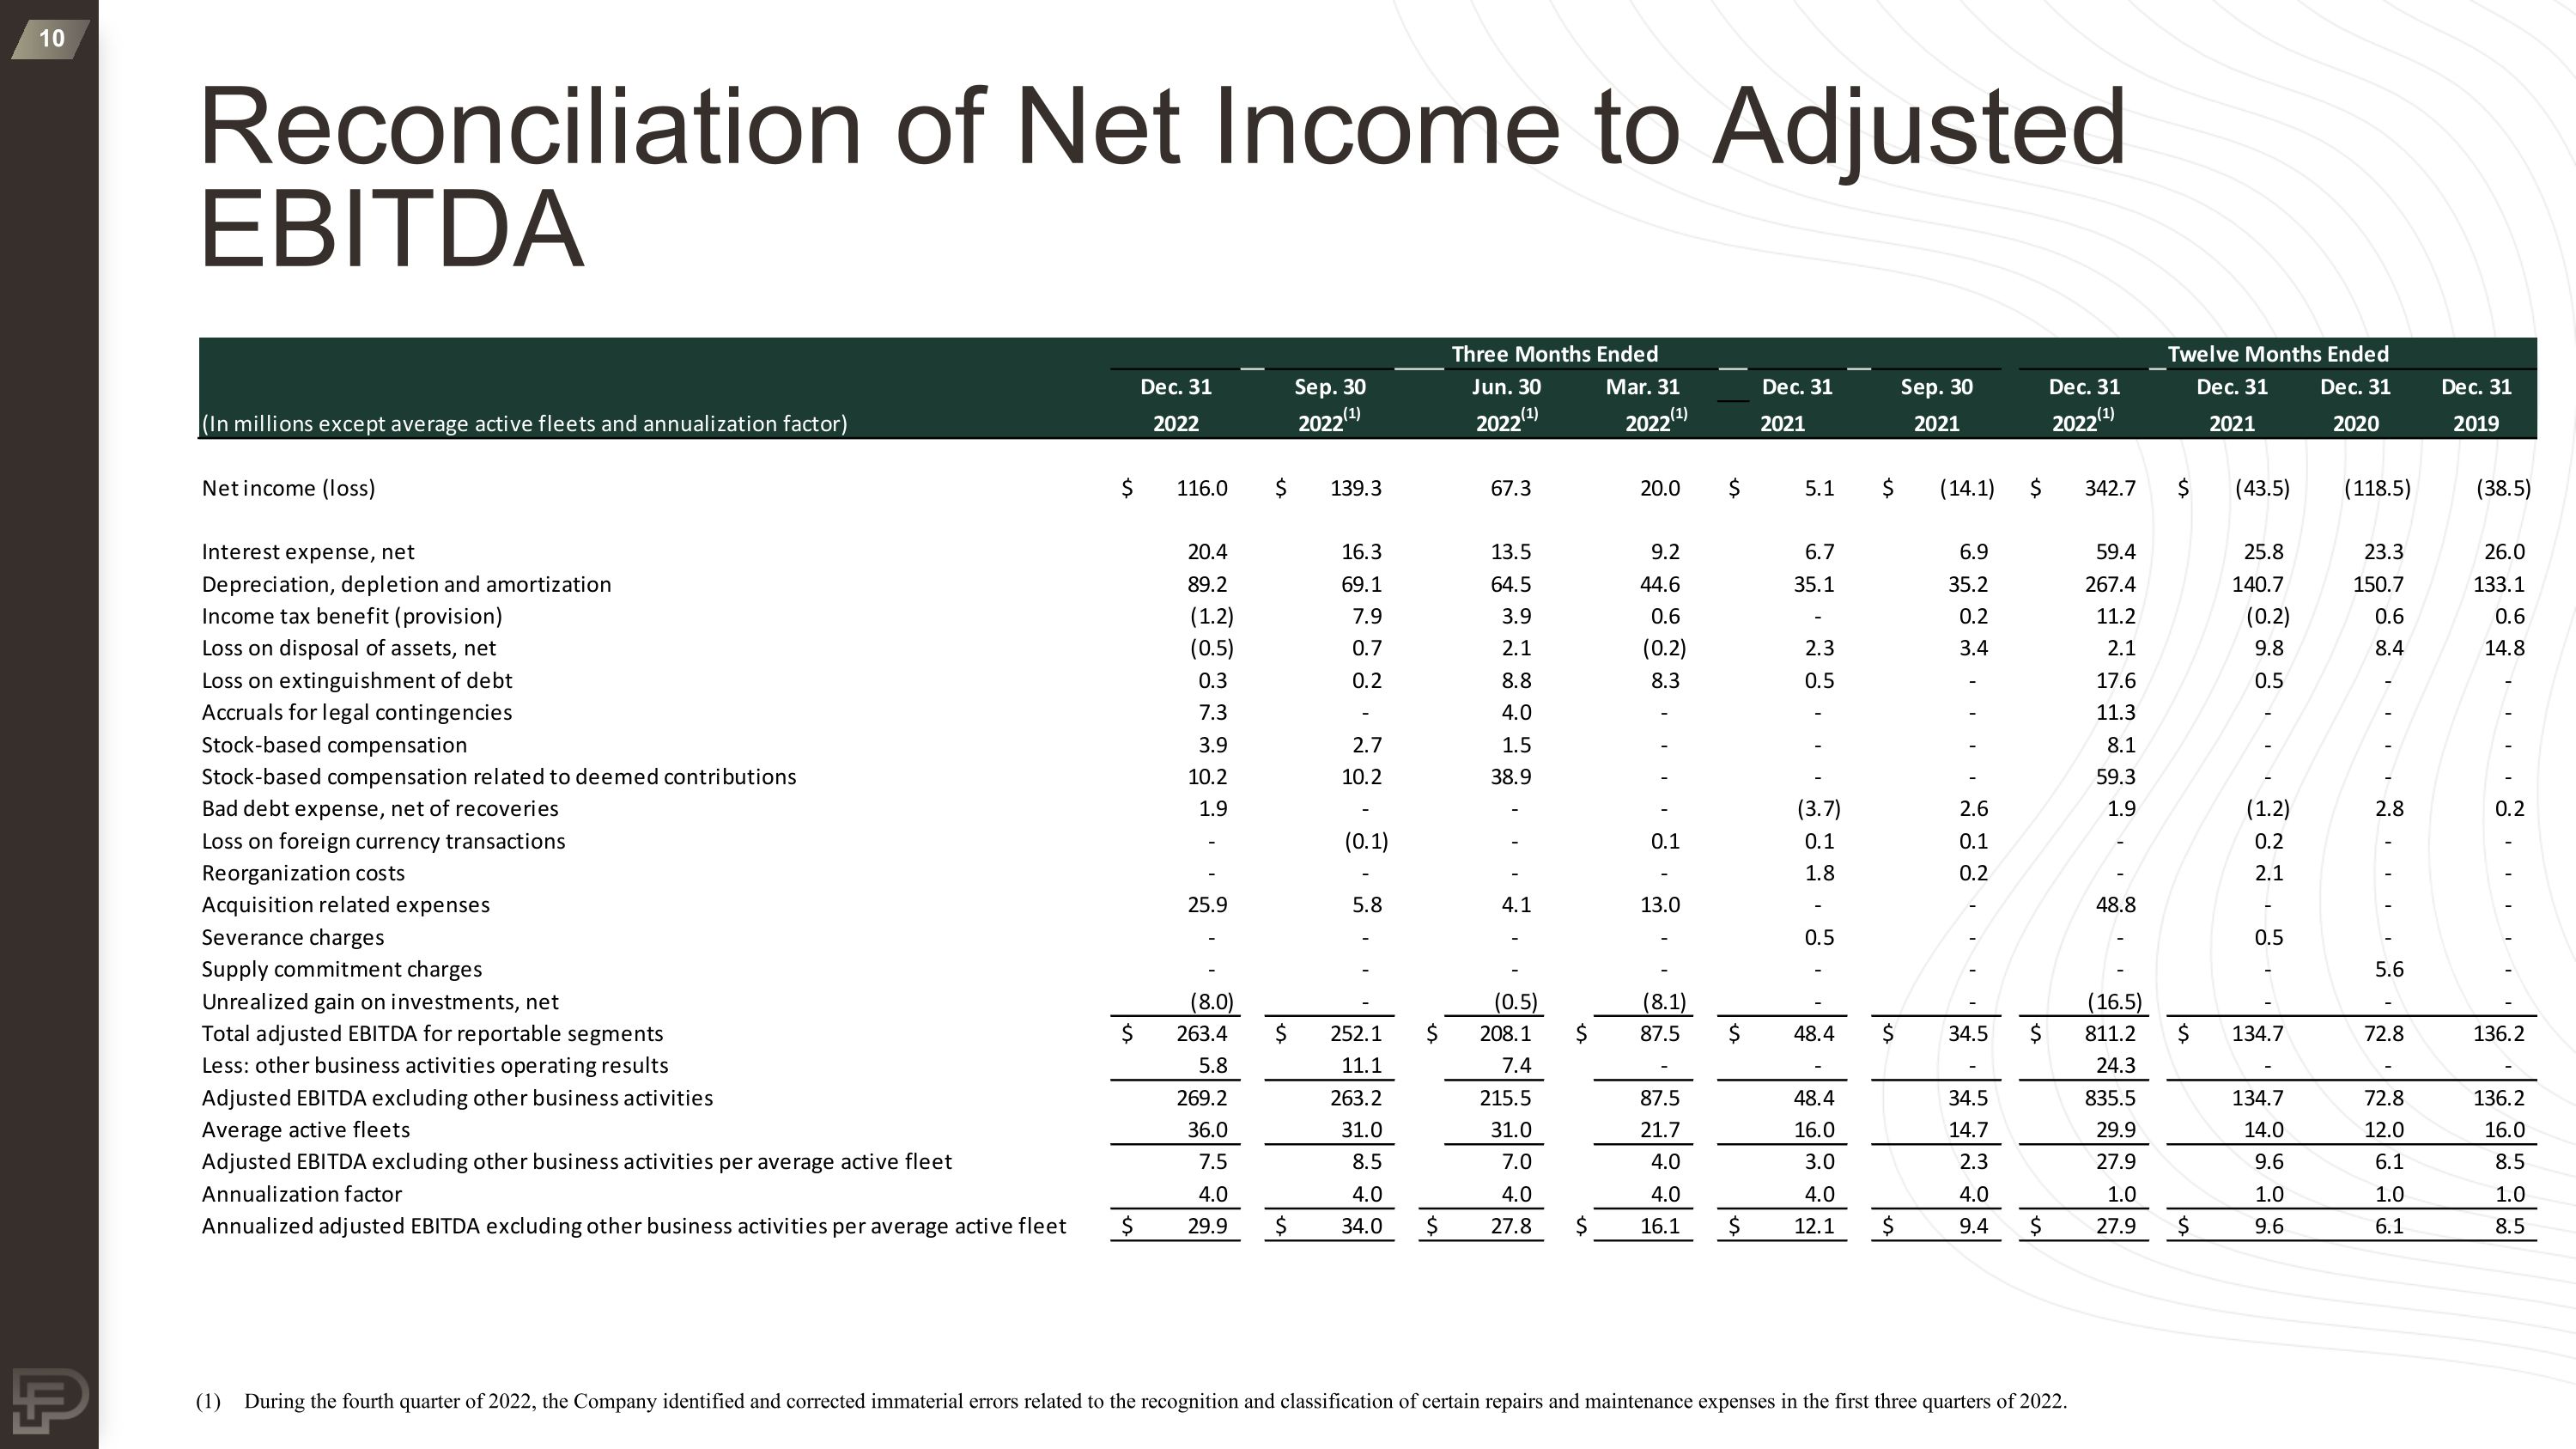
Reconciliation of Net Income to Adjusted EBITDA (1) During the fourth quarter of 2022, the Company identified and corrected immaterial errors related to the recognition and classification of certain repairs and maintenance expenses in the first three quarters of 2022.